

ISSN: 0973-7510
E-ISSN: 2581-690X
Photosynthetic hydrogen (H2) production by green algae has fascinated biologists and energy experts, due to the potential application of this process for renewable energy. In this study, H2 photoproduction and PSII photochemical activities were investigated in Chlorella sorokiniana exposed to simultaneous nitrogen limitation and sulfur (S-) and/or phosphorus (P-) deprivation. Under S-deprivation, C. sorokiniana produced about 48.2 mL L-1 of H2. Moreover, simultaneous nitrogen limitation (0.7 mM NH4Cl) and sulfur- and/or phosphorus-deprivation significantly increased H2 production of C. sorokiniana over that of S-deprivation alone. Maximum H2 outputs of 77.3, 98.1 and 125.1 mL L-1 were obtained in the N-limited cultures exposed to P-deprivation (TAP-P), S-deprivation (TAP-S) and simultaneous S- and P-deprivation (TAP-S-P), respectively. The average rate of H2 production for the N-limited culture exposed to TAP-P, TAP-S and TAP-S-P was 1.07, 1.36 and 1.50 mL L-1 h-1, respectively. Interestingly, the H2 inducement time in the culture subjected to simultaneous N-limitation and S- and/or P-deprivation was much shorter than that of traditional S-deprivation. The photosynthetic inhibitors, 3-(3,4-dichlorophenyl)-1,1-dimethylurea (DCMU) and 2,5-dibromo-3-methyl-6-isopropylp-benzoquinone (DBMIB) repressed H2 production in TAP-S-P (0.7 mM NH4Cl) medium by 68.04% and 98.65%, respectively. The conditions of simultaneous N-limitation, S- and P-deprivation provided another efficient method for inducing H2 production in C. sorokiniana. In addition, we also found that two-thirds of the required electrons were generated from the splitting of H2O in PSII and that the remaining one-third possibly came from some other substrate catabolism.
Chlorella sorokiniana, Hydrogen production, Nitrogen limitation, Phosphorus and Sulfur deprivation
Photoproduction of hydrogen by microalgae has roused worldwide attention because it holds the promise of generating a renewable fuel from the most abundant natural resources, sunlight and water 1. In 1939, for the first time under anaerobic conditions, hydrogen production was reported from the unicellular green alga Scenedesmus obliquus 2. However, H2 production lasted only for a few minutes and the yield was very low. In 2000, Melis and his co-worker created the S-deprivation inducing H2 photoproduction model because S-deficiency damaged photosynthetic oxygen complex, so the oxygen released by photosynthesis cannot compensate the respiratory oxygen consumption, and gradually anaerobic status was achieved and hydrogenase activity was induced, which dramatically improved photosynthetic H2 photoproduction efficiency and prolong the hydrogen producing period to hundred of hours 3. It is well-known that nitrogen and phosphorus are essential nutrients for cell growth and are quite easily absorbed and utilized than the sulfur. Based on the fact that under nitrogen or phosphorus limitation, photosynthesis as well as the photosynthetic oxygen release efficiency can also be significantly reduced. N-deprivation is an alternative mechanism to stimulate H2 production in some algal species, i.e., in nitrogen-fixing Anabaena cylindrical and non-nitrogen-fixing Arthrospira maxima, Arthrospira sp. 4–6. In addition, it has been demonstrated that N- or P-deprivation can also induce H2 production in a similar way to S-deprivation in the green alga C. reinhardtii. However, the H2 yield is lower and the induction time to reach an anoxic state is much longer under N- or P-deprivation than that under S-deprivation 7, 8.
In the previous work, we develop a nitrogen-deficient or nitrogen limitation induced H2 photoproduction mode 9, and phosphorus limitation induced H2 production in green microalgae 10, 11. We have demonstrated that nitrogen limitation was more suitable factor in the induction of H2 production than S-deprivation in Chlorella protothecoides. Now, photosynthetic H2 photoproduction inducement showed the trends of diverse. We found that not only single stress can induce photosynthetic H2 photoproduction, but also the double stresses (such as low nitrogen + S-deficiency stress or low nitrogen + P-deprivation stress) could work too 9, 11–13. Simultaneous N-limitation and S-deprivation could enhance the H2 photoproduction in green algae C. protothecoides 9, 12–13. Under such double stresses, the photosynthetic H2 photoproduction in C. protothecoides significantly increased because the anaerobic condition and hydrogenase activity induction became much easily.
In the present study, the combination of two or more kinds of stresses was created to stimulate H2 photoproduction in Chlorella sorokiniana. To find the best culture condition and understand the process of H2 photoproduction in C. sorokiniana exposed to simultaneous N-limitation and S- and/or P-deprivation, the cell growth, the amounts of H2 photoproduction, physiological/biochemical changes, and PSII photochemical activity were determined.
Strain and culture conditions
In this study C. sorokiniana strain KU204 was used. The algal cultures were pre-cultured in TAP (Tris-Acetate-Phosphate) medium 14 or TAP medium with low ammonium concentration (N-limited medium). The concentration of ammonium in TAP medium was 7 mM (100% N). The concentration of ammonium in N-limitation medium was 0.7mM (10% N). The algal cultures were exposed to a light intensity of 35–40 µmol photons m-2 s-1, with a light/dark cycle of 14:10 h at pH 7.3 ± 1, 25 ± 1°C.
H2 photoproduction under normal and stress conditions
For sulfur and nitrogen deprivation, algal cultures pre-grown in TAP medium were centrifuged at 4,000 rpm for 5 min and washed twice with S-deprivation (TAP-S) and N-deprivation (TAP-N) media. For simultaneous nitrogen limitation, sulfur- and/or phosphorus-deprivation, the algal cells, pre-grown in N-limited medium, were centrifuged, washed twice and transferred to simultaneous N-limitation and S-deprivation (TAP-S (0.7 mM NH4Cl)), N-limitation and P-deprivation (TAP-P (0.7 mM NH4Cl)) and N-limitation, S- and P-deprivation (TAP-S-P (0.7 mM NH4Cl)) media. These all above media were prepared as previously described 9, 11–13. For H2 photoproduction, the algal cells with an initial cellular density of about 2.5–3.5×10⁷ cells mL-1 were subjected to TAP and stress medium conditions. Hydrogen photoproduction from the algal cells under these conditions was studied in 650 ml cylindrical glass vessels closed with a butyl rubber stopper and fitted with a gas tight pipe 11. The algal cultures were exposed to 35–40 µmol photons m-2 s-1 continuous, fluorescent, white light at 25°C. The gas phase in the graduated cylinder was analyzed using a gas chromatograph as described by He et al. 6.
Effect of DCMU and DBMIB on H2 photoproduction of C. sorokiniana
The cultures were inoculated into 20 ml glass vials closed with butyl rubber stoppers as described by He et al. 6. After 12h of illumination, 10 µM DCMU (3-(3,4-dichlorophenyl)-1,1-dimethylurea) or 10 µM DBMIB (2,5-dibromo-3-methyl-6-isopropylp-benzoquinone) were added to the vials, after which the vials were flushed with argon gas to remove air in the headspace. Each set of experiments was carried out in triplicate.
Other analytical procedures
Hydrogen and oxygen contents were determined using a gas chromatograph (GC-112A, Shanghai Phenix Optical Scientific Instrument Co. Ltd., China) equipped with a molecular sieve 5Å column using a thermal conductivity detector according to He et al. 6. The total chlorophyll content was extracted from the cell cultures using 95% methanol and measured as described by Liu15. Cell density was counted using a hemocytometer under a light microscope (CH 30, Olympus Imaging Corp., Japan). The actual quantum yield of primary photochemistry (FPSII) and the maximal quantum yield of primary photochemistry (Fv/Fm) were measured using a FMS-2 (Hansatech Instruments Ltd., King’s Lynn, UK) as described by Zhang et al. 13 and White and Critchley 16.
H2 photoproduction during nitrogen or sulfur deprivation
In TAP and TAP-N media, small amounts of H2 were detected (Fig. 1a). Under these conditions, the algae are not sufficient to produce H2 level to displace any water inside the graduated cylinders. For TAP and N-deprived cultures, the final H2 outputs were 0.7 and 12.0 mL L-1, respectively. In addition, this alga could produce O2 after 12 h in TAP medium. The total amount of O2 was about 25.0 mL L-1 (Fig. 1b). In contrast, the algal cells did not produce O2 in the N-deprived cultures during the experiments.
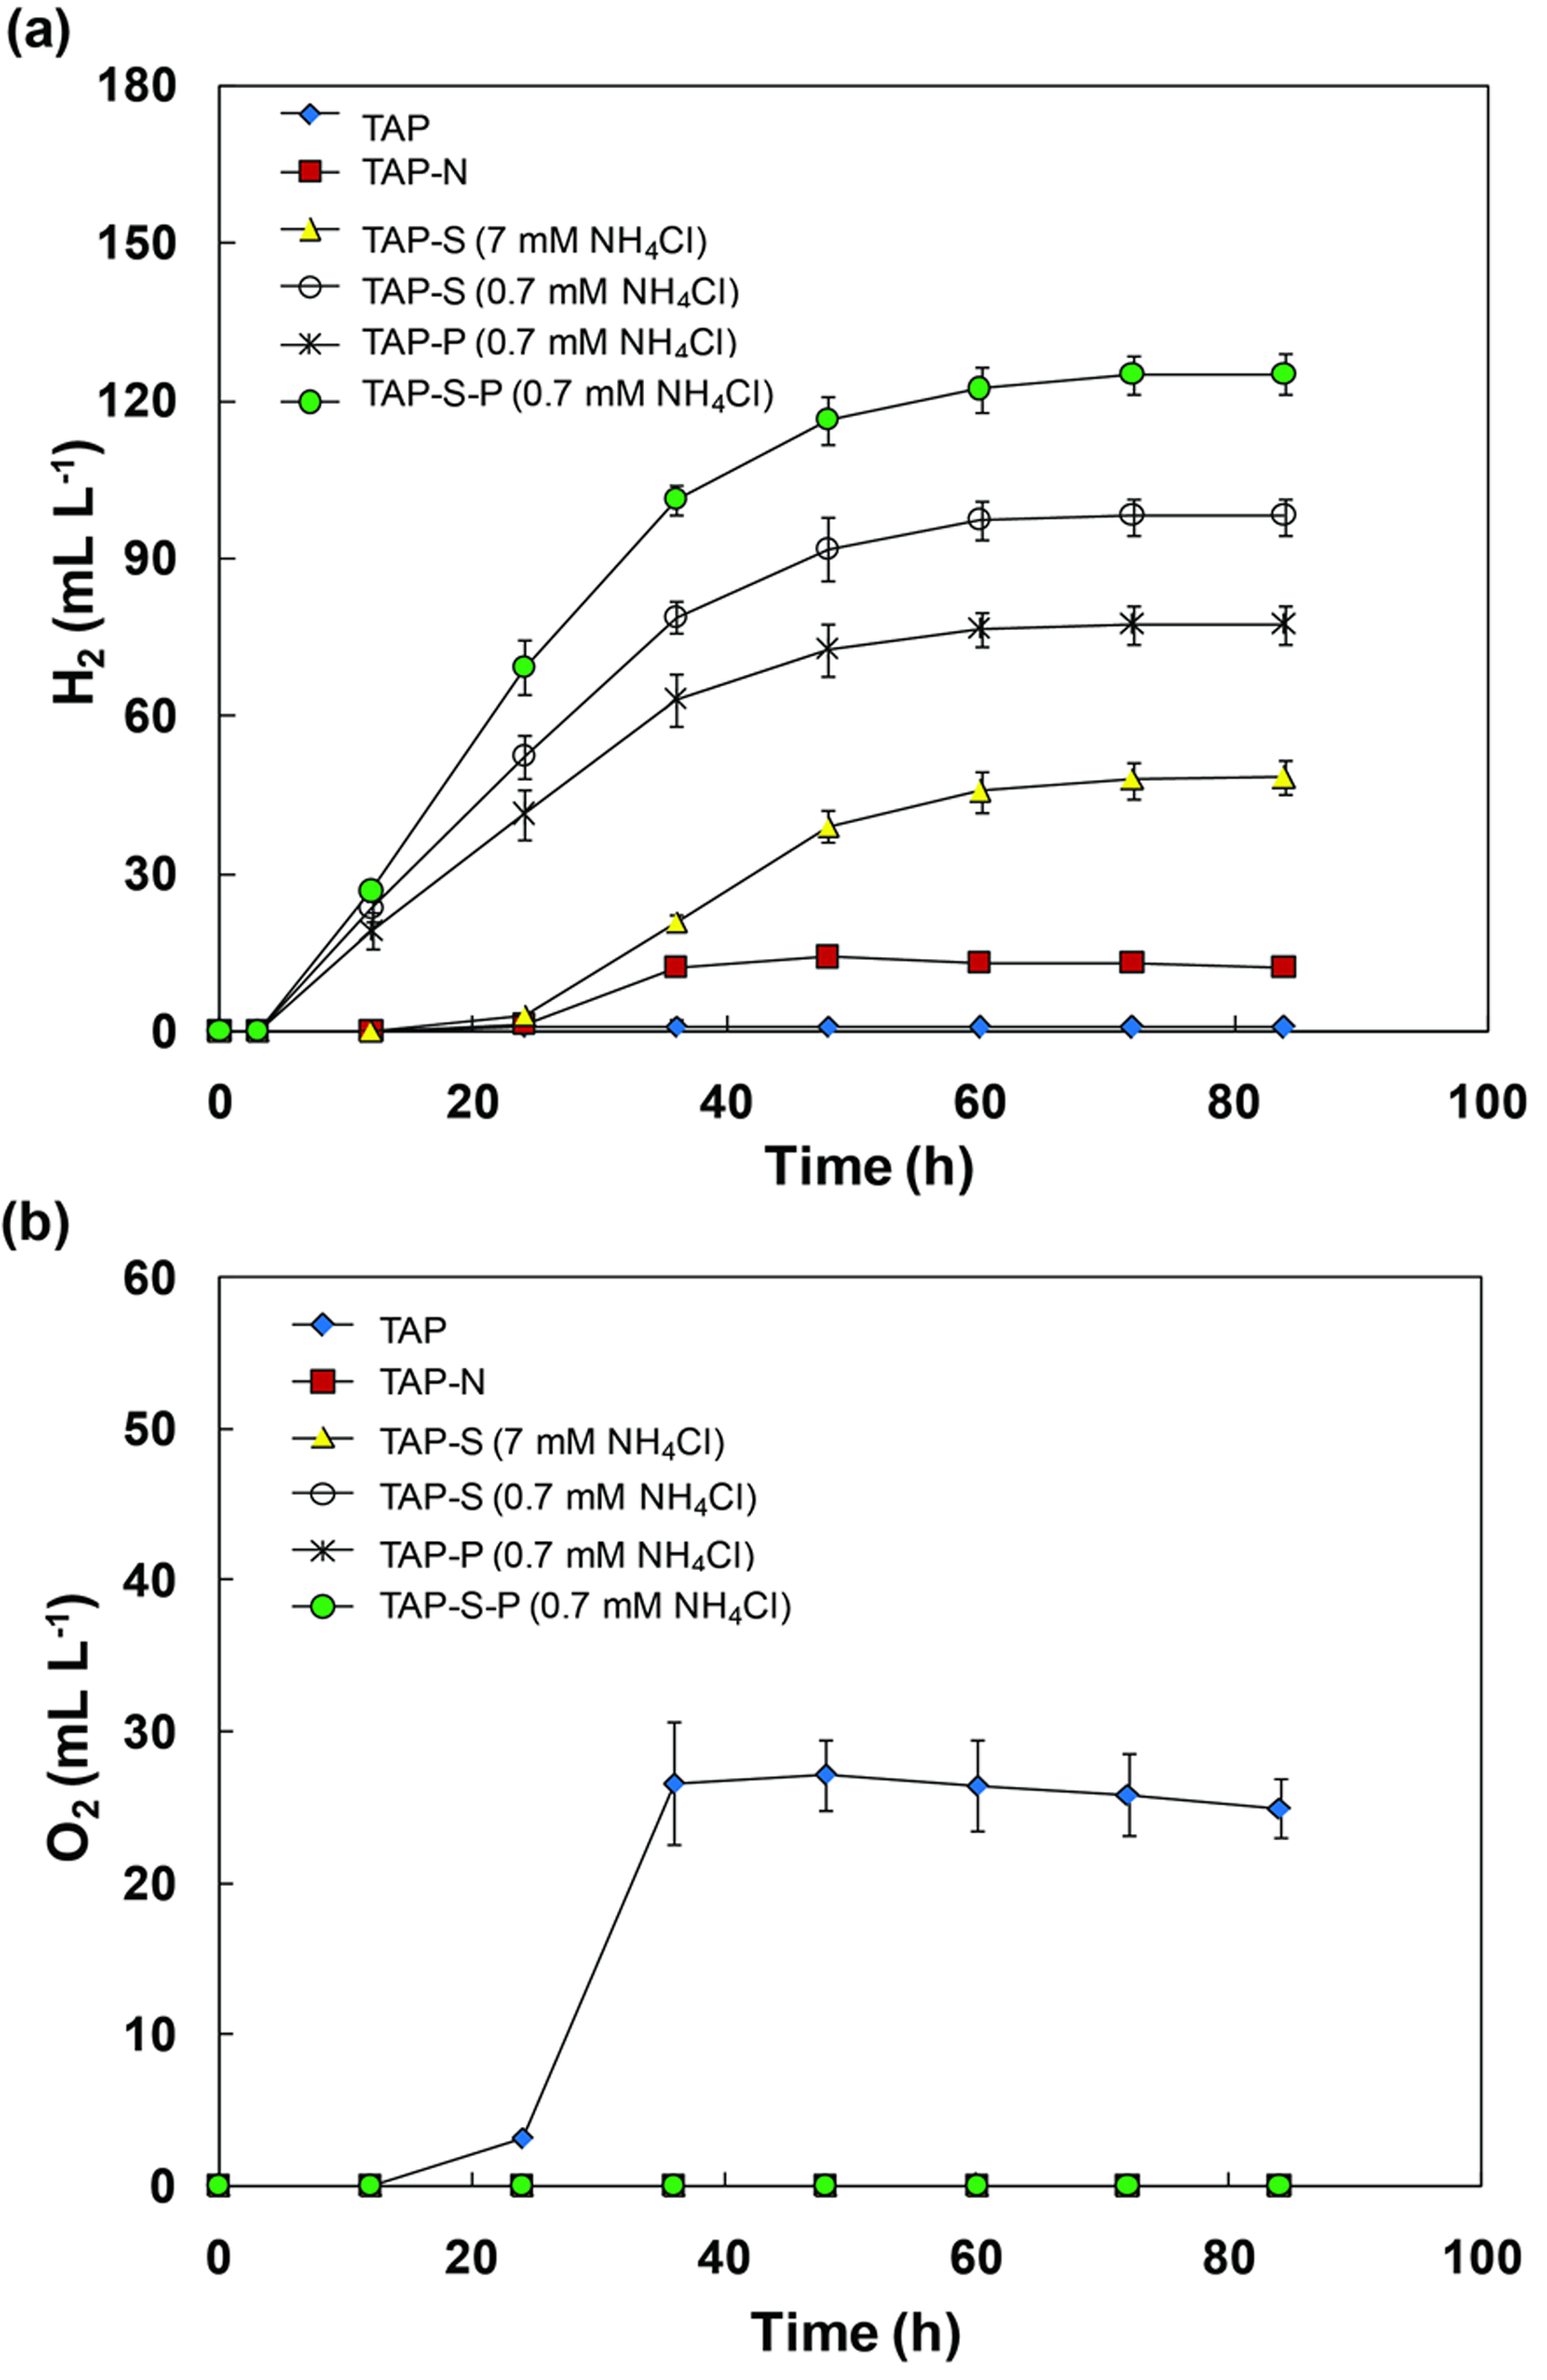
Fig. 1. H2 photoproduction and O2 evolution of C. sorokiniana cells pre-cultured under TAP or nitrogen limited medium and then grown under sulfur, nitrogen or phosphorus deprivation. Volume of H2 yield detected in six treatments with pronounced H2 production (TAP, TAP-N, TAP-S (7 mM NH4Cl), TAP-S (0.7 mM NH4Cl), TAP-P (0.7 mM NH4Cl), TAP-S-P (0.7 mM NH4Cl)) (a), volume of O2 evolution in TAP cultures (b). All points are the mean of three independent measurements.
Under TAP medium, a short-lived anoxia was observed at the onset of the incubation, which might have resulted from an increase in respiration after centrifugation and the transfer to fresh TAP medium. However, once cells had adapted to the fresh TAP medium, the photosynthesis activity was higher than respiration, and then O2 evolution was observed. For S-deprived conditions, C. sorokiniana could produce 48.2 mL L-1 H2 within 84 h (Fig. 1a). This finding was similar to previous studies which demonstrated that some algal cells cultivated in S-deprived conditions could evolve H2 gas after incubation 17–21. Indeed, in the S-deprived medium, the O2-evolving activity of the alga significantly declined shortly after incubation, resulting in an anaerobic environment in the closed photobioreactors. Under these conditions, hydrogenase activity was activated to catalyze the H2 production reaction 3. Moreover, C. sorokiniana cells under N-deprivation consumed the O2 in the headspace completely and could sustain anaerobiosis during the incubation (Fig. 1b); however, the H2 output was very low (Fig. 1a).
H2 photoproduction exposed to simultaneous nitrogen limitation, sulfur- and/or phosphorus-deprivation
Cells of C. sorokiniana were further examined for H2 production in simultaneous N-limitation (0.7 mM NH4Cl) and S- and/or P-deprivation. The results revealed that H2 photoproduction was significantly enhanced under these culture conditions compared with TAP-S medium with 7 mM NH4Cl (Fig. 1a). Cultures in TAP-S under N-limitation produced 98.1 mL L-1 of H2. The combination of N-limitation and P-deprivation could also generate H2. The final H2 output for TAP-P cultures under N-limitation was 77.3 mL L-1. In addition, N-limited cultures with simultaneous S- and P-deprivation showed the highest H2-producing ability compared with the other cultures in this experiment. The final H2 output for TAP-S-P cultures under N-limitation was 125.1 mL L-1 (Fig. 1a). Interestingly, H2 production in the culture under TAP-S medium appeared approximately 12 h after closure the bioreactors. On the other hand, in the culture subjected to simultaneous N-limitation and S- and/or P-deprivation, H2 production emerged 3 h earlier, resulting in higher H2 yield. Thus we suggest that the condition of simultaneous N-limitation with S- and P-deprivation is the best efficient method for inducing H2 production in C. sorokiniana.
The nitrogen level in the medium is a main factor that affects the H2 production. When algal cells were grown in N-limitation medium (0.7 mM NH4Cl), the cells generated a lot of H2 yield when exposed to S- and/or P-deprivation. In this study, C. sorokiniana showed the highest H2-producing capacity (1.50 mL L-1 h-1 and generating 125.1 mL L-1) under TAP-S-P and N- limitation. The chlorophyll content under these conditions was 5–6 mg L-1 (Fig. 3a). Assuming that C. sorokiniana could have a chlorophyll content of 10–12 mg L-1, this alga could produce 250.2 mL L-1 of H2. The best-known microalga with high H2 production remains C. reinhardtii, which accumulates H2 to approximately 100–270 ml L-1 with a chlorophyll content of 9–20 mg L-1 3, 19. To date, none of the tested strains have exhibited higher efficiency than C. reinhardtii. However, it remains a possibility that some species may be more suitable to use in a large scale culture than C. reinhardtii. Lu et al. 22 reported that C. sorokiniana has important industrial microalgal potential for biofuel production. In addition, this alga has a high specific growth rate (0.27 h-1) and is tolerant to high irradiance, high temperature and high CO2 concentrations 23, 24. The seat tributes suggest that this microalga has the potential to compete with C. reinhardtii for industrial H2 production.
Physiological and biological changes in C. sorokiniana cells under nutritional stress
C. sorokiniana cells grown in TAP medium were small, ellipsoid, or slightly ovate in shape (Fig. 2a). This predominant cellular morphology changed dramatically under single and multiple stress conditions (TAP-N, TAP-S, simultaneous N-limitation, S- and/or P-deprivation) after 3 days of incubation (Fig. 2b-f). In N-deprived cultures, there were no distinct changes in the cell sizes, but the form of the cells became spherical instead of ellipsoid (Fig. 2b). Cells grown in TAP-S, or simultaneous N-limitation, S- and/or P-deprivation showed a clear increase in cell volume and the cell shape became spherical compared with regular cells in TAP medium. The color of the algal cells turned dark green when exposed to TAP medium. However, cells in N-limited or N-deprived conditions exhibited a light green color. This might be ascribed to chlorophyll degradation under nitrogen deficiency 25. The swelling of S-deprived cells (Fig. 2c) was similar to the cell morphology changes of C. reinhardtii under S-deprivation reported by Zhang et al. 26 whose research showed that C. reinhardtii had increased cell volume and the shape of cells became spherical when cultured under S-deprived conditions. They also concluded that these morphological changes under S-deprivation were associated with an accumulation of intracellular starch.
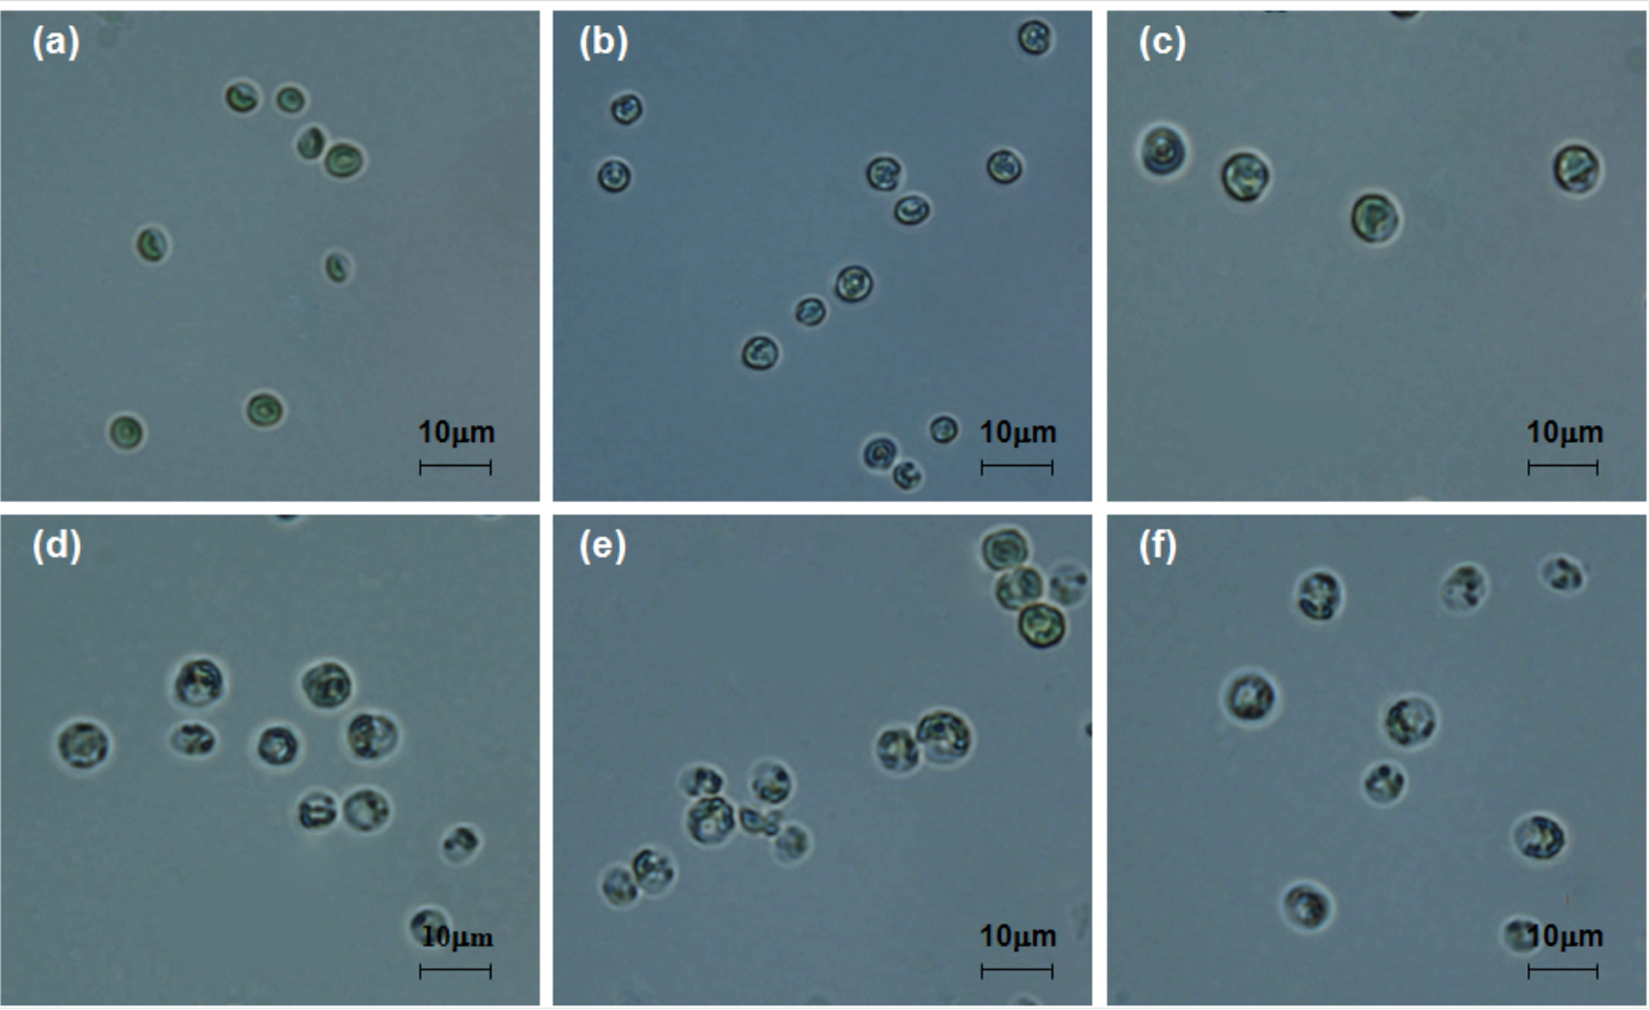
Fig. 2. Microscopic images of C. sorokiniana incubated in various TAP media, TAP (a), TAP-N (b), TAP-S (7 mM NH4Cl) (c), TAP-S (0.7 mM NH4Cl) (d), TAP-P (0.7 mM NH4Cl) (e), TAP-S-P (0.7 mM NH4Cl) (f).
The total chlorophyll content in all treatments, except for N-deprived condition, increased during the culture period. The chlorophyll content in TAP medium displayed the significant increase, followed by S-deficient medium. For these cultures, the chlorophyll content increased transiently within the first 72 h, and subsequently become constant (Fig. 3a). However, the chlorophyll content in simultaneous N-limitation, S- and P-deprivation increased slightly within the initial 24 h of incubation, then decreased and finally maintained a constant level (Fig. 3a). For N-deprived cultures, the chlorophyll content gradually decreased during incubation. The chlorophyll content decreased on N-limitation and N-deprivation medium during the culture process (Fig. 3a), which indicated that nitrogen limitation seriously repressed chlorophyll synthesis. This observation was supported by El-Sheekh 27, Gordillo et al. 28 and Turpin 29 who found that decreases in the pigment contents, photosynthesis and biomass productivity in algal cells are typical responses following exposure to N-limitation. Piorreck et al. 30 reported that decreasing the nitrogen level in the culture medium of green algae and cyanobacteria caused substantial decreases in the chlorophyll contents. They also concluded that the chlorophyll contents were reduced, indicating a rapid reduction or even breakdown of all the chloroplast apparatus and a subsequent decrease in growth. Similar to the chlorophyll change, cell numbers in TAP and TAP-S cultures increased transiently in the initial 48 h and remained constant. In contrast, the cell numbers in other cultures increased slightly within the first 24 h, and did not change after 24 h of incubation (Fig. 3b).
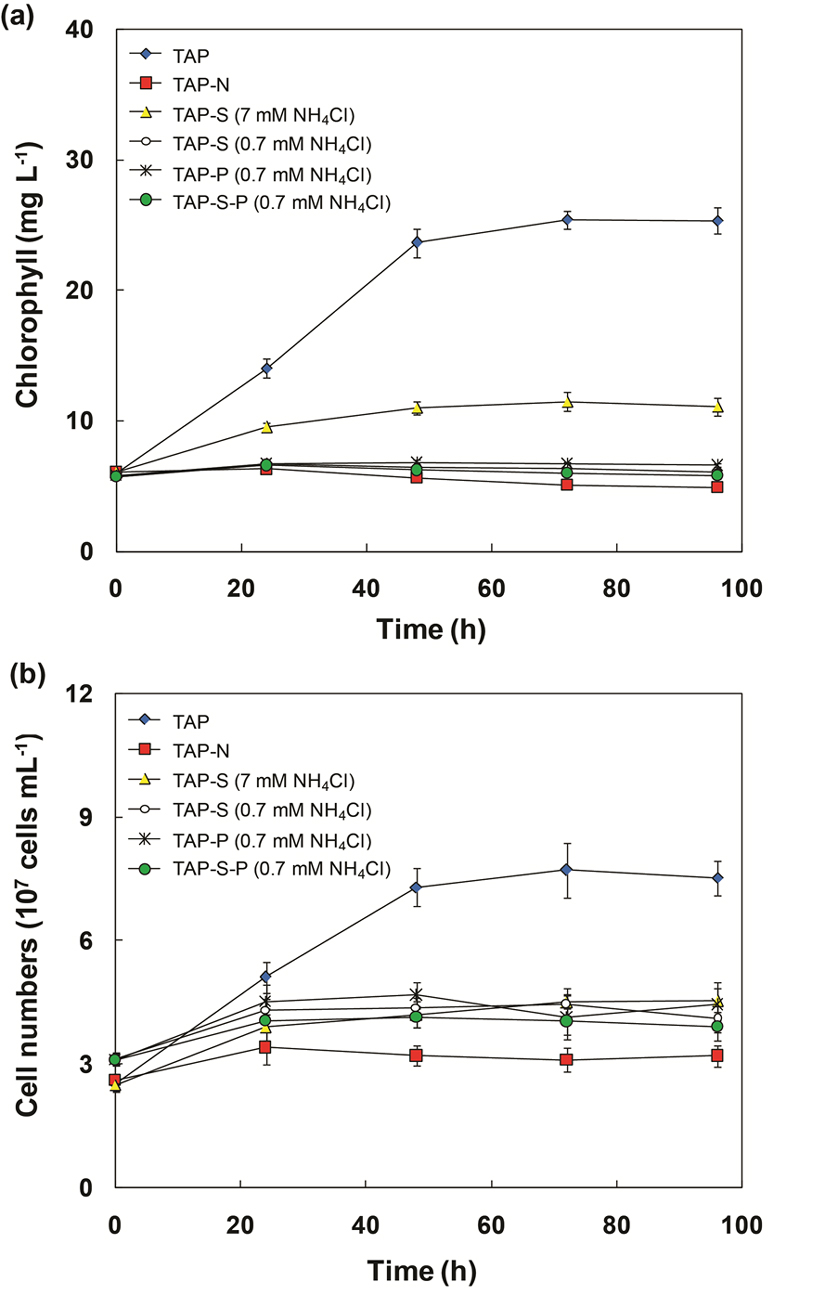
Fig. 3. Change in chlorophyll content (a) and cell numbers (b) of C. sorokiniana during the incubation of synchronized cells in TAP, TAP-N, TAP-S (7 mM NH4Cl), TAP-S (0.7 mM NH4Cl), TAP-P (0.7 mM NH4Cl), TAP-S-P (0.7 mM NH4Cl) media.
As shown in Fig. 4, the pH value increased during the incubation in all cultures. The pH in TAP, TAP-N and TAP-S medium increased from an initial pH 7.3 to a maximum pH value 8.41, 8.27 and 8.34, respectively at the end of incubation. In contrast, cultures in TAP-S, TAP-P, TAP-S-P medium under N limitation showed a moderate increase of pH value rising to 8.11, 8.09 and 8.04 in TAP-S, TAP-P and TAP-S-P, respectively. In all the treatments in this experiment, the increase in pH value during periods of culture resulted from photosynthetic consumption of dissolved CO2 and the absorption of acetate 17, 31. For cultures in simultaneous N-limitation and S- and/or P-deprivation, moderate enhancement of the pH value might be ascribed to the decline in the photosynthetic activity (Fig. 5), which would lead to the reduction of CO2 fixation and the assimilation of acetate.

Fig. 4. Change in pH of C. sorokiniana during the incubation of synchronized cells in TAP, TAP-N, TAP-S (7 mM NH4Cl), TAP-S (0.7 mM NH4Cl), TAP-P (0.7 mM NH4Cl), TAP-S-P (0.7 mM NH4Cl) media.
Change in chlorophyll fluorescence
The chlorophyll fluorescence parameter Fv/Fm is broadly used to estimate the maximum quantum yield of PSII photochemistry. Fig.5a shows that the initial value of Fv/Fm in cultures grown in TAP medium (~0.6) was higher than that in N-limited cultures (~0.4). For simultaneous N-limitation, S- and P-deprivation, the Fv/Fm value decreased rapidly from 0.39–0.40 to 0.27–0.29 within 24 h after incubation and further decreased thereafter. After 72 h, a value of 0.02–0.04 was observed. Similar to the Fv/Fm value, the value of FPSII in all treatments decreased over time (Fig. 5b). However, the value of FPSII decreased more rapidly and more strongly than Fv/Fm.
Nitrogen deficiency also leads to degradation of ribulose-1, 5-bisphosphate carboxylase oxygenase, the key enzyme in photosynthetic Calvin cycle, which concurs with a decline in the efficiency of PSII photochemical activity 13, 32. As shown in Fig. 5a and 5b, values of Fv/Fm and FPSII both reduced quickly after the beginning of N-limitation, indicating that N-limitation had a severe effect on the PSII photochemical activity. This observation agreed with the results obtained by Philipps et al. 8 who mentioned that the decline in values of both Fv/Fm and FPSII was observed in C. reinhardtii under a combination of S- and N-deprived condition. The obtained results suggest that the combination of N-limitation and S- and/or P-deprivation conditions reduced the PSII photochemical activity and the oxygen release in PSII center as compared with TAP medium, then lead to anaerobic status which further induce the hydrogenase activation and H2 photoproduction in C. sorokiniana.
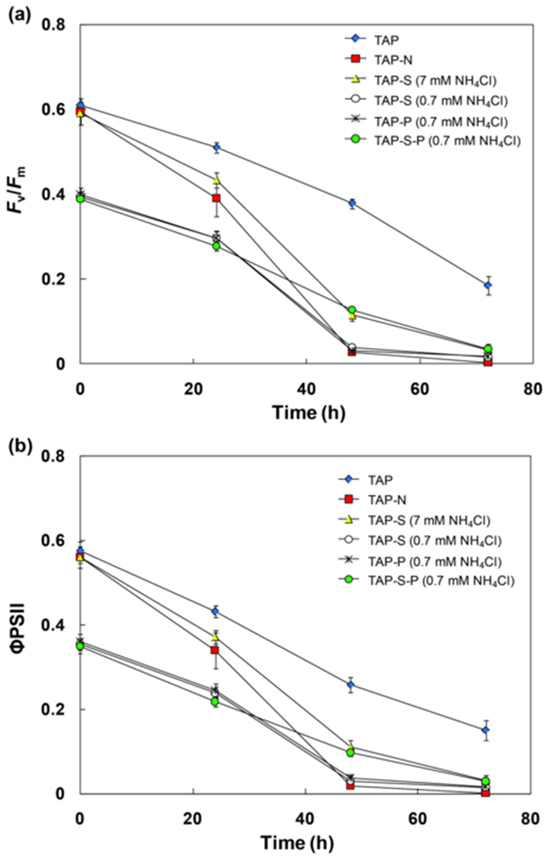
Fig. 5. Change in chlorophyll a fluorescence parameter Fv/Fm(a), ΦPSII(b) in C. sorokiniana incubated in TAP, TAP-N, TAP-S (7 mM NH4Cl), TAP-S (0.7 mM NH4Cl), TAP-P (0.7 mM NH4Cl), TAP-S-P (0.7 mM NH4Cl) media.
Effect of DCMU and DBMIB on H2photoproduction
Photosynthetic inhibitors DCMU (an inhibitor of the QB site of PSII) and DBMIB (an inhibitor of the QO site of the cytochrome b6/f complex) were added into the cultures to study how many electrons for H2 photoproduction came from PSII. As shown in Table 1, the rate of H2 evolution by C. sorokiniana was inhibited after the addition of DCMU and DBMIB during the process of incubation in simultaneous N-limitation and S- and P-deprivation cultures. The reduction in the final H2 photoproduction was ~68.04% and ~98.65% for treatments with DCMU and DBMIB, respectively, compared to the control group without inhibitors. Therefore, our results indicated a significant involvement between H2 photoproduction and PSII.
Table (1):
Effect of DCMU and DBMIB on H2 production by C. sorokiniana incubated in simultaneous N-limitation and S- and P-deprivation (TAP-S-P (0.7 mM NH4Cl)).
| H2 yield (mL L–1) | ||||||
|---|---|---|---|---|---|---|
| 12 h | 24 h | 36 h | 48 h | 60 h | 72 h | |
| Control +DCMU +DBMIB H2 production inhibited by DCMU (%) H2 production inhibited by DBMIB (%) |
21.75±0.55 8.47±0.10 0.52±0.00 61.05% 97.63% |
36.64±2.61 9.96±1.05 0.52±0.00 72.81% 98.59% |
40.28±0.74 12.47±1.52 0.52±0.00 69.03% 98.71% |
40.81±0.08 13.10±0.56 0.54±0.01 69.03% 98.67% |
41.31±0.17 13.17±0.83 0.55±0.01 68.12% 98.67% |
41.34±0.16 13.21±0.78 0.56±0.02 68.04% 98.65% |
In general, the electrons for H2 production come from three main sources in green algae. First, the electrons come directly from the photosynthetic reaction center PSII where water is split 33. Second, the organic sources such as starch stored in the cell supply electrons by oxidation through the indirect pathway 3. Third, dark fermentation also provides parts of electrons 34. The addition of DCMU decreased the H2 photoproduction by ~68.04% in TAP-S-P (0.7 mM NH4Cl) cultures. Therefore, approximately 68.04% of the electrons for H2 synthesis by C. sorokiniana originated from the direct use of light energy to split water. This observation is supported by Volgusheva et al. 21 who mentioned that the H2 production by C. reinhardtii exposed to S-deprivation was mainly inhibited by the addition of DCMU. They concluded that the majority of electrons donated to H2ase were through water splitting by PSII. The addition of DBMIB resulted in the greatest repression of H2 photoproduction by 98.65% (Table 1), which indicated that most electrons donated to H2ase were transferred through cytochrome b6/f. Antal et al. 35 reported that the addition of DBMIB in the culture medium of C. reinhardtii exposed to S-deprivation caused a substantial decrease in H2 output by ~97%. They also concluded that the electrons transported via the PQ pool were essential for H2 production.
The microalga C. sorokiniana had the ability to produce H2 under conditions of nutrient deprivation. The H2 photoproduction of C. sorokiniana was enhanced by using a combination of N-limitation and S- and/or P-deprivation medium. The maximum H2 yield and average H2 production rate in TAP-S-P (0.7 mM NH4Cl) medium were ~125.1 mL L-1 and ~1.50 mL L-1 h-1, respectively. The H2 yield increased 2.5-fold compared with the TAP-S (7 mM NH4Cl) medium. Furthermore, the addition of DCMU and DBMIB in TAP-S-P (0.7 mM NH4Cl) medium repressed the H2 photoproduction by 68.04% and 98.65%, respectively, compared with the control treatment. These results indicated that the majority of electrons (2/3) for H2 synthesis by C. sorokiniana exposed to TAP-S-P (0.7 mM NH4Cl) medium came from PSII photosynthesis and the remaining (1/3) energy came from organic substrate catabolism.
Acknowledgements
This work was financially supported by the National Natural Science Foundation of China (41676142). We would like to thank the Institute of Oceanology, Chinese Academy of Sciences for assisting with laboratory space and equipment used in this research. We also thank Dr. John P van der Meer for English editing.
- Khetkorn W, Rastogi RP, Incharoensakdi A, Lindblad P, Madamwar D, Pandey A, et al. Microalgal hydrogen production–A review. Bioresour Technol. 2017; 243:1194–206.
- Gaffron H. Reduction of CO2 with H2 in green plants. Nature. 1939; 143:204–5.
- Melis A, Zhang L, Forestier M, Ghirardi ML, Seibert M. Sustained photobiological hydrogen gas production upon reversible inactivation of oxygen evolution in the green alga Chlamydomonas reinhardtii. Plant Physiol. 2000; 122:127–35.
- Weissman JC, Benemann JR. Hydrogen production by nitrogen-starved cultures of Anabaena cylindrica. Appl Environ Microbiol. 1977; 33:123–31.
- Ananyev G, Carrieri D, Dismukes GC. Optimization of metabolic capacity and flux through environmental cues to maximize hydrogen production by the cyanobacterium “Arthrospira (Spirulina) maxima”. Appl Environ Microbiol. 2008; 74:6102–13.
- He ML, Li L, Liu JG. Isolation of wild microalgae from natural water bodies for high hydrogen producing strains. Int J Hydrogen Energy. 2012; 37:4046–56.
- Batyrova KA, Tsygankov AA, Kosourov SN. Sustained hydrogen photoproduction by phosphorus deprived Chlamydomonas reinhardtii cultures. Int J Hydrogen Energy. 2012; 37:8834–9.
- Philipps G, Happe T, Hemschemeier A. Nitrogen deprivation results in photosynthetic hydrogen production in Chlamydomonas reinhardtii. Planta. 2012; 235:729–45.
- He ML, Li L, Zhang LT, Liu JG. The enhancement of hydrogen photo-production in Chlorella protothecoides exposed to nitrogen limitation and sulfur deprivation. Int J Hydrogen Energy. 2012; 37:16903–15.
- Batyrova K, Gavrisheva A, Ivanova E, Liu JG, Tsygankov A. Sustainable hydrogen photoproduction by phosphorus-deprived marine green microalgae Chlorella sp. Int J Mol Sci. 2015; 13:2705–16.
- Pongpadung P, Liu JG, Yokthongwattana K, Techapinyawat S, Juntawong N. Screening for hydrogen-producing strains of green microalgae in phosphorus or sulphur deprived medium under nitrogen limitation. Scienceasia. 2015; 41:97–107.
- Zhang LT, He ML, Liu JG. The enhancement mechanism of hydrogen photoproduction in Chlorella protothecoides under nitrogen limitation and sulfur deprivation. Int J Hydrogen Energy. 2014; 39:8969–76.
- Zhang LT, He ML, Liu JG, Li L. Role of the mitochondrial alternative oxidase pathway in hydrogen photoproduction in Chlorella protothecoides. Planta. 2015; 241:1005–14.
- Hoober JK. The Chlamydomonas sourcebook. A comprehensive guide to biology and laboratory use. ed. by Harris, E.H., Academic Press, San Diego. 1989; 1503–4.
- Liu JG, Bukatin VE, Tsygankov AA. Light energy conversion into H2 by Anabaena variabilis mutant PK84 dense cultures exposed to nitrogen limitations. Int J Hydrogen Energy. 2006; 31:1591–6.
- White AJ, Critchley C. Rapid light curves: a new fluorescence method to assess the state of the photosynthetic apparatus. Photosynth Res. 1999; 59:63–72.
- Kosourov SN, Tsygankov AA, Seibert M, Ghirardi ML. Sustained hydrogen photoproduction by Chlamydomonas reinhardtii: effects of culture parameters. Biotechnol Bioeng. 2002; 78:731–40.
- Tsygankov AA, Kosourov SN, Tolstygina IV, Ghirardi ML, Seibert M. Hydrogen production by sulfur-deprived Chlamydomonas reinhardtii under photoautotrophic conditions. Int J Hydrogen Energy. 2006; 31:1574–84.
- Melis A. Photosynthetic H2 metabolism in Chlamydomonas reinhardtii (unicellular green algae). Planta. 2007; 226:1075–86.
- Maneeruttanarungroj C, Lindblad P, Incharoensakdi A. A newly isolated green alga, Tetraspora sp. CU2551, from Thailand with efficient hydrogen production. Int J Hydrogen Energy. 2010; 35:13193–9.
- Volgusheva A, Styring S, Mamedov F. Increased photosystem II stability promotes H2 production in sulfur-deprived Chlamydomonas reinhardtii. Proc Natl Acad Sci USA. 2013; 110:7223–8.
- Lu S, Wang J, Ma Q, Yang J, Li X, Yuan YJ. Phospholipid metabolism in an industry microalga Chlorella sorokiniana: The Impact of Inoculum Sizes. PLoS ONE. 2013; 8:e70827.
- Matsukawa R, Hotta M, Masuda Y, Chihara M, Karube I. Antioxidants from carbon dioxide fixing Chlorella sorokiniana. J Appl Phycol. 2000; 12:263–7.
- Sorokin C. Tabular comparative data for the low-temperature and high-temperature strains of Chlorella. Nature. 1959; 184:613–4.
- Chahal JK. Ability of Plectranthus spp. to re-green after nitrogen deficiency. Master Thesis, University of Nebraska- Lincoln, Lincoln. 2010; 1–13.
- Zhang L, Happe T, Melis A. Biochemical and morphological characterisation of sulphur deprived and H2-producing Chlamydomonas reinhardtii (green alga). Planta. 2002; 214:552–61.
- El-Sheekh M, Abomohra AE, Hanelt D. Optimization of biomass and fatty acid productivity of Scenedesmus obliquus as a promising microalga for biodiesel production. World J Microbiol Biotechnol. 2013; 29:915–22.
- Gordillo FJL, Jimenez C, Figueroa FL, Niel FX. Effect of increased atmospheric CO2 and N supply on photosynthesis, growth and cell composition of the cyanobacterium Spirulina platensis. J Appl Phycol. 1999; 10:461–9.
- Turpin DH. Effect of inorganic N availability on algal photosynthesis and carbon metabolism. J Phycol. 1991; 27:14–20.
- Piorreck M, Baasch KH, Pohl P. Biomass production, total protein, chlorophylls, lipids and fatty acids of fresh water green and blue-green algae under different nitrogen regimes. Phytochem. 1984; 23:207–16.
- Guo Z, Chen Z, Zhang W, Yu X, Jin M. Improved hydrogen photoproduction regulated by carbonylcyanide m-chlorophenylhrazone from marine green alga Platymonas subcordiformis grown in CO2-supplemented air bubble column bioreactor. Biotechnol Lett. 2008; 30:877–83.
- Marin-Navarro J, Esquivel MG, Moreno J. Hydrogen production by Chlamydomonas reinhardtii revisited: rubisco as a biotechnological target. World J Microbiol Biotechnol. 2010; 26:1785–93.
- Kosourov S, Seibert M, Ghirardi ML. Effects of extracellular pH on the metabolic pathways in sulfur- deprived, H2 producing Chlamydomonas reinhardtii cultures. Plant Cell Physiol. 2003; 44:146–55.
- Yang SH, Guarnieri MT, Smolinski S, Ghirardi M, Pienkos PT. De novo transcriptomic analysis of hydrogen production in the green alga Chlamydomonas moewusii through RNA-Seq. Biotechnol Biofuels. 2013; 6:1–17.
- Antal TK, Volgusheva AA, Kukarskih GP, Krendeleva TE, Rubin AB. Relationships between H2 photoproduction and different electron transport pathways in sulfur-deprived Chlamydomonas reinhardtii. Int J Hydrogen Energy. 2009; 34:9087–94.
© The Author(s) 2018. Open Access. This article is distributed under the terms of the Creative Commons Attribution 4.0 International License which permits unrestricted use, sharing, distribution, and reproduction in any medium, provided you give appropriate credit to the original author(s) and the source, provide a link to the Creative Commons license, and indicate if changes were made.