

ISSN: 0973-7510
E-ISSN: 2581-690X
Treatment of human excreta (HE) is necessary before its discharge into natural water body. Untreated discharge may cause several ill effects for environment and human health. Anaerobic digestion of human excreta can unravel this problem along with production of biogas. Anaerobic digestion process may be either batch type or continuous type. In present study, human excreta were degraded anaerobically by both the means in the laboratory scale 5L capacity glass digesters. The comparative assessment between batch digestion and continuous digestion was carried out. The digesters were fed with human excreta at 6% Total Solids and operated at ambient temperature of 20-37°C for 99 days. The results show that average biogas production in batch feeding process is 322.78 mLday-1 whereas in continues digestion it is 382 mLday-1. Total biogas production during 99 days in batch digestion and continue digestion is 31955.1 mL and 37833.9 mL respectively. Average methane content in biogas produced in continuous and batch digestion was 68.0% and 67.4% respectively. Results conclude that human excreta can be successfully digested anaerobically to produce biogas with good methane content either by batch or continuous digestion process.
Methane, human excreta, biogas, renewable energy.
The global population is expected to grow by about 35% by 2050 (UN, 2013), will increase challenges for treatment of various types of organic wastes generated by humans. Human excreta (HE) are one of them. Recycling and reuse of these wastes may be the only way to resolve this problem. Biomethanation of HE may be a useful way to recycle it. Biomethanation is a natural process operated in anaerobic conditions through the activities of microorganisms that utilize organic wastes and produce biogas and fertilizer. This paper seeks to comparative assessments of the biogas production from HE by two ways i.e. batch and continuous digestion process.
Experimental set-up
Total six experimental sets were used, three each for batch digestion and continuous digestion. One experimental set contains three glass bottles, one (5.0L capacity) digester bottle, one (2.0L capacity) gas holder and another one (2.0L capacity) water replacement bottle. 5.0L digester bottle had an outlet at 4800mL. Feeding assembly was provided for daily feeding which maintain the feeding level at 4800mL. Produced gas was allowed to escape from the top of digester to enter in a 2.0L graduated gas holder bottle which coupled with water displacement bottle, containing acidified colored water. The acidified colored water contains 10% NaCl and K2Cr2O7 (0.1g%) and this solution was acidified with H2SO4 (pH 2 – 4).
Gas production measurement
A scale was pasted at outer surface of gas holder bottle to measure the gas production accurately. In the gas holder bottle the level of acidified colored water was set daily at zero on pasted scale. Gas holder bottle remains connected with digester at one end and with water displacement bottle at another end. When the gas was produced in digester enter into gas holder bottle it pressurized the water level in it being set at zero. Corresponding to the pressure of produced gas the water level in gas holder bottle goes down and simultaneously the water level in water displacement bottles rises. The difference in final and initial level of water in gas holder bottle gives the amount of produced biogas.
Feeding and Inoculum
In batch digesters the HE slurry was fed to its working volume of 4800 mL maintaining the total solids contents at 6%. In continuous digester 120 mL of human excreta (at 6% Total Solids) was added per day upto 40 days to fill it at its working volume of 4800mL. To start the biomethanation process anaerobically digested slurry from running Biogas plant of our institution was added in all the digesters @10% (v/v) as an inoculum.
Analysis of methane in biogas
The methane content in produced biogas was measured frequently by orsat apparatus.
Data presented in Table 1 show that the biogas production in batch digester starts from 2nd day but its amount was quite low as 26.2mL only which suddenly jumped to 235.8 mL on 4th day and thereafter it remained between 235.8 and 262.0mL from 4th to 6th day. From 7th to 10th day biogas production further increased and remained between 432.3 and 524.0mL. From 11th to 24th day biogas production varies between a minimum value of 602.6 mL and a maximum value of 681.2mL except 12th day (550.0mL) and 16th day (563.3mL). This is the period in batch digester when highest biogas production was obtained. From 25th day onwards biogas production decreases continuously. It ranged between 510.9 to 576.4mL between 25th and 31st day, except 29th day (495.0mL); 406.1 and 497.8mL between 32nd and 50th day, except 36th day (537.1mL), 37th day (510.90mL) and 40th day (524.0mL); 327.5 and 366.8mL between 51th and 67th day, except 53th day (419.2mL); and 235.8 and 288.2mL between 68th and 80th day, except 78th day (91.7mL). Data show that after 80th day biogas production in batch digester remains below 100 mL and decreases continuously till 99 days and reaches to a minimum value of 13.1mL. Data of biogas production in batch digester show that there is continuous increase in biogas production till a peak is reached and then it decreases continuously, due to reduction of nutrients in digester may produce starvation condition therefor methenogesis process undergoes decrease. Similar trend was observed previously2.
Table (1):
Daily production of biogas in continuous and batch digester throughout the experimentation period.
| Age of Digester (Day) |
Biogas production (mL per day) |
|
|---|---|---|
| Continuous Digester | Batch Digester | |
| 1 | 406.1 ± 7.5 | 0 ± 0.0 |
| 2 | 406.1 ± 4.4 | 26.2 ± 0.3 |
| 3 | 419.2 ± 7.6 | 26.2 ± 0.5 |
| 4 | 393.0 ± 4.6 | 235.8 ± 2.8 |
| 5 | 419.2 ±7.3 | 262.0 ± 4.6 |
| 6 | 432.3 ±6.3 | 262.0 ± 3.8 |
| 7 | 419.2 ± 6.5 | 510.9 ± 7.9 |
| 8 | 406.1± 3.4 | 458.5 ± 3.8 |
| 9 | 419.2 ± 9.0 | 432.3 ± 9.2 |
| 10 | 406.1 ± 7.9 | 524.0 ± 10.3 |
| 11 | 393.0 ± 8.1 | 628.8 ± 13.0 |
| 12 | 327.5 ± 2.0 | 550.2 ± 3.3 |
| 13 | 340.6 ± 1.6 | 641.9 ± 2.9 |
| 14 | 301.3 ± 8.3 | 602.6 ± 16.6 |
| 15 | 248.9 ± 2.7 | 602.6 ± 6.5 |
| 16 | 340.6 ± 9.0 | 563.3 ± 14.8 |
| 17 | 379.9 ± 9.2 | 602.6 ± 14.7 |
| 18 | 366.8 ± 9.8 | 615.7 ± 16.4 |
| 19 | 393.0 ± 9.9 | 641.9 ± 16.1 |
| 20 | 366.8 ± 7.2 | 628.8 ± 12.4 |
| 21 | 406.1 ± 7.5 | 681.2 ± 12.5 |
| 22 | 366.8 ± 9.4 | 602.6 ± 15.4 |
| 23 | 406.1 ± 7.2 | 655.0 ± 11.6 |
| 24 | 379.9 ± 9.6 | 602.6 ± 15.3 |
| 25 | 379.9 ± 8.5 | 576.4 ± 12.9 |
| 26 | 379.9 ± 7.4 | 576.4 ± 11.2 |
| 27 | 340.6 ± 6.3 | 524.0 ± 9.7 |
| 28 | 340.6 ± 5.0 | 510.9 ± 7.5 |
| 29 | 345.6 ± 9.0 | 495.0 ± 12.9 |
| 30 | 406.1 ± 6.7 | 576.4 ± 9.5 |
| 31 | 366.8 ± 9.0 | 524.0 ± 12.9 |
| 32 | 327.5 ± 5.8 | 445.4 ± 7.8 |
| 33 | 340.6 ± 10.0 | 471.6 ± 13.8 |
| 34 | 353.7 ± 9.2 | 484.7 ± 12.6 |
| 35 | 353.7 ± 5.2 | 497.8 ± 7.4 |
| 36 | 379.9 ± 3.8 | 537.1 ± 5.3 |
| 37 | 379.9 ± 6.3 | 510.9 ± 8.4 |
| 38 | 366.8 ± 7.9 | 497.8 ± 10.8 |
| 39 | 379.9 ± 8.0 | 497.8 ± 10.4 |
| 40 | 393.0 ± 8.6 | 524.0 ± 11.5 |
| 41 | 366.8 ± 5.4 | 497.8 ± 7.4 |
| 42 | 366.8 ± 7.6 | 497.8 ± 10.3 |
| 43 | 393.0 ± 8.1 | 497.8 ± 10.3 |
| 44 | 366.8 ± 7.6 | 471.6 ± 9.8 |
| 45 | 379.9 ± 7.0 | 445.4 ± 8.2 |
| 46 | 366.8 ± 9.4 | 471.6 ± 12.1 |
| 47 | 353.7 ± 9.5 | 419.2 ± 11.3 |
| 48 | 366.8 ± 7.5 | 419.2 ± 8.5 |
| 49 | 379.9 ± 9.6 | 406.1 ± 10.3 |
| 50 | 353.7 ± 6.1 | 419.2 ± 7.2 |
| 51 | 314.4 ± 4.2 | 366.8 ± 4.9 |
| 52 | 301.3 ± 5.0 | 353.7 ± 5.9 |
| 53 | 353.7 ± 5.1 | 419.2 ± 6.0 |
| 54 | 327.5 ± 8.4 | 400.0 ± 10.3 |
| 55 | 353.7 ± 7.3 | 366.8 ± 7.5 |
| 56 | 314.4 ± 9.4 | 327.5 ± 9.8 |
| 57 | 301.3 ± 9.2 | 275.1 ± 8.4 |
| 58 | 280.3 ± 6.2 | 248.9 ± 5.5 |
| 59 | 314.4 ± 8.2 | 288.2 ± 7.5 |
| 60 | 340.6 ± 10.0 | 301.3 ± 8.8 |
| 61 | 314.4 ± 8.8 | 248.9 ± 7.0 |
| 62 | 366.8 ± 3.7 | 275.1 ± 2.8 |
| 63 | 406.1 ± 6.7 | 262.0 ± 4.3 |
| 64 | 406.1 ± 7.0 | 262.0 ± 4.5 |
| 65 | 406.1 ± 3.2 | 248.9 ± 1.9 |
| 66 | 410.1 ± 5.6 | 235.8 ± 3.2 |
| 67 | 379.9 ± 9.6 | 248.9 ± 6.3 |
| 68 | 379.9 ± 3.5 | 196.5 ± 1.8 |
| 69 | 379.9 ± 8.1 | 196.5 ± 4.2 |
| 70 | 393.0 ± 8.1 | 196.5 ± 4.1 |
| 71 | 419.2 ± 3.5 | 196.5 ± 1.7 |
| 72 | 379.9 ± 9.7 | 183.4 ± 4.7 |
| 73 | 393.0 ± 5.2 | 144.1 ± 1.9 |
| 74 | 379.9 ± 8.3 | 144.1 ± 3.2 |
| 75 | 406.1 ± 7.2 | 157.2 ± 2.8 |
| 76 | 406.1 ± 3.5 | 157.2 ± 1.4 |
| 77 | 393.0 ± 7.1 | 104.8 ± 1.9 |
| 78 | 340.6 ± 9.3 | 91.7 ± 2.5 |
| 79 | 379.9 ± 9.6 | 104.8 ± 2.7 |
| 80 | 379.9 ± 6.8 | 104.8 ± 1.9 |
| 81 | 366.8 ± 9.8 | 78.6 ± 2.1 |
| 82 | 379.9 ± 4.3 | 78.6 ± 0.9 |
| 83 | 419.2 ± 6.7 | 78.6 ± 1.3 |
| 84 | 406.1 ± 8.4 | 65.5 ± 1.4 |
| 85 | 393.0 ± 5.4 | 52.4 ± 0.7 |
| 86 | 419.2 ± 7.6 | 52.4 ± 0.9 |
| 87 | 419.2 ± 3.3 | 52.4 ± 0.4 |
| 88 | 445.4 ± 9.6 | 39.3 ± 0.9 |
| 89 | 471.6 ± 7.4 | 26.2 ± 0.4 |
| 90 | 471.6 ± 9.6 | 26.2 ± 0.5 |
| 91 | 471.6 ± 3.2 | 26.2 ± 0.2 |
| 92 | 432.3 ± 6.6 | 26.2 ± 0.4 |
| 93 | 419.2 ± 3.5 | 13.1 ± 0.1 |
| 94 | 432.3 ± 7.6 | 13.1 ± 0.2 |
| 95 | 471.6 ± 7.4 | 13.1 ± 0.2 |
| 96 | 432.3 ± 3.2 | 13.1 ± 0.1 |
| 97 | 458.5 ± 6.4 | 13.1 ± 0.2 |
| 98 | 458.5 ± 3.2 | 13.1 ± 0.1 |
| 99 | 471.6 ± 7.7 | 13.1 ± 0.2 |
| Total Biogas production | 37833.94 ± 510.5 | 31955.10± 486.5 |
| Average Biogas production per day | 382.16± 6.9 | 322.78± 6.3 |
This trend did not observe for biogas production in continuous digester. Here, biogas production ranged between 406.1 and 432.3mL from 1st to 10th day, except on 4th day (393.0mL). It should be noted here that 1st day of continuous digester refers to the day after it is being filled at 4800mL (actual 41st day of experimentation and so on). Thereafter between 11th to 62th day biogas production decreases and ranged between 301.3 and 393.0mL, except on 15th day (248.9mL), 21st, 23rd and 30th day (406.1mL) and 58th day (280.34mL). From 63 to 66th day, biogas production further increased and ranged between 406.1 and 410.1mL. From 67th day biogas production further decreases and ranged between 340.6 and 393.0mL between 67th and 82nd day except 71th day (419.2mL) and 75 and 76th day (406.10mL). From 83rd day onwards biogas production again increases and ranged between 406.1 and 471.6mL between 83rd and 99th day, except 85th day (393.0mL). With respect to batch digestion continuous digestion system getting nutrients on daily basis therefor methanogenesis process didn’t disturbed and biogas production remain near to constant rate. Similar trend was observed previously in a continues anaerobic digestion study3.
Total biogas production during the experimentation period of 99 days was recorded as 37833.94mL in continuous digester with average of 382.16mL per day and as 31955.1mL in batch digester with and an average of 322.78mL per day.
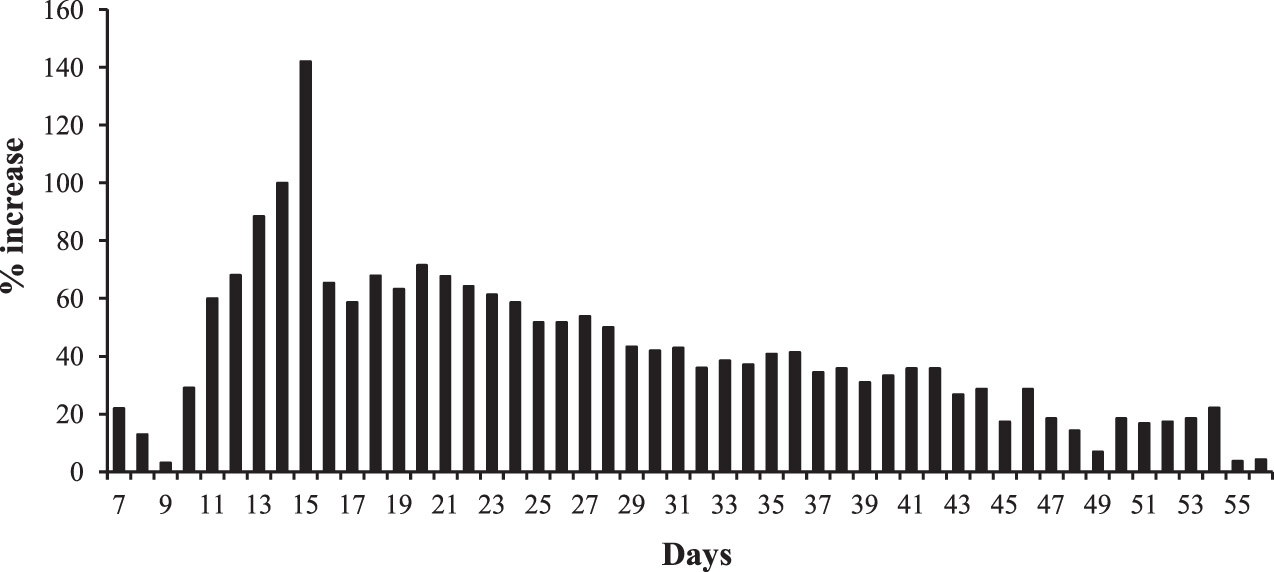
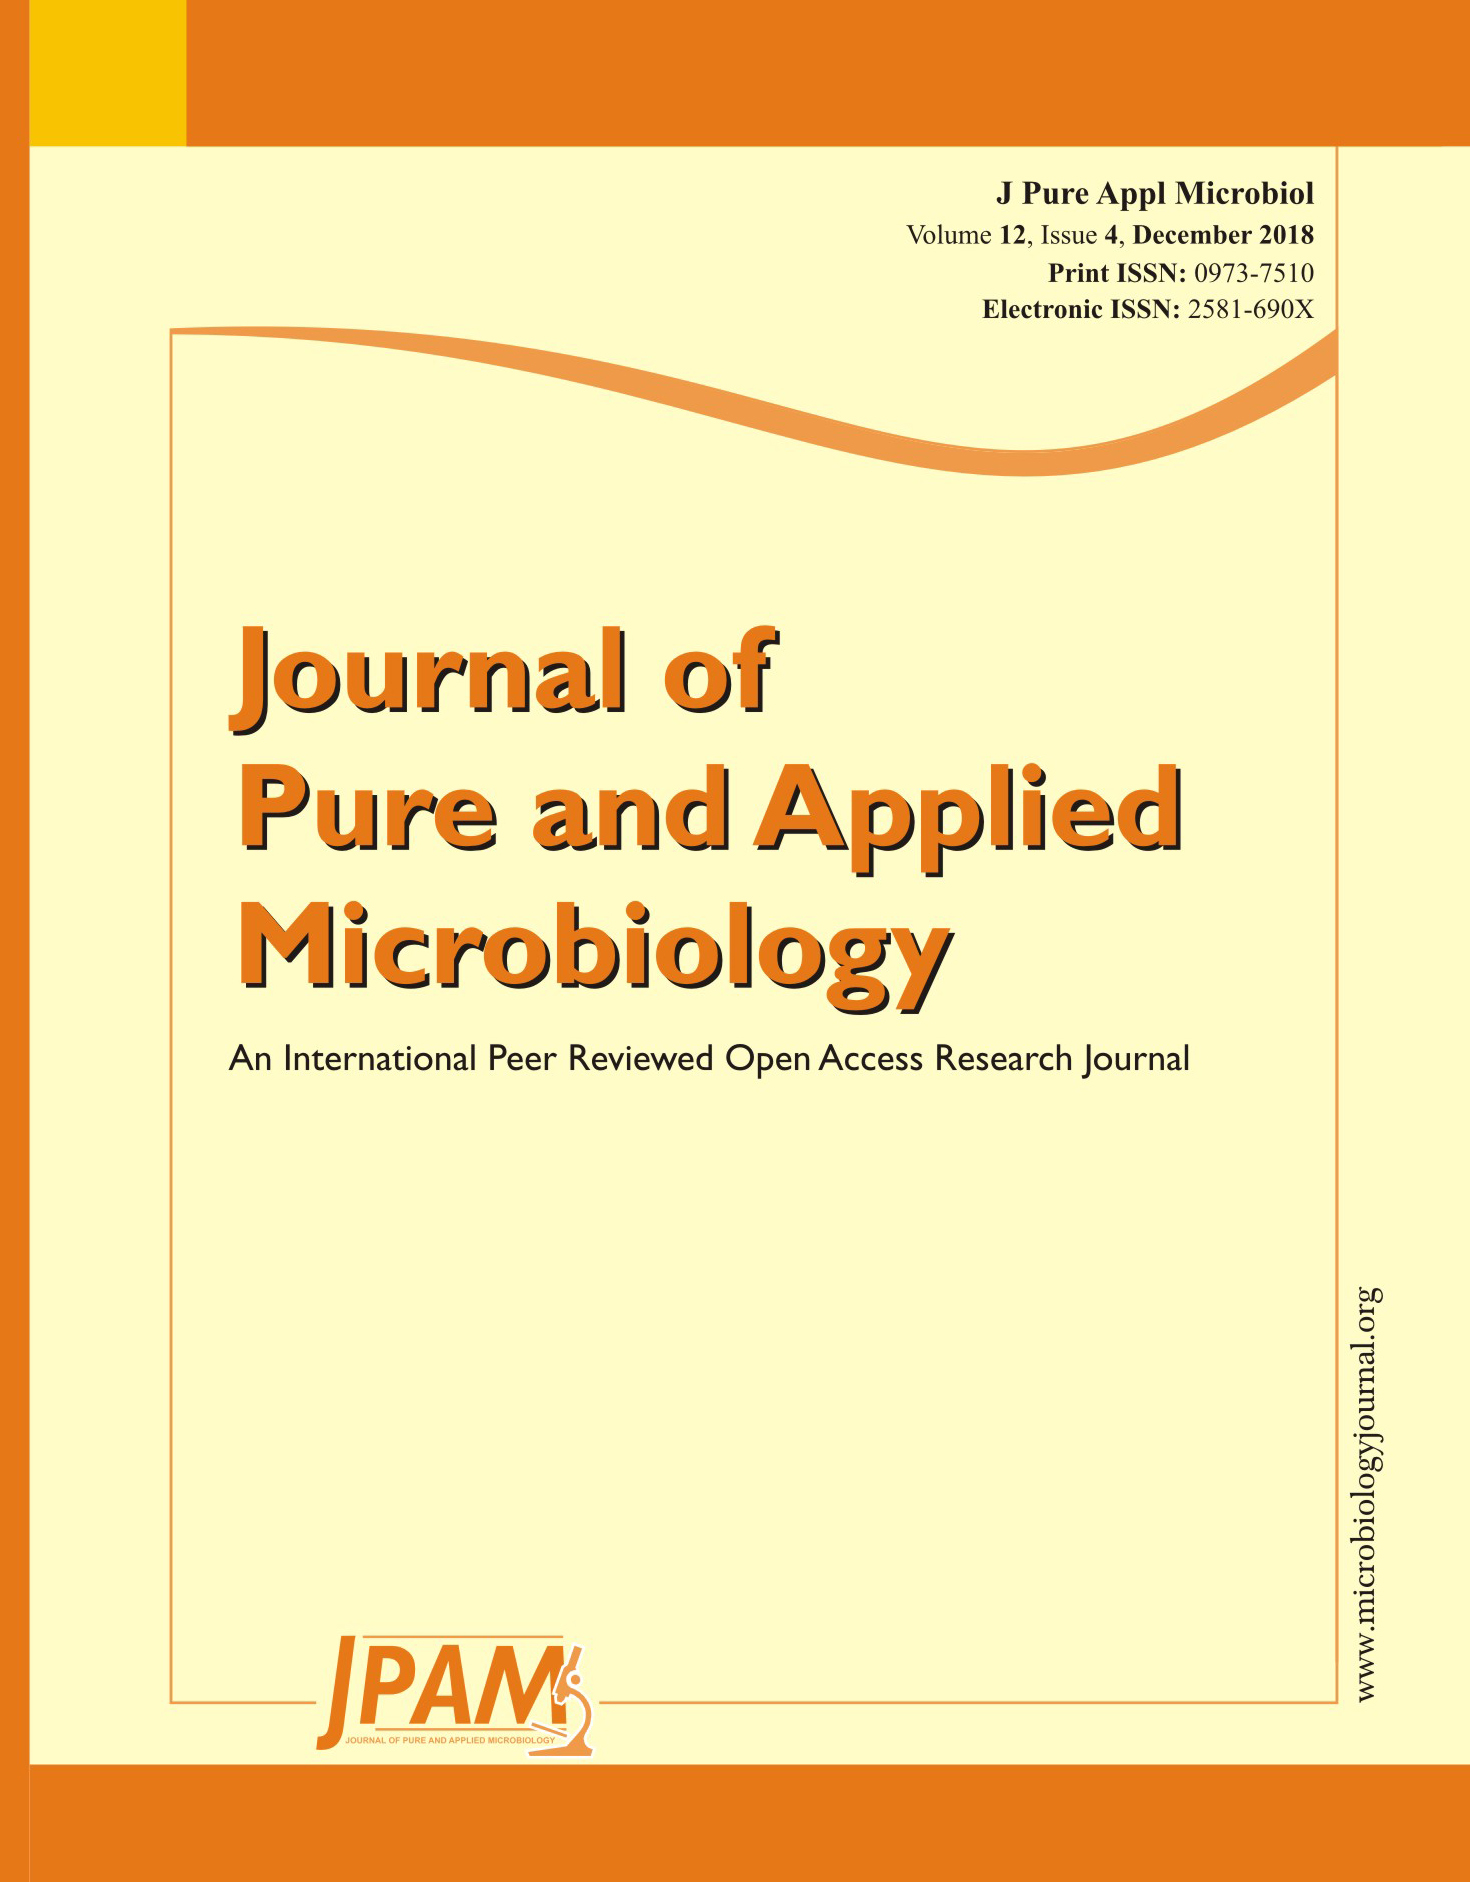
Fig. 1. Percentage increase in Biogas production in Batch Digester over Continuous Digester.
A close observation of Data presented in Table-1 reveals that the biogas production was higher in batch digester compared to continuous digester from Day 7th to 56th (Fig.1). Whereas, from 57th day to 99th day reverse trend was observed and biogas production shows its higher value in continuous digester compared to batch one (Fig. 2). Effectiveness of batch digestion process over continues digestion process in earlier stage of digestion was reported3 using Mathematical Models for Comparative Evaluation of Batch and Continuous Anaerobic Digesters.
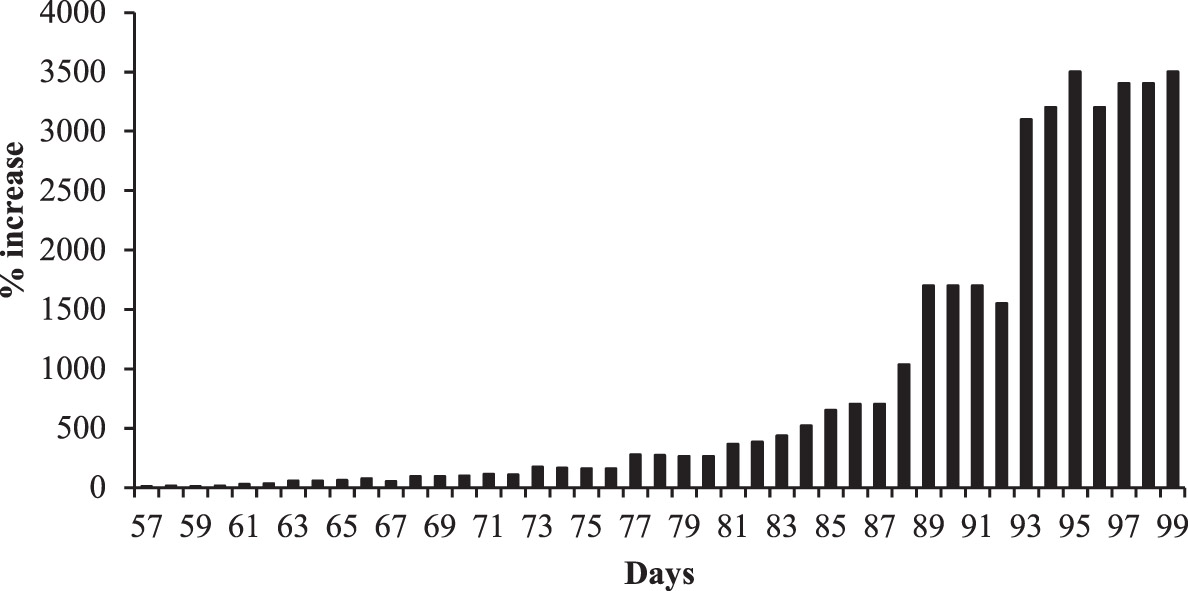
Fig. 2. Percentage increase in Biogas production in Batch Digester over Continuous Digester
Biogas production and Temperature
Data presented in Fig. 3 reveals that biogas production in batch digester has no relation with increase or decrease in average temperature value. Results conclude that the biogas production is affected by some other factors than temperature.
Fig. 3. Effect of average temperature on Biogas production in batch digester
On the other hand, production of biogas in continuous digester follows the path of rise and fall in average temperature (Fig. 4).
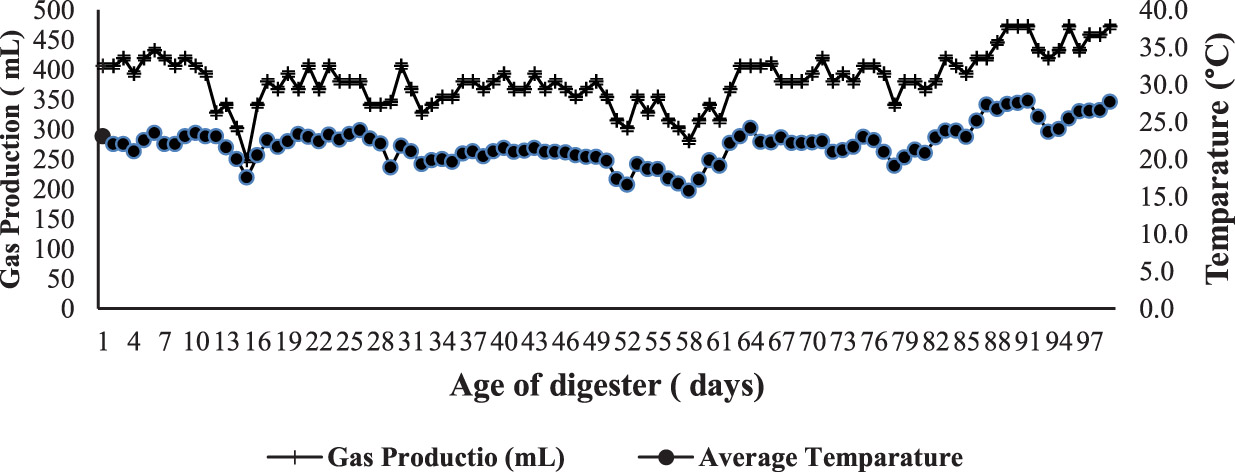
Fig. 4. Effect of average temperature on Biogas production in continuous digester
Comparison of produced biogas in continuous and batch digestion clearly reveals that in continuous digester a steady amount of biogas is generated (minimum 248.9mL and maximum 471.6mL) whereas in batch digester production of biogas varies greatly (minimum 26.2 and maximum 681.20mL) and gives Bell shape curve (Fig. 5). In batch digester a sharp increase in biogas production is recorded from 6th to 7th day and between 9th and 11th day and thereafter from 80th day the biogas production continuously decreased. High temperature favours the biogas production4and it decreases at low temperature.
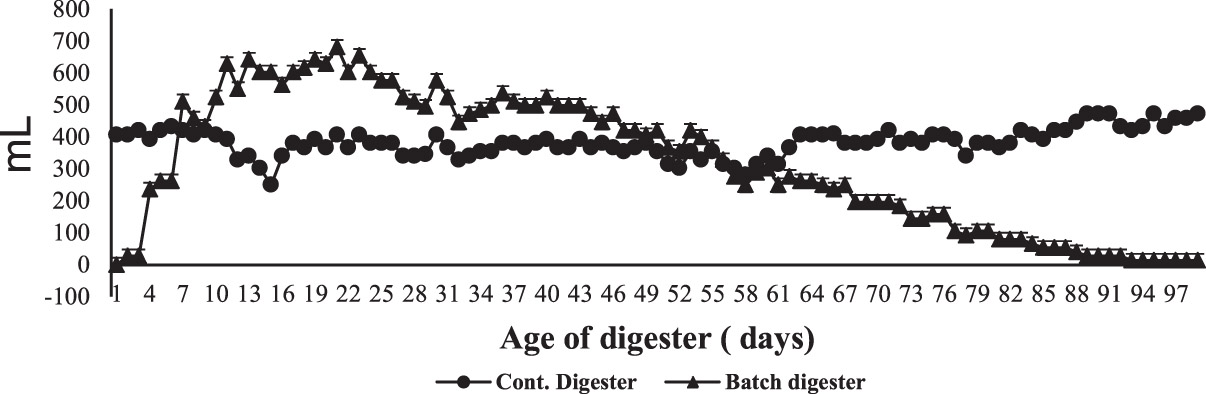
Fig. 5. Comparative biogas production in Continuous and Batch digester
Table (2):
Methane content in biogas produced in continuous and batch digestion process (%).
|
Continuous Digester |
Batch Digester |
|||
|---|---|---|---|---|
| Age of Digester (Day) | Methane | Age of Digester (Day) | Methane | |
| 55 | 60.2± 0.6 | 15 | 40.3± 0.4 | |
| 70 | 66.0± 1.2 | 30 | 58.8± 1.1 | |
| 85 | 70.2± 0.8 | 45 | 68.3± 0.8 | |
| 100 | 70.8± 1.2 | 60 | 78.1± 1.4 | |
| 115 | 70.1± 1.0 | 75 | 78.2± 1.1 | |
| 130 | 70.5± 1.1 | 90 | 80.5± 1.2 | |
| Average Methane | 68.0± 1.0 | Average Methane | 67.4± 1.2 | |
Amount of produced biogas is not much important as its methane content because it is the utilizable part of biogas. Data presented in Table-2 reveals that produced biogas in continuous and batch digestion process contains more or less similar amount of methane in it. So in this aspect there is no difference between these two processes. Initially lower methane content in batch digestion than continues digestion and then with time it goes more or less similar in both were also reported5.
Results of the study conclude that Human Excreta alone can be digested anaerobically to produce more than 300mL biogas per day with more than 67% methane content either batch or continuous digestion process, continuous digestion process is more favorable for continuous and constant biogas production.
Acknowledgements
The authors are grateful to the Gujarat State Biotechnology Mission (GSBTM FAP 2015-16, Project ID-1469), Gandhinagar, Gujarat for financial support for this study.
Conflict Of Interest
The authors declare that there is no conflict of interest.
- United Nations, World Population Ageing 2013. Department of Economic and Social Affairs Population Division, New York.
- Dahunsi, S. O, and Oranusi, U. S. Co-digestion of Food Waste and Human Excreta for Biogas Production. British Biotechnology Journal, 2013; 3(4): 485–499.
- Mahanta, P, Saha, U. K, Dewan, A, Kalita, P, and Buragohain, B. Biogas Digester: A Discussion on Factors Affecting Biogas Production and Field Investigation of a Novel Duplex Digester. Journal of the Solar Energy Society of India, 2005; 15(2): 1–12.
- Pandey, P. K and Soupir, M. L. Impacts of Temperatures on Biogas Production in Dairy Manure Anaerobic Digestion Impacts of Temperatures on Biogas Production in Dairy Manure. International Journal of Engineering and Technology,2012; 4, 629–631.
- Obiukwu, O. O, and Nwafor, M. Comparative evaluation of batch and continuous process biogas production from animal wastes. International Journal of Ambient Energy, 2017; 37 (1), 29–35.
© The Author(s) 2018. Open Access. This article is distributed under the terms of the Creative Commons Attribution 4.0 International License which permits unrestricted use, sharing, distribution, and reproduction in any medium, provided you give appropriate credit to the original author(s) and the source, provide a link to the Creative Commons license, and indicate if changes were made.