

ISSN: 0973-7510
E-ISSN: 2581-690X
Namibia is a large country with a population slightly above 2 million of which 73% live in rural areas. It is the driest country in sub-Saharan Africa with unpredictable rainfall patterns which occur between October and May. The Cuvelai Etosha Basin is a rural setting in which most people depend on groundwater to circumvent water scarcity by the construction of hand-dug wells. Communities consume hand-dug well water throughout the year without; knowledge of its safety, and treatment prior to use. Hence, this study aimed at evaluating the seasonal safety and quality of hand-dug well water for human consumption. A 16S rRNA metagenomics study was conducted to explore the influence of season on the human pathogenic bacterial species richness, diversity, evenness and abundance in the hand-dug wells. Bacterial pathogens were identified and analysis revealed no significant difference in species richness and diversity, and a significant difference in species evenness and abundance between the wet and dry seasons. Hence, seasonality had an influence on human bacterial pathogens evenness and abundance but had no influence on species richness and diversity. In addition, the water in hand-dug wells of the Cuvelai Etosha Basin is not safe for consumption and domestic use unless sanitized. It is recommended that efforts should be made to treat the water prior to use, and hand-dug wells should be properly constructed to reduce contamination.
Cuvelai Etosha Basin, Diversity, Evenness, Hand-dug well, Human bacterial pathogens, Metagenomics, Richness, Water.
Namibia is a large country found in southern Africa with a size of 823, 680 km2.1 The country has a population slightly above 2 million of which 73% live in rural areas and the rest in urban settings. Namibia is one of the driest countries in southern Africa with unpredictable rainfall patterns which uniquely occur between October and May2. Due to high temperatures, Namibia experiences high evaporation rates, leaving a small quantity (2%) that can be used as surface water.2 Amakali and Swatuk3 disclosed that about 83% of the rainfall vaporizes almost immediately while 14% is lost by evapo-transpiration due to high temperatures, and groundwater is recharged by only 1%. Mendelson et al.1 revealed that Namibia has been characterized by an arid climate for millions of years leading to water scarcity in most parts of the country. In addition, rivers in Namibia are dry most of the time and only flow after heavy rains. However, the Namibian transboundary rivers namely Kunene, Zambezi, Kavango and Orange are perennial although far from main centres of demand. This demands that communities rely on groundwater as a viable source for domestic water.
The Cuvelai Etosha Basin (CEB) is a densely populated area located in central northern Namibia, and consists of four regions namely Oshana, Oshikoto, Ohangwena and Omusati4. This Basin harbours about half of the Namibian population amounting to 1 million4. Given the water scarcity problem in the country, this Basin is not excused from the hardships of inadequate water supply. Thus, the CEB rural communities mostly depend on the use of groundwater to circumvent water scarcity by the construction of hand-dug wells. However, ground-water presents another problem in that it is saline in most parts of the basin and the situation is worsened by lack of perennial rivers within the regions5,6. The CEB has three distinct hand-dug well forms (Fig.; 1, 2 and 3) that differ according to structure. These structural differences determine whether or not animals have access. There is only one report by McBenedict et al.7 that described these hand-dug wells not to be safe for human consumption. However, McBenedict et al.7 used culture dependent methods which cannot reveal the total bacterial species in these hand-dug wells as opposed to the Metagenomics technique used in this study as a follow up.
Hence, the use of metagenomics approaches circumvents the limitation of culturing media which does not appropriately represent in situ conditions since only a certain fraction (<1%) of bacteria can be cultured leading to a poor understanding of the bacterial communities. Metagenomics is a technique that employs the sequencing and analysis of the entire microbial community genomes to define and understand the genetic content of the environment in question. Metagenomics is also termed environmental genomics owing to its ability to capture and analyse the total DNA of an environment8. Metagenomics is a sequence-based and functional analysis of the entire microbial genomes from a microbial habitat and can reveal an inclusive measure of genetic diversity, species composition, evolution, and ecological functions of respective species in microbial communities9.
It is sufficing to state that the WHO documented list of water borne pathogens is not comprehensive due to lack of widespread research on water pathogens using highly specific and effective techniques such as metagenomics. Hence, there is need to conduct more microbial research in water in order to reveal the vast microbial life forms and their interactions. This study comprehensively disclosed the human pathogenic bacteria inhabiting the hand-dug wells in the CEB and adds on to the known pathogens for which water is a mode of transmission, and is the first to report the use of metagenomics in assessing the microbial quality of water in Namibia. Therefore, the main aim of this study was to investigate the influence of season on human pathogenic bacterial species richness, diversity and distribution in hand-dug wells of the CEB of Namibia.
Study sites and sample collections
The study targeted the three different structural types of hand-dug wells (Fig. 1 – 3). Although the CEB in Namibia is formed by Oshikoto, Omusati, Ohangwena and Oshana regions, water samples were collected from Omusati and Ohangwena regions since they possess the three different hand-dug well types. Convenience sampling was employed in this study although it targeted the areas in which hand-dug wells were monitored for chemical water quality by Southern African Science Service Centre for Climate Change and Adaptive Land Management (SASSCAL) task 007: Improving knowledge and understanding of groundwater flow, water quality and quantity variations, improve methodology of groundwater availability study in the Cuvelai since 2014. Water samples were collected following standard water sample collection guidelines stipulated by WHO, University of Namibia and the University of Zambia. A total of 40 water samples were collected in sterile 200 ml bottles from the hand-dug wells, half the total number being from the wet and 20 from the dry season respectively. Water samples were collected from the same hand-dug wells in both seasons. The bottles were lowered into the hand-dug wells for water collection using a rope which was tied to the sterile bottles. The samples were then transported on ice to the University of Namibia for analysis. Prior to transportation, the physical parameters; temperature, electrical conductivity, redox potential and potential of hydrogen (pH) of the water were measured.
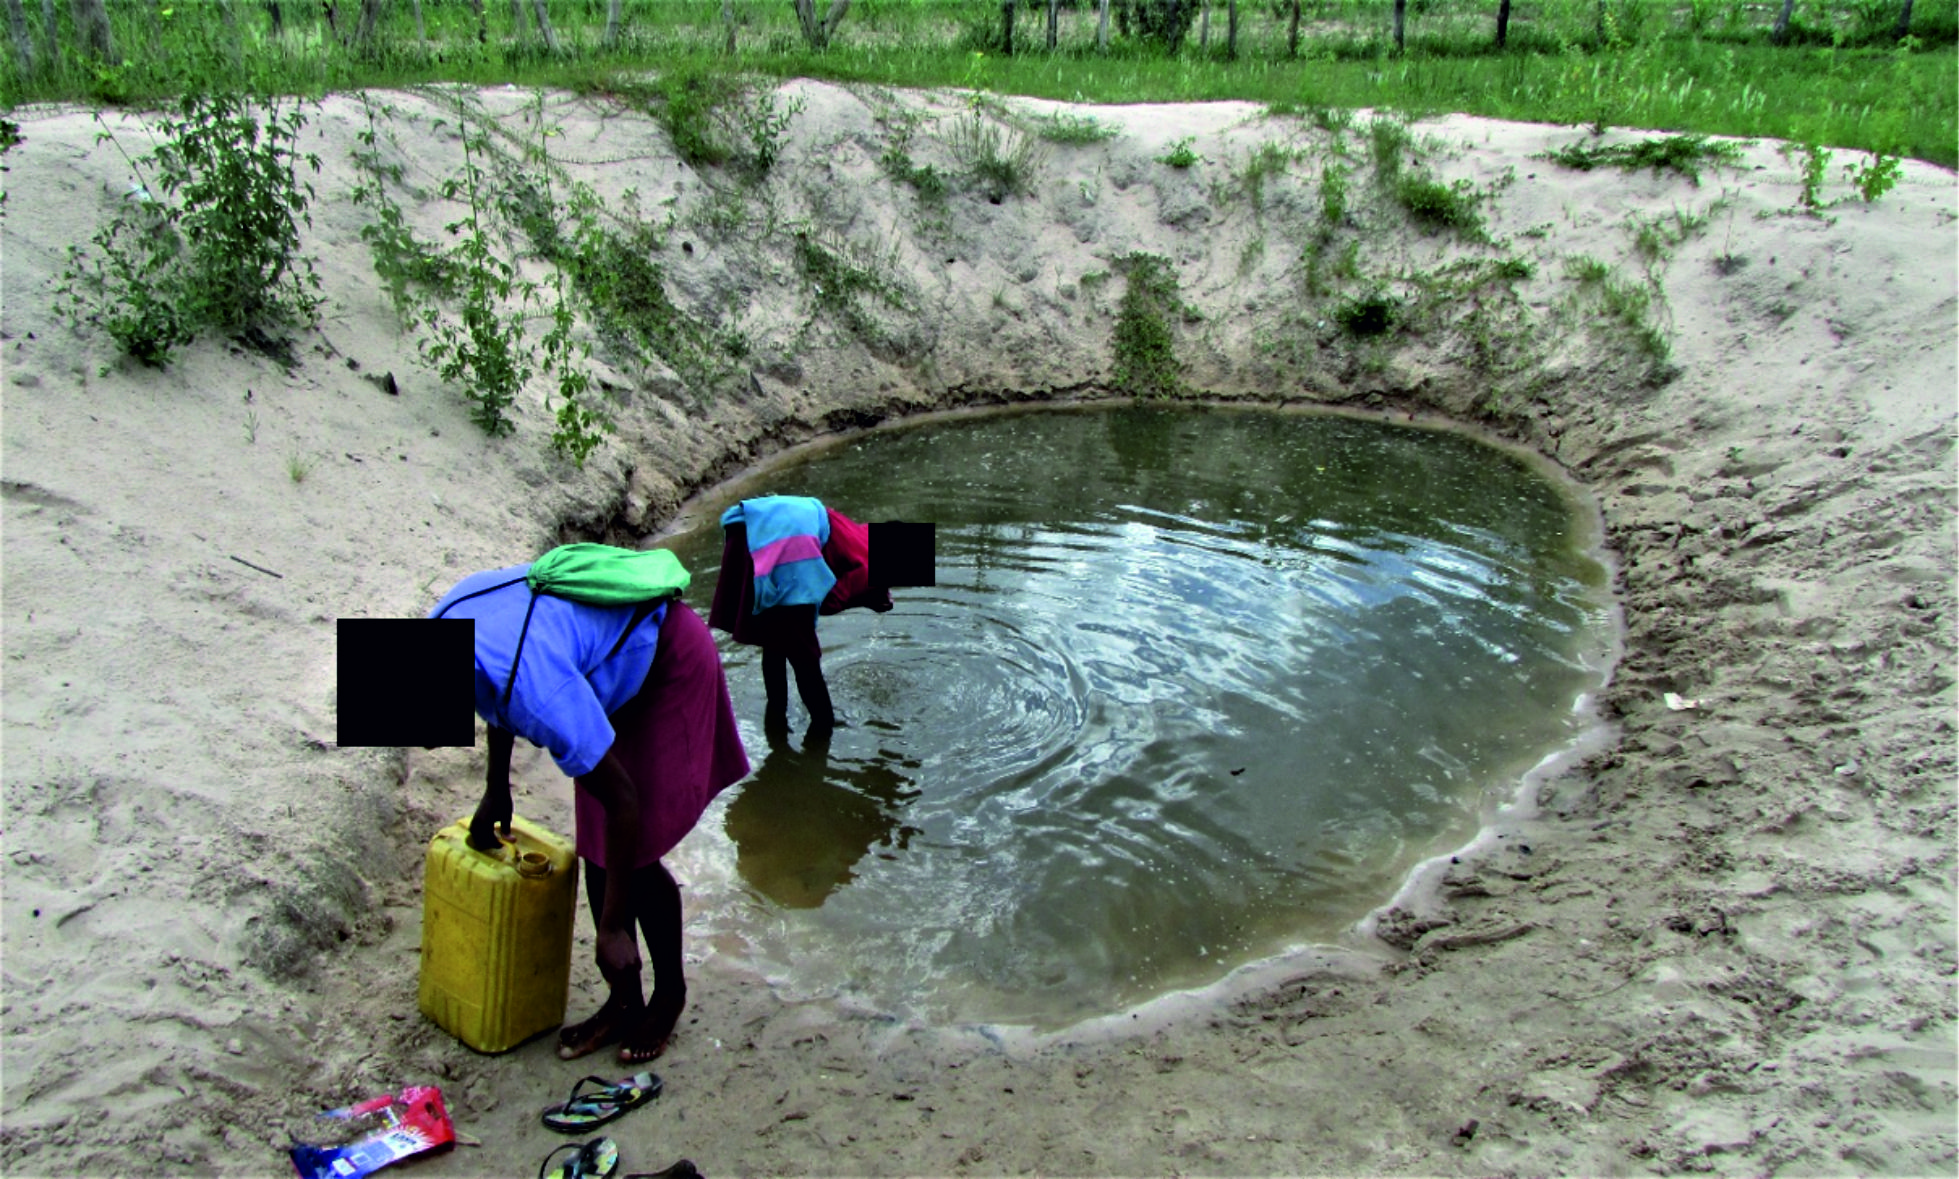
Fig. 1. A picture of type 1 shallow hand-dug wells found in the Ohangwena and Omusati regions of the CEB in which animals can walk into the water.
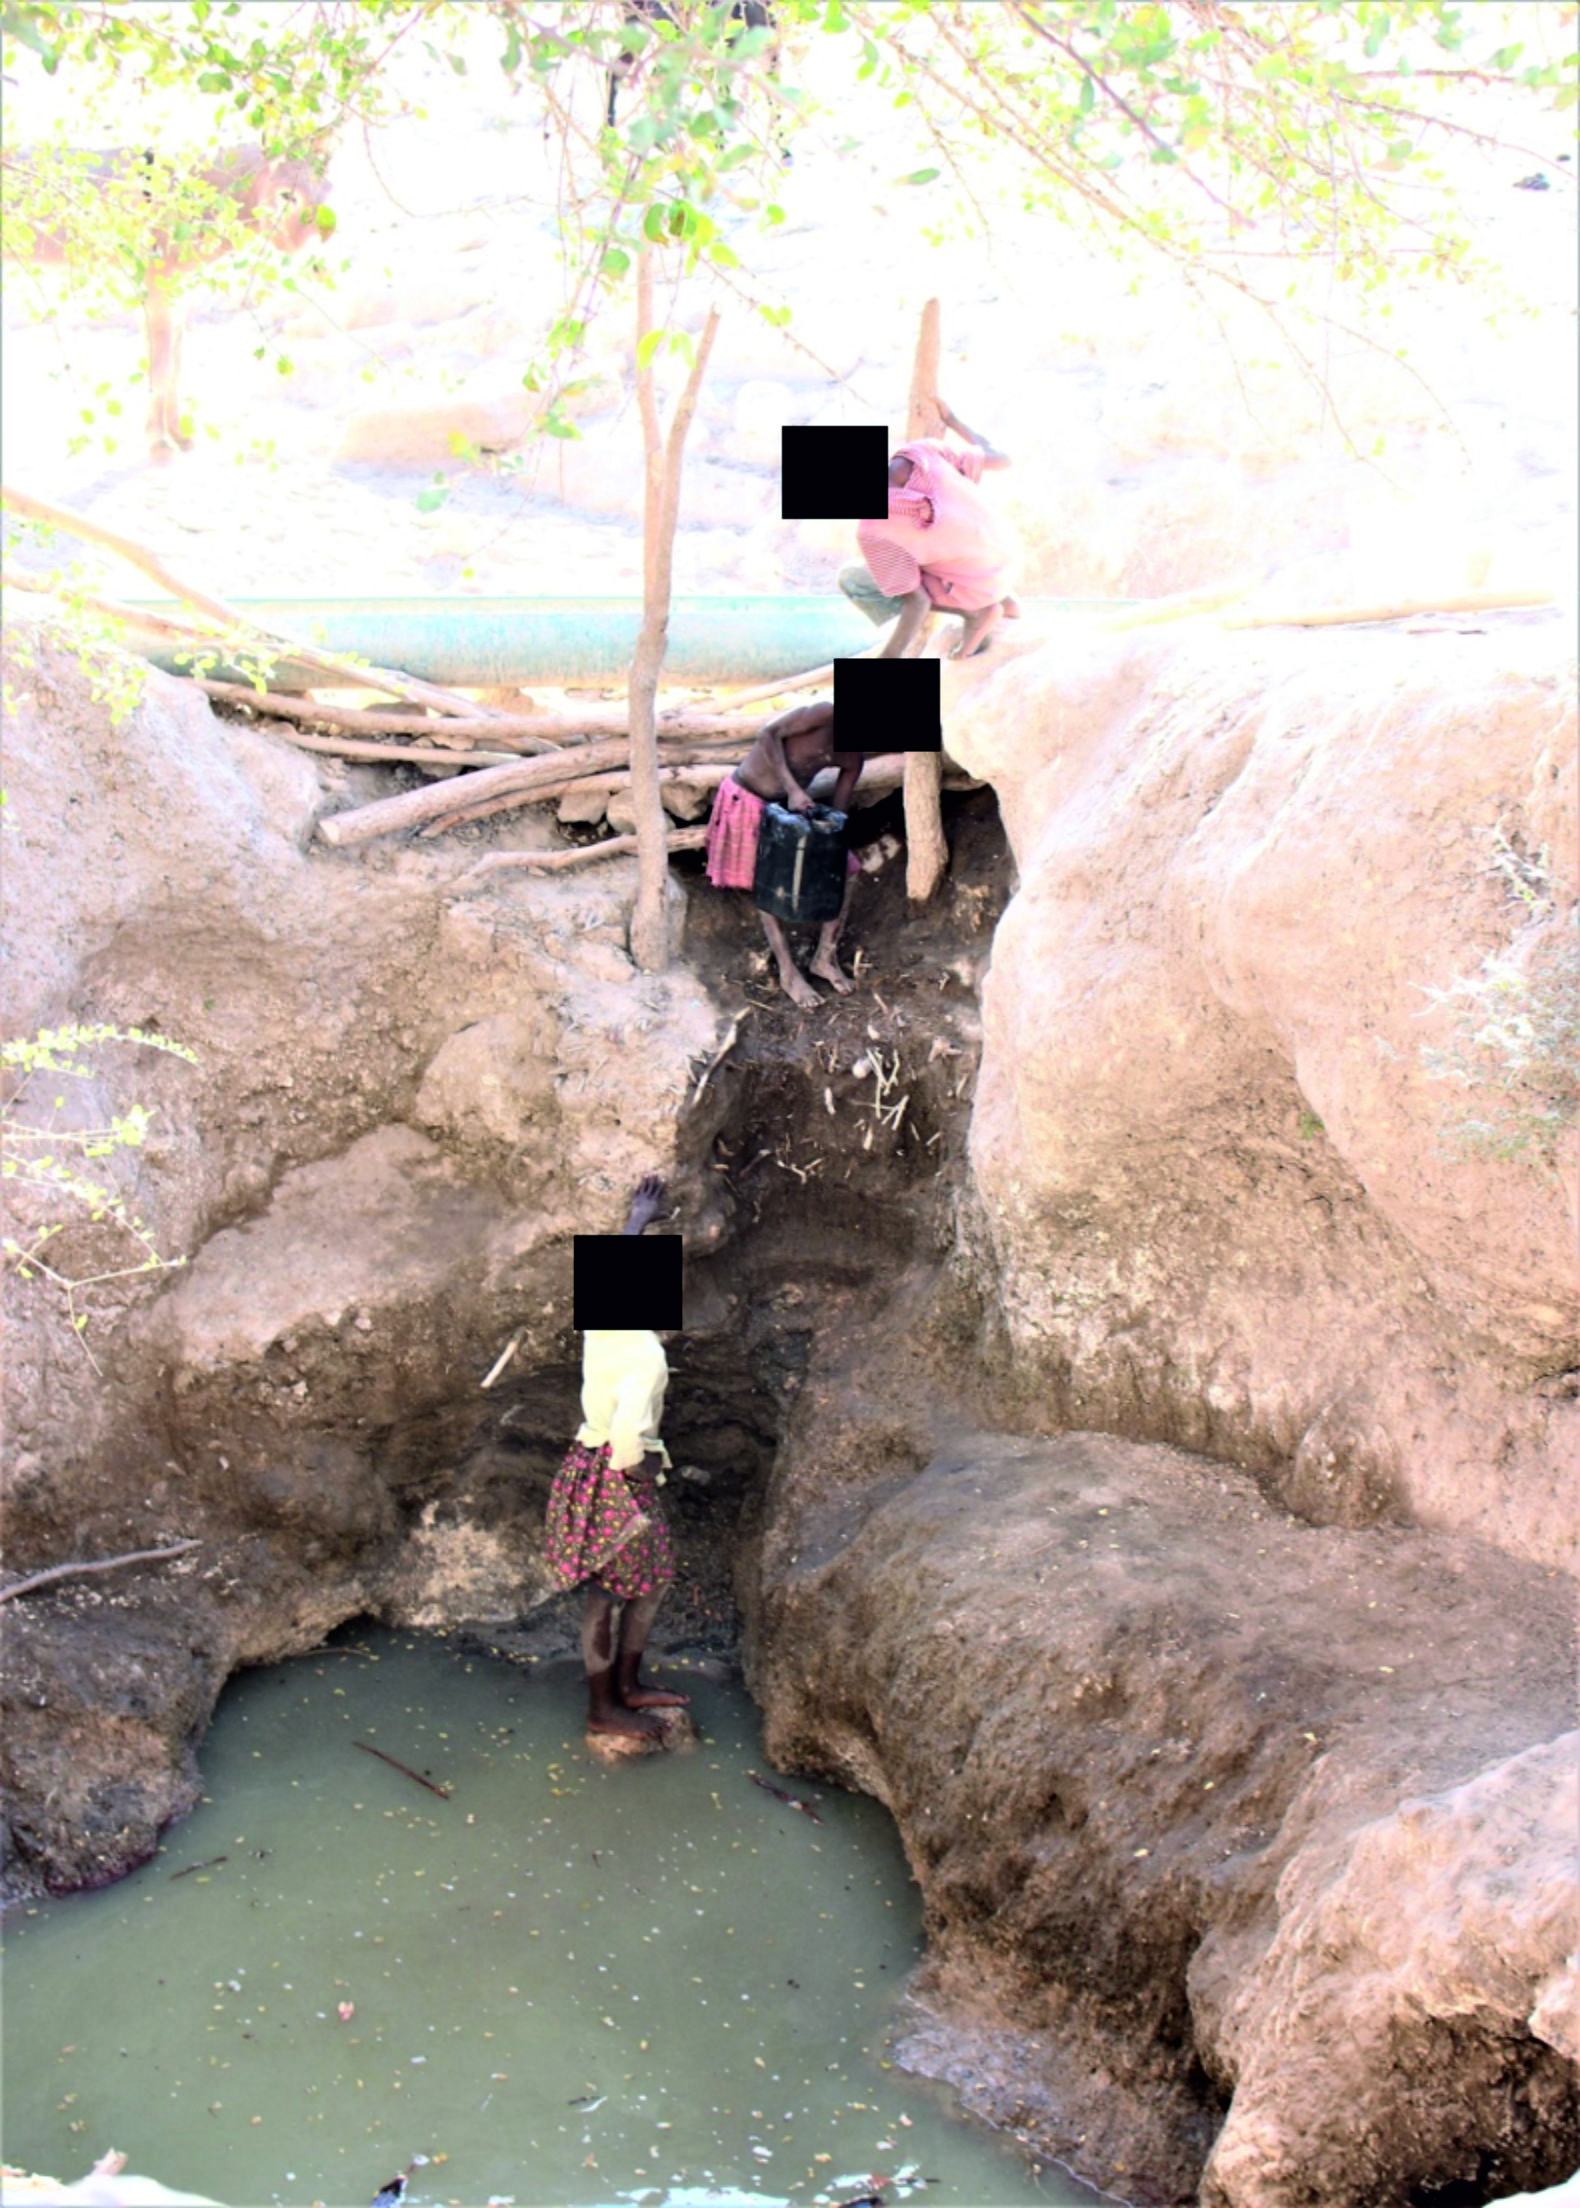
Fig. 2. A picture of type 2 shallow hand-dug wells found in Ohangwena and Omusati regions of the CEB in which animals cannot walk into the water.
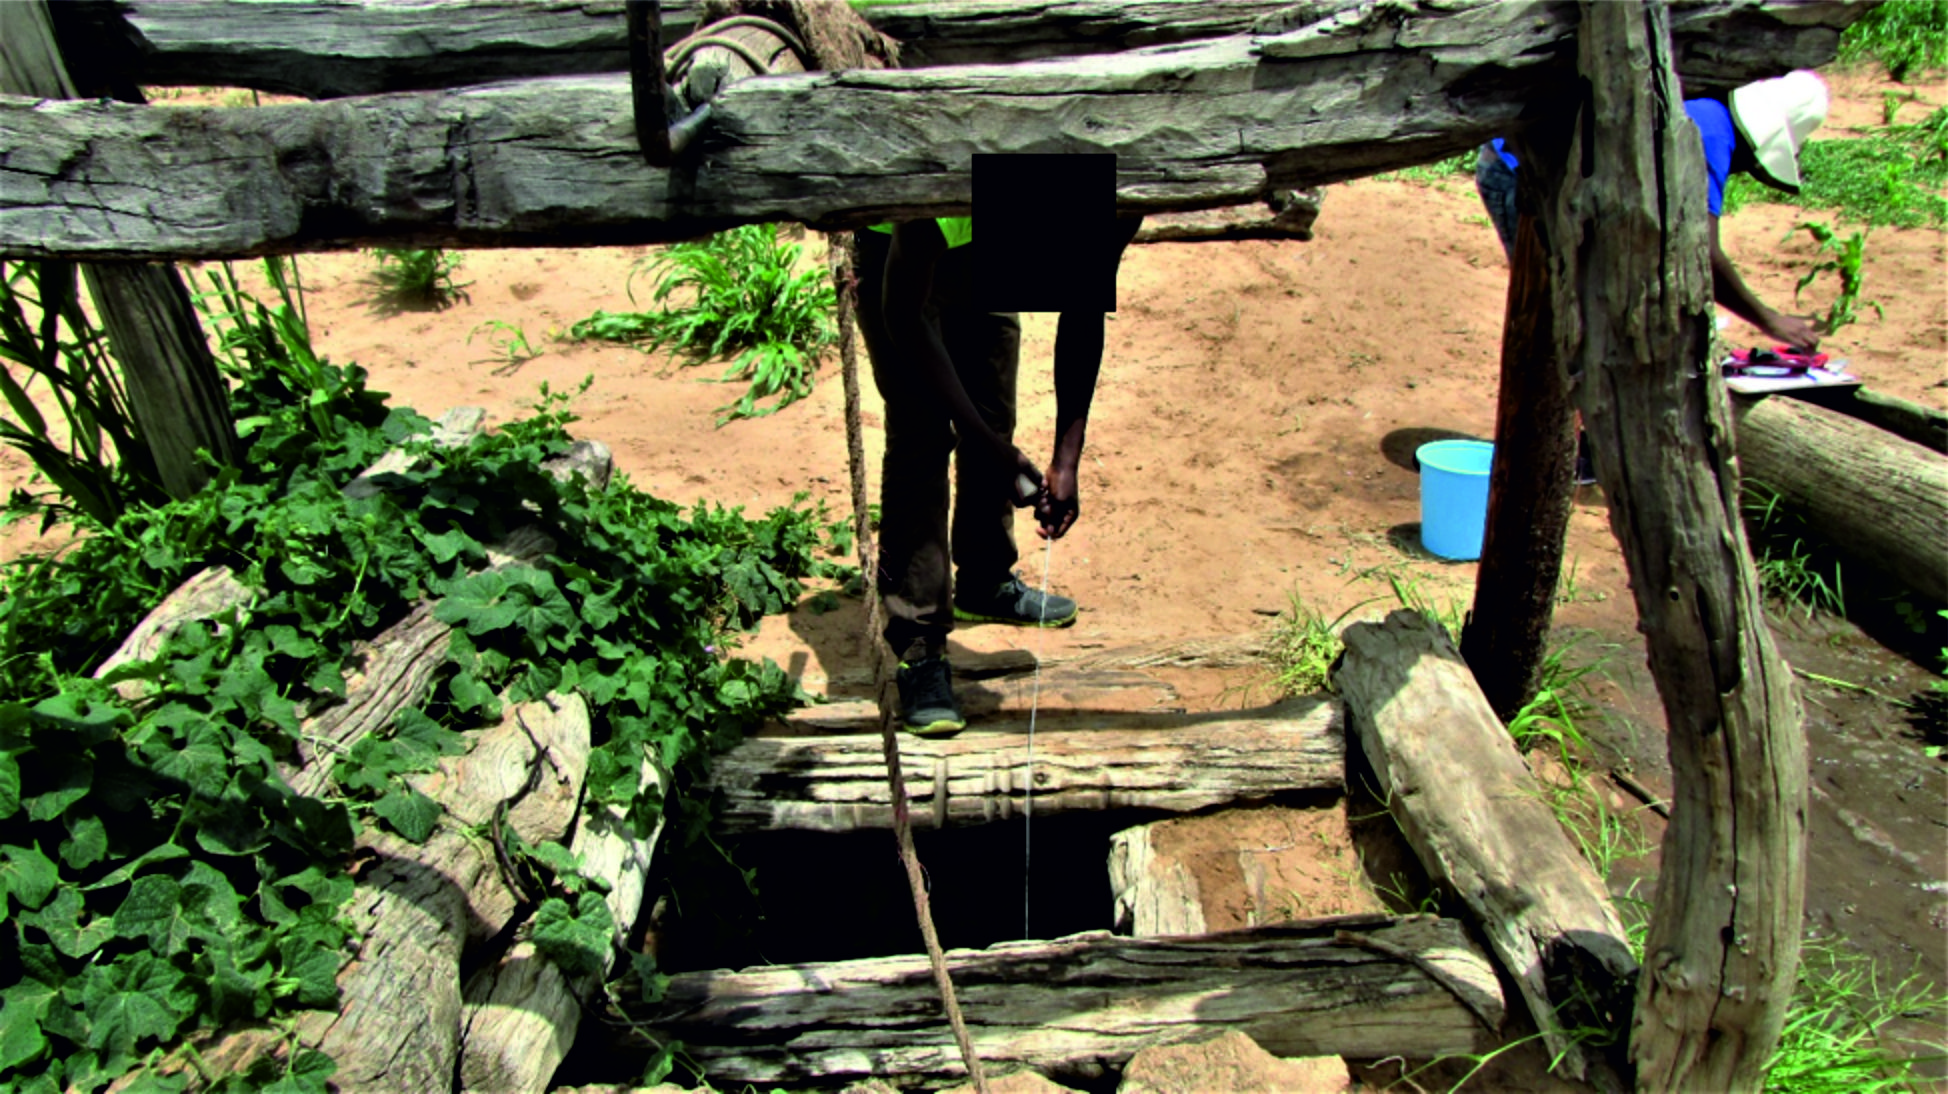
Fig. 3. A picture of type 2 shallow hand-dug wells found in Ohangwena and Omusati regions of the CEB in which animals cannot walk into the water.
DNA extraction and 16S rRNA gene amplification
Each water sample containing a volume of 200 ml was centrifuged at a speed of 100148 xg for 30 minutes in order to concentrate the microorganisms. Each volume was then reduced to 40 ml after centrifugation by discarding a portion of the supernatant. The SEEPREP 12 TM kit (Seegene, Rockville, USA) was used to extract DNA after which amplification of the 16S rRNA gene by PCR was performed using universal primer sets 27F (5′ AGAGTTTGATCMTGGCTCAG 3′) and 1492R (5′ TACGGYTACCTTGTTACGACTT 3′). The Bio-Rad thermo-cycler (Hercules, CA) was used with reaction conditions described by McBenedict et al.7 The amplicons were then prepared for next generation sequencing diversity assay using Illumina 16S sequencing at Mr. DNA Next Generation Sequencing provider in Texas, United States of America.
PCR product preparation and sequencing
The amplified amplicons from above were prepared for sequencing as described by the Illumina TruSeq DNA library preparation protocol. A MiSeq was used for Illumina 16s (20k 2x300bp) sequencing performed at MR. DNA (www.mrdnalab.com, Shallowater, TX, USA) according to the manufacturer’s guidelines, and sequence data were processed using an exclusive analysis pipeline from MR. DNA.
16S rRNA metagenomics data collection and analysis
The metagenomics sequence data obtained from Mr. DNA Next Generation Sequencing provider (Texas, United States of America) were processed and edited using a proprietary analysis pipeline (www.mrdnalab.-com, MR. DNA, Shallowater, TX). The Q25 sequence data derived from the sequencing process were depleted of barcodes and primers, and short sequences less than 150 bp were removed. In addition, sequences with ambiguous base calls, and homopolymer runs exceeding 6 bp were removed. The sequences were then denoised and chimeras also removed. Operational taxonomic units (OTUs) were defined after removal of singleton sequences, clustering at 3% divergence (97% similarity) according to other works10. OTUs were then taxonomically classified by performing a BLASTn against a curated GreenGenes, RDPII (http://rdp.cme.-msu.edu) and NCBI (www.ncbi.nlm.nih.gov) databases and compiled into each taxonomic level11. The data was arranged into counts and percentages based on the number of sequences in each sample.
Construction of a phylogenetic tree
From the total identified OTU’s, selection of cleaned bacterial sequences of those bacteria known to cause disease in humans was performed. A phylogenetic tree was constructed from cleaned sequences using the Maximum Likelihood Method12. Only the trees with the highest log likelihood were chosen and percentages of trees in which the associated taxa clustered together were shown next to the branches. Initial tree(s) for the heuristic search were obtained automatically by applying the Neighbor-Join and BioNJ algorithms to a matrix of pairwise distances estimated using the Maximum Composite Likelihood (MCL) approach, and then selecting the topology with superior log likelihood value. Bootstrap was performed and the consensus trees inferred from 1000 replicates were taken to represent the evolutionary history of the taxa analysed13. Branches corresponding to partitions reproduced in less than 70% bootstrap replicates were collapsed and the percentage of replicate trees in which the associated taxa clustered together in the bootstrap test (1000 replicates) were also indicated next to the branches. The evolutionary analyses were conducted in MEGA 713. A V. cholerae strain with accession number KJ725364.1 was retrieved from the NCBI website and used as the outgroup to root the phylogenetic tree.
Influence of season on the abundance of human bacterial pathogens
The human bacterial pathogens with their respective counts were identified and subjected to analysis. The distribution of these pathogens between the wet and dry seasons was evaluated by entering the data into SPSS version 24 to; generate the Shapiro-Wilk test and Kolmogorov-Smirnov test values, visually inspect histograms, Normal Q-Q Plots, and calculation of Z scores from Skewness and Kurtosis. An Independent Samples Mann-Whitney U test was used to investigate the influence of season on the abundance of the human bacterial pathogens.
Bacterial species diversity, evenness and richness
Species diversity is the number of species and abundance of each species present in a particular area while species richness is the number of species present in a particular area14. Species evenness is the measure of the relative abundance of different species in a particular area14. Species diversity, evenness and richness are fundamental in determining ecosystem health, and in the present study it gave an indication of contamination levels. In each hand-dug well, bacterial species richness was counted, and Shannon-Wiener diversity indices, Simpson’s diversity indices and species evenness were calculated using the formulas described in literature14,15.
Possible differences in Shannon-Wiener diversity indices and species richness of human pathogenic bacteria between the wet and dry seasons were tested using a Paired sample t-test while differences in Simpson diversity indices and species evenness of human pathogenic bacteria between the wet and dry seasons were tested using the Mann-Whitney U test.
Physical parameters analysis
The physical parameters (pH, Ec, temperature, redox potential) were entered into PC-ORD version 7 in order to investigate the influence of these parameters on the abundance of human pathogenic bacterial species using Nonmetric multidimensional scaling (NMS) multivariate analysis. NMS ordination procedure was done using Sרrensen (Bray-Curtis) distance measure. Number of runs used with real data was 200.
Phylogenetic tree
A total of 181 human pathogens were identified and used to generate a phylogenetic tree showing the relationships between the detected human pathogens (Fig. 4). It was disclosed that L. garvieae, L. lactis, Lactococcus sp., S. lutetiensis, S. gordonii, S. sanguinis, L. pseudomesenteroides, L. iners, L. paraplantarum, L. fermentum, L. plantarum, E. faecalis, B. parabrevis, Brevibacillus sp., B. coagulans, Sporosarcina spp., E. aurantiacum, Exiguo-bacterium sp., L. massiliensis and G. sanguinis formed a cluster at 77% bootstrap. C. intestinale, C. subterminale, C. limosum and C. sporogenes formed a cluster at 81% bootstrap while A. vaginae, O. uli and Eggerthella sp. formed a cluster at 77% bootstrap. C. falsenii, C. mucifaciens, C. jeikeium, C. tuberculostearicum, C. thomssenii, C. amycolatum, D. papillomatosis, W. muralis, G. terrae, M. septicum, M. parascrofulaceum and M. ulcerans formed a cluster at 83% bootstrap, and Peptostreptococcus spp. and P. stomatis formed a cluster at 99% bootstrap. D. capnocytophagoides, D. gadei, Bacteroides spp., Dysgonomonas spp., Chitinophaga spp., Sphingobacterium spp., Flavobacterium spp., A. shahii, Alistipes spp., A. finegoldii, Empedobacter sp., Bergeyella sp., E. brevis and W. falsenii formed a cluster at 90% bootstrap. R. mucosa and Roseomonas spp. formed a cluster at 91% bootstrap while Brevundimonas spp., C. vibrioides, B. vesicularis, B. diminuta and Caulobacter spp. formed a cluster at 76% bootstrap, and M. iners and M. thiocyanatum formed a cluster at 72% bootstrap. P. mendocina, P. stutzeri, P. putida and P. oryzihabitans formed a cluster at 83% bootstrap while Dokdonella sp. and D. ginsengisoli formed a cluster at 86% bootstrap, and L. pneumophila, L. lytica and L. sainthelensi formed a cluster at 99% bootstrap. Acinetobacter spp., A. junii, A. schindleri, A. johnsonii, A. septicus, A. radioresistens, A. calcoaceticus and A. lwoffii formed a cluster at 82% bootstrap, and J. lividum and M. timonae formed a cluster at 82% bootstrap. Achromo-bacter spp., A. xylosoxidans and B. petrii formed a cluster at 83% bootstrap, and Comamonas sp., D. tsuruhatensis, A. delafieldii, A. temperans, C. kerstersii, A. facilis, Acidovorax spp. and C. testosteroni formed a cluster at 86% bootstrap. The rest of the detected species (Fig. 4) did not form any clusters. The V. cholerae strain with accession number KJ725364.1 was retrieved from the NCBI website and used as the outgroup to root the human pathogen’s tree.
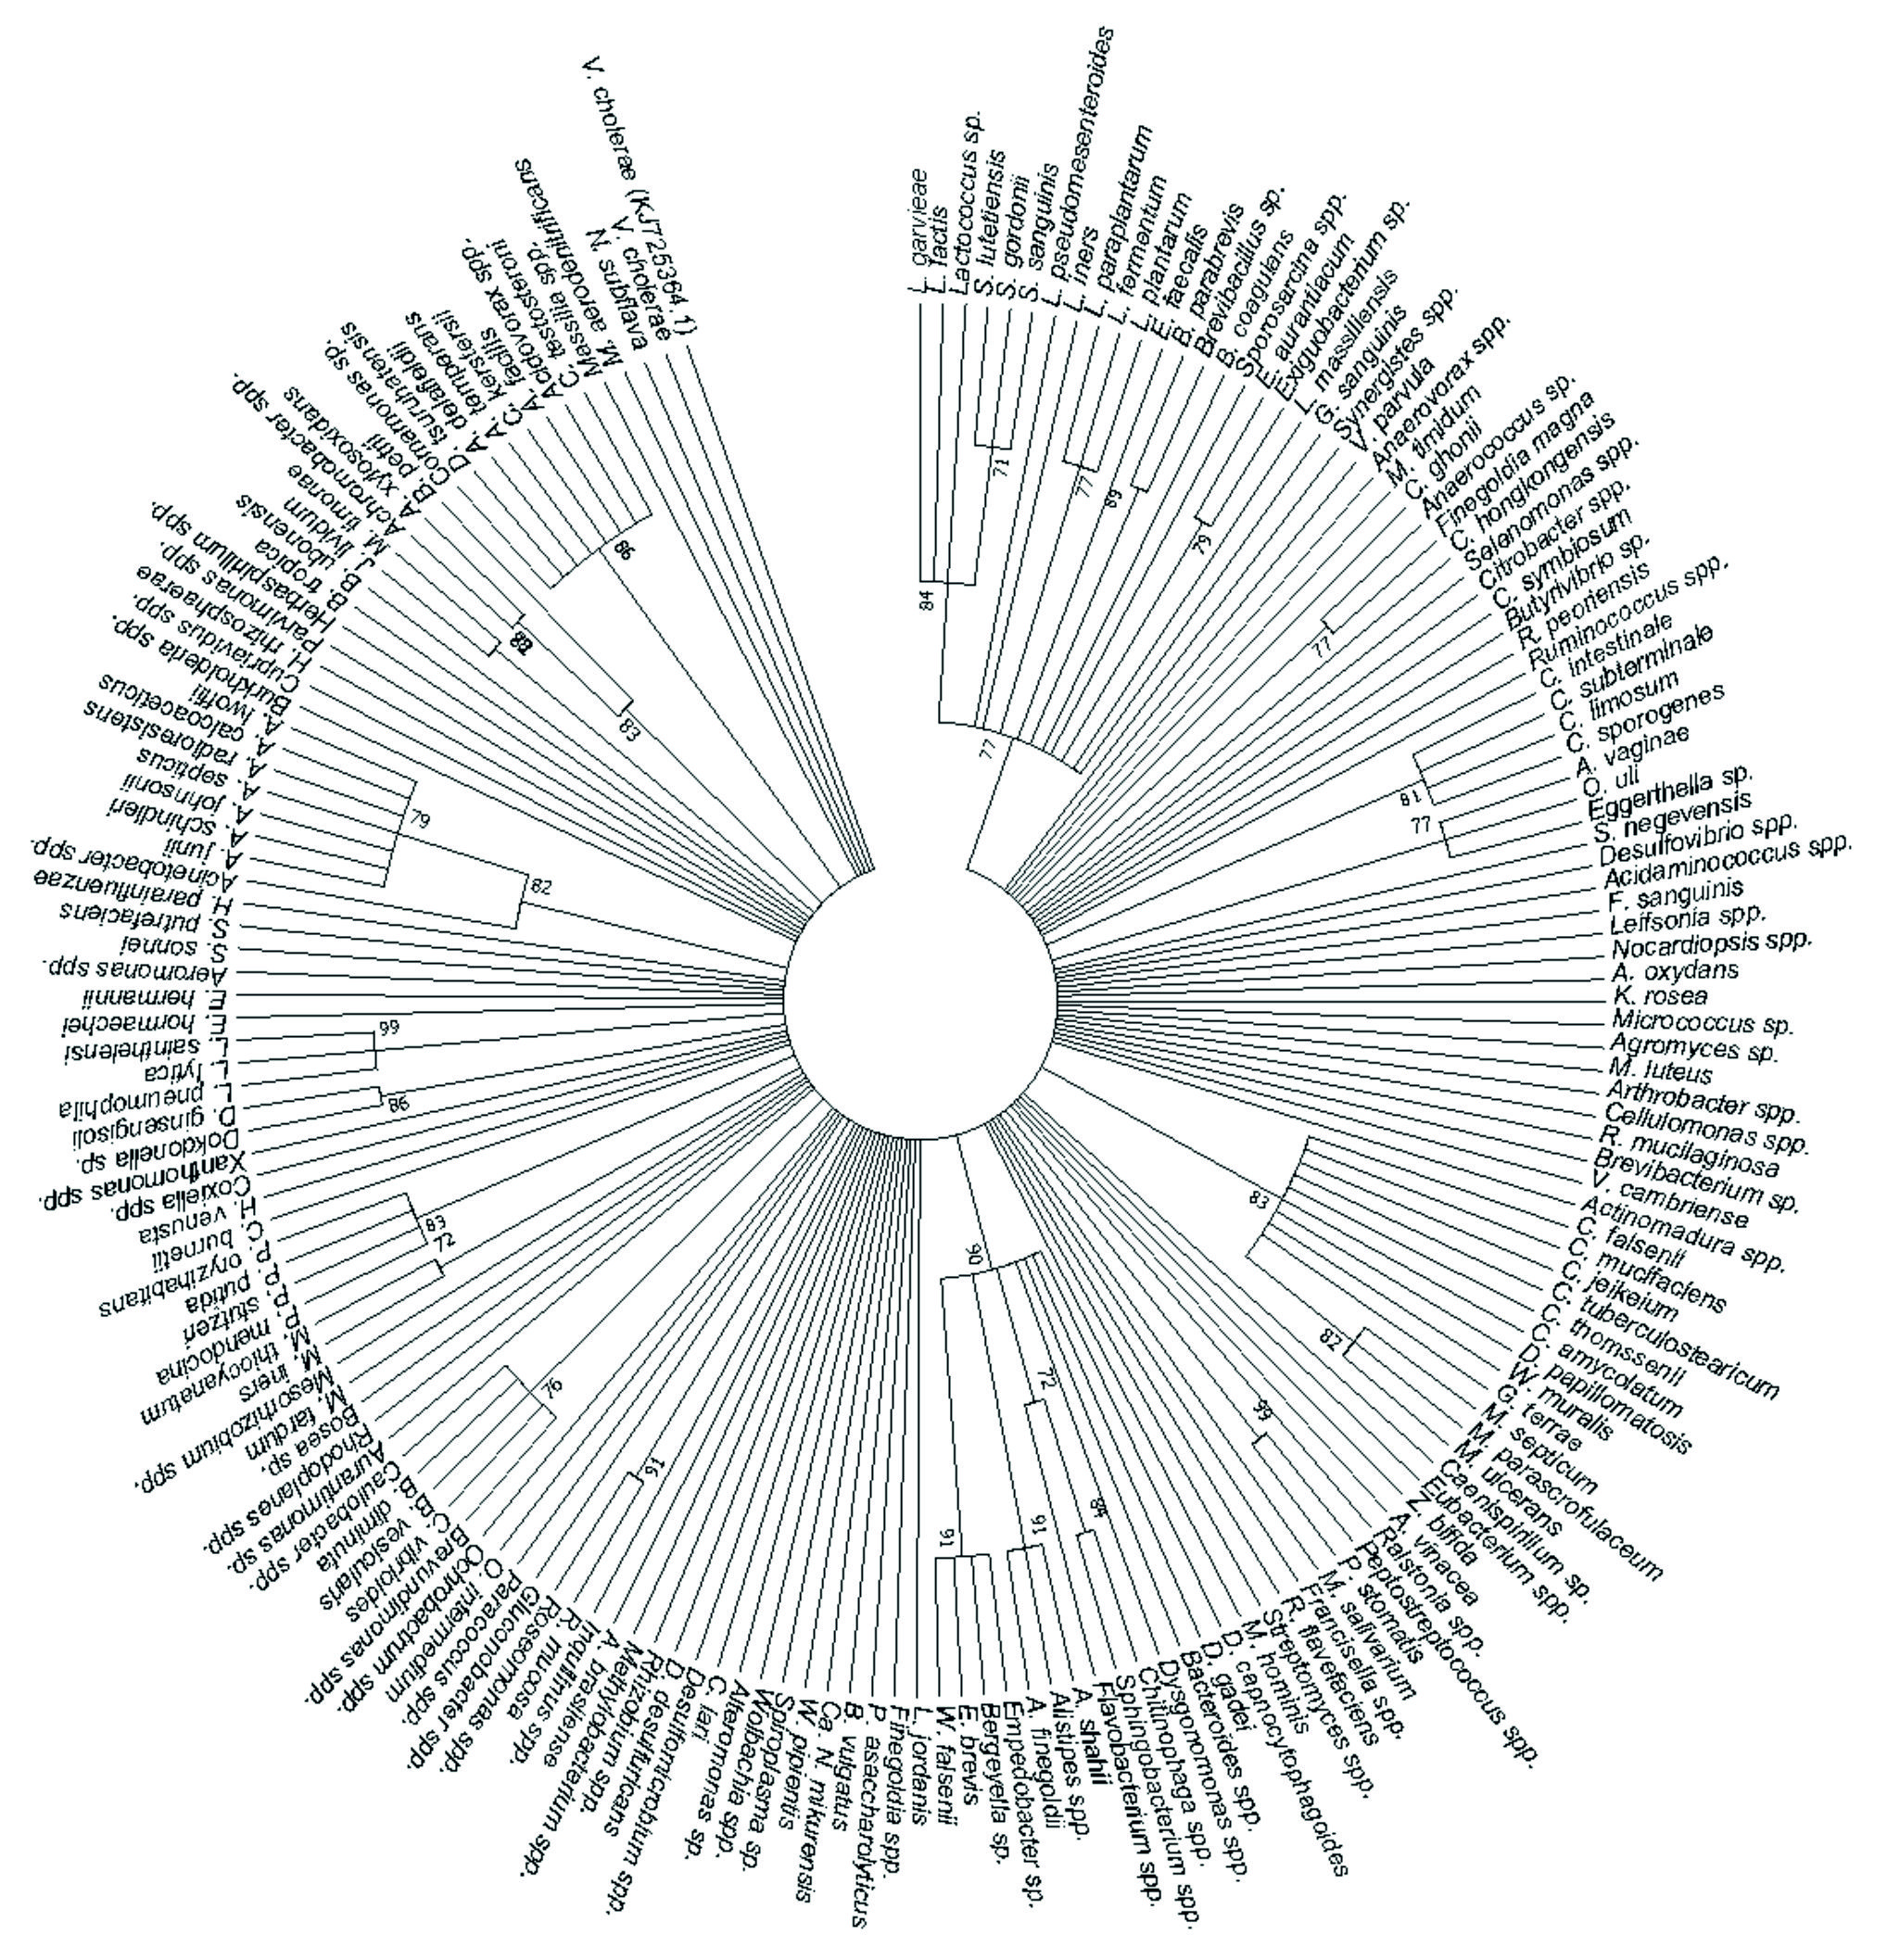
Fig. 4. The phylogenetic tree depicts the detected human bacterial pathogens by using the Maximum Likelihood method based on the Tamura-Nei model on 182 nucleotide sequences and 70% bootstrap.
Influence of season on the abundance of human bacterial pathogens
From the pathogens detected, the notable pathogens of public health concern were; H. parainfluenzae (P < 0.05), L. lytica (P < 0.05), L. sainthelensi (P < 0.05), P. mendocina (P < 0.05), P. oryzihabitans (P < 0.05), P. putida (P < 0.05), P. stutzeri (P < 0.05) and S. sonnei (P < 0.05) which showed a significant difference in abundance between the wet and dry seasons (Table 1). L. sainthelensi (P < 0.05), P. oryzihabitans (P < 0.05), P. putida (P < 0.05), P. stutzeri (P < 0.05) and S. sonnei (P < 0.05) were more abundant in wet season compared to the dry season. H. parainfluenzae (P < 0.05), L. lytica (P < 0.05) and P. mendocina (P < 0.05) were more abundant in the dry season compared to the wet season. However, there was no significant difference in the abundance of Citrobacter spp. (P > 0.05), L. jordanis (P > 0.05), L. pneumophila (P > 0.05) and V. cholera (P > 0.05) between the wet and dry seasons (Table 1).
Table (1):
Wilcoxon rank test performed to determine the influence of season on the abundance of the detected human bacterial pathogens.
Bacterial species |
Z value |
P – Value |
|---|---|---|
Achromobacter spp. |
-1.94 |
0.052 |
Achromobacter xylosoxidans |
-3.92 |
0.000 |
Acidaminococcus spp. |
-1.60 |
0.109 |
Acidovorax delafieldii |
-1.01 |
0.313 |
Acidovorax facilis |
-3.83 |
0.000 |
Acidovorax spp. |
-0.112 |
0.911 |
Acidovorax temperans |
-3.30 |
0.001 |
Acinetobacter calcoaceticus |
-0.019 |
0.985 |
Acinetobacter johnsonii |
-3.62 |
0.000 |
Acinetobacter junii |
-3.92 |
0.000 |
Acinetobacter lwoffii |
-3.88 |
0.000 |
Acinetobacter radioresistens |
-3.92 |
0.000 |
Acinetobacter schindleri |
-3.85 |
0.000 |
Acinetobacter septicus |
-3.73 |
0.000 |
Acinetobacter spp. |
-1.05 |
0.296 |
Actinomadura spp. |
-2.21 |
0.027 |
Actinomadura vinacea |
-2.68 |
0.007 |
Aeromonas spp. |
-3.07 |
0.002 |
Agromyces sp. |
-3.52 |
0.000 |
Alistipes finegoldii |
-3.74 |
0.000 |
Alistipes shahii |
-1.00 |
0.317 |
Alistipes spp. |
-2.11 |
0.035 |
Alteromonas sp. |
-1.00 |
0.317 |
Anaerococcus sp. |
-2.00 |
0.046 |
Anaerovorax spp. |
-3.54 |
0.000 |
Arthrobacter oxydans |
-2.02 |
0.043 |
Arthrobacter spp. |
-0.65 |
0.514 |
Atopobium vaginae |
-1.34 |
0.180 |
Aurantimonas sp. |
-2.03 |
0.042 |
Azospirillum brasilense |
-1.00 |
0.317 |
Bacillus coagulans |
-3.37 |
0.001 |
Bacteroides spp. |
-0.69 |
0.490 |
Bacteroides vulgatus |
-1.00 |
0.317 |
Bergeyella sp. |
-2.54 |
0.011 |
Bordetella petrii |
-2.82 |
0.005 |
Bosea sp. |
-2.83 |
0.005 |
Brevibacillus parabrevis |
-1.00 |
0.317 |
Brevibacillus sp. |
-1.89 |
0.059 |
Brevibacterium sp. |
-2.99 |
0.003 |
Brevundimonas diminuta |
-3.74 |
0.000 |
Brevundimonas spp. |
-2.99 |
0.003 |
Brevundimonas vesicularis |
-1.34 |
0.180 |
Burkholderia spp. |
-3.00 |
0.003 |
Burkholderia tropica |
-1.34 |
0.180 |
Burkholderia ubonensis |
-3.92 |
0.000 |
Butyrivibrio sp. |
-1.00 |
0.317 |
Caenispirillum sp. |
-1.00 |
0.317 |
Campylobacter lari |
-1.00 |
0.317 |
Candidatus neoehrlichia mikurensis |
-0.365 |
0.715 |
Catabacter hongkongensis |
-1.00 |
0.317 |
Caulobacter spp. |
-2.67 |
0.008 |
Caulobacter vibrioides |
-2.53 |
0.011 |
Cellulomonas spp. |
-3.42 |
0.001 |
Chitinophaga spp. |
-1.16 |
0.245 |
Citrobacter spp. |
-1.00 |
0.317 |
Clostridium ghonii |
-3.54 |
0.000 |
Clostridium intestinale |
-1.63 |
0.102 |
Clostridium limosum |
-1.00 |
0.317 |
Clostridium sporogenes |
-1.84 |
0.066 |
Clostridium subterminale |
-1.60 |
0.109 |
Comamonas kerstersii |
-3.06 |
0.002 |
Comamonas sp. |
-3.62 |
0.000 |
Comamonas testosterone |
-0.242 |
0.809 |
Corynebacterium amycolatum |
-1.84 |
0.066 |
Corynebacterium falsenii |
-3.83 |
0.000 |
Corynebacterium jeikeium |
-3.74 |
0.000 |
Corynebacterium mucifaciens |
-3.44 |
0.001 |
Corynebacterium thomssenii |
-3.92 |
0.000 |
Corynebacterium tuberculostearicum |
-3.92 |
0.000 |
Coxiella burnetii |
-1.34 |
0.180 |
Coxiella spp. |
-3.07 |
0.002 |
Cupriavidus spp. |
-1.71 |
0.087 |
Delftia tsuruhatensis |
-3.92 |
0.000 |
Desulfomicrobium spp. |
-2.03 |
0.042 |
Desulfovibrio desulfuricans |
-1.34 |
0.180 |
Desulfovibrio spp. |
0.00 |
1.000 |
Dietzia papillomatosis |
-2.21 |
0.027 |
Dokdonella spp. |
-0.464 |
0.642 |
Dyella ginsengisoli |
-1.83 |
0.068 |
Dysgonomonas capnocytophagoides |
-3.22 |
0.001 |
Dysgonomonas gadei |
-3.92 |
0.000 |
Dysgonomonas spp. |
-3.09 |
0.002 |
Eggerthella sp. |
-1.00 |
0.317 |
Empedobacter brevis |
-2.23 |
0.026 |
Empedobacter sp. |
-1.84 |
0.066 |
Enterobacter hormaechei |
-3.25 |
0.001 |
Enterococcus faecalis |
-3.63 |
0.000 |
Escherichia hermannii |
-2.39 |
0.017 |
Eubacterium spp. |
-1.25 |
0.212 |
Exiguobacterium aurantiacum |
-2.94 |
0.003 |
Exiguobacterium sp. |
-3.62 |
0.000 |
Fastidiosipila sanguinis |
-1.00 |
0.317 |
Finegoldia magna |
-3.83 |
0.000 |
Finegoldia spp. |
-1.00 |
0.317 |
Flavobacterium spp. |
-3.29 |
0.001 |
Francisella spp. |
-0.530 |
0.596 |
Gemella sanguinis |
-3.76 |
0.000 |
Gluconobacter spp. |
-2.96 |
0.003 |
Gordonia terrae |
-2.12 |
0.034 |
Haemophilus parainfluenzae |
-2.12 |
0.034 |
Halomonas venusta |
-2.55 |
0.011 |
Herbaspirillum rhizosphaerae |
-0.46 |
0.647 |
Herbaspirillum spp. |
-0.040 |
0.968 |
Inquilinus spp. |
-2.06 |
0.039 |
Janthinobacterium lividum |
-3.92 |
0.000 |
Kocuria rosea |
-3.92 |
0.000 |
Lachnoclostridium clostridium symbiosum |
-1.34 |
0.180 |
Lactobacillus fermentum |
-1.60 |
0.109 |
Lactobacillus iners |
-3.83 |
0.000 |
Lactobacillus paraplantarum |
-1.00 |
0.317 |
Lactobacillus plantarum |
-2.26 |
0.024 |
Lactococcus garvieae |
-2.54 |
0.011 |
Lactococcus lactis |
-3.55 |
0.000 |
Lactococcus sp. |
-1.00 |
0.317 |
Legionella jordanis |
-1.00 |
0.317 |
Legionella lytica |
-2.81 |
0.005 |
Legionella pneumophila |
-1.84 |
0.066 |
Legionella sainthelensi |
-3.93 |
0.000 |
Leifsonia spp. |
-.100 |
0.317 |
Leuconostoc pseudomesenteroides |
-2.23 |
0.026 |
Lysinibacillus massiliensis |
-3.83 |
0.000 |
Massilia spp. |
-1.34 |
0.180 |
Massilia timonae |
-2.19 |
0.029 |
Mesorhizobium spp. |
-3.31 |
0.001 |
Methylobacterium iners |
-2.23 |
0.026 |
Methylobacterium spp. |
-3.22 |
0.001 |
Methylobacterium tardum |
-3.02 |
0.003 |
Methylobacterium thiocyanatum |
-0.55 |
0.583 |
Micrococcus luteus |
-0.626 |
0.538 |
Micrococcus sp. |
-686 |
0.493 |
Microvirgula aerodenitrificans |
-1.63 |
0.102 |
Mogibacterium timidum |
-1.84 |
0.066 |
Mycobacterium parascrofulaceum |
-2.33 |
0.020 |
Mycobacterium septicum |
-3.52 |
0.000 |
Mycobacterium ulcerans |
-2.97 |
0.003 |
Mycoplasma hominis |
-1.00 |
0.317 |
Mycoplasma salivarium |
-1.00 |
0.317 |
Neisseria subflava |
-2.68 |
0.007 |
Nocardiopsis spp. |
-1.17 |
0.242 |
Ochrobactrum intermedium |
-1.84 |
0.066 |
Ochrobactrum spp. |
-2.02 |
0.043 |
Olsenella uli |
-2.97 |
0.003 |
Paracoccus spp. |
-3.36 |
0.001 |
Parvimonas spp. |
-2.06 |
0.039 |
Peptoniphilus asaccharolyticus |
-1.00 |
0.317 |
Peptostreptococcus spp. |
-1.00 |
0.317 |
Peptostreptococcus stomatis |
-1.34 |
0.180 |
Pseudoclavibacter zimmermannella bifida |
-1.00 |
0.317 |
Pseudomonas mendocina |
-3.54 |
0.000 |
Pseudomonas oryzihabitans |
-3.84 |
0.000 |
Pseudomonas putida |
-3.92 |
0.000 |
Pseudomonas stutzeri |
-3.92 |
0.000 |
Ralstonia spp. |
-3.31 |
0.001 |
Rhizobium spp. |
-3.92 |
0.000 |
Rhodoplanes spp. |
-1.91 |
0.056 |
Robinsoniella peoriensis |
-2.02 |
0.043 |
Roseomonas mucosa |
-1.34 |
0.180 |
Roseomonas spp. |
-0.150 |
0.881 |
Rothia mucilaginosa |
-1.34 |
0.180 |
Ruminococcus flavefaciens |
-0.518 |
0.605 |
Ruminococcus spp. |
-3.13 |
0.002 |
Selenomonas spp. |
-1.84 |
0.066 |
Shewanella putrefaciens |
-3.92 |
0.000 |
Shigella sonnei |
-3.92 |
0.000 |
Simkania negevensis |
-1.34 |
0.180 |
Sphingobacterium spp. |
-0.967 |
0.334 |
Spiroplasma sp. |
-1.60 |
0.109 |
Sporosarcina spp. |
-1.92 |
0.054 |
Streptococcus gordonii |
-3.92 |
0.000 |
Streptococcus lutetiensis |
-1.84 |
0.066 |
Streptococcus sanguinis |
-2.53 |
0.011 |
Streptomyces spp. |
-0.944 |
0.345 |
Synergistes spp. |
-1.60 |
0.109 |
Varibaculum cambriense |
-3.93 |
0.000 |
Veillonella parvula |
-3.74 |
0.000 |
Vibrio cholera |
-1.23 |
0.219 |
Wautersiella falsenii |
-1.34 |
0.180 |
Williamsia muralis |
-2.46 |
0.014 |
Wolbachia pipientis |
-1.34 |
0.180 |
Wolbachia spp. |
-3.10 |
0.002 |
Xanthomonas spp. |
-1.04 |
0.299 |
Bacterial species diversity, evenness and richness
The Kolmogrov-Smirnov test revealed that Shannon-Wiener diversity indices and species richness data were normally distributed (P > 0.05). A Paired sample t-test revealed that there was no significant difference between Shannon-Wiener diversity (H’) indices, and species richness of human pathogenic bacteria in the wet and dry seasons (Table 2). Simpson diversity indices and species evenness data were not normally distributed (P < 0.05). According to the Wilcoxon rank test, there was no significant difference in Simpson diversity (D) data across the wet and dry seasons. However, species evenness data differed significantly between the wet and dry seasons.
Table (2):
Tests performed to determine the influence of season on human pathogenic bacterial species richness (R), evenness (E) and diversity [Shannon (H’) and Simpson (D)]
| Wet season | Dry season | |||||||
|---|---|---|---|---|---|---|---|---|
| Parameters | H’ | D | R | E | H’ | D | R | E |
| Mean | 2.05 | 0.798 | 60.80 | 0.10 | 2.30 | 0.750 | 60.25 | 0.89 |
| St.Dev | 0.51 | 0.104 | 5.38 | 0.02 | 0.74 | 0.202 | 12.43 | 0.22 |
| Test statistics value | T = -1.22 | Z= -0.299 | T=0.16 | Z = -3.920 | T = -1.22 | Z = -0.299 | T=0.16 | Z= -3.920 |
| df | 19.00 | 19.00 | 19.00 | 19.00 | 19.00 | 19.00 | 19.00 | 19.00 |
| P-value | P > 0.05 | P > 0.05 | P > 0.05 | P < 0.05 | P > 0.05 | P > 0.05 | P > 0.05 | P < 0.05 |
Physical parameters
The pH values ranged from 7.18 to 8.31 in the wet season and 5.68 to 8.34 in the dry season, and temperature values ranged from 13.2° C to 26.3° C in the wet season and 20.5° C to 34.6° C in the dry season. The electrical conductivity values ranged from 54.5 µS/cm to 7240 µS/cm in the wet season and 62.4 µS/cm to 14420 µS/cm in the dry season, and the redox potential ranged from -380.1 Mv to 160.9 Mv in the wet season and -403.6 Mv to 141.2 Mv in the dry season. The NMS analysis performed had a total of 500 iterations upon which a final solution was reached with a stress of 11.807 and a final instability of 0.000001. NMS results revealed that the main physical factors that influenced the distribution of human pathogenic bacteria in hand-dug wells were temperature r=-0.628 tau=-0.365 and pH tau=0.645 tau= 0.401. pH was positively correlated with the wet season while temperature was correlated with the dry season (Fig. 5).
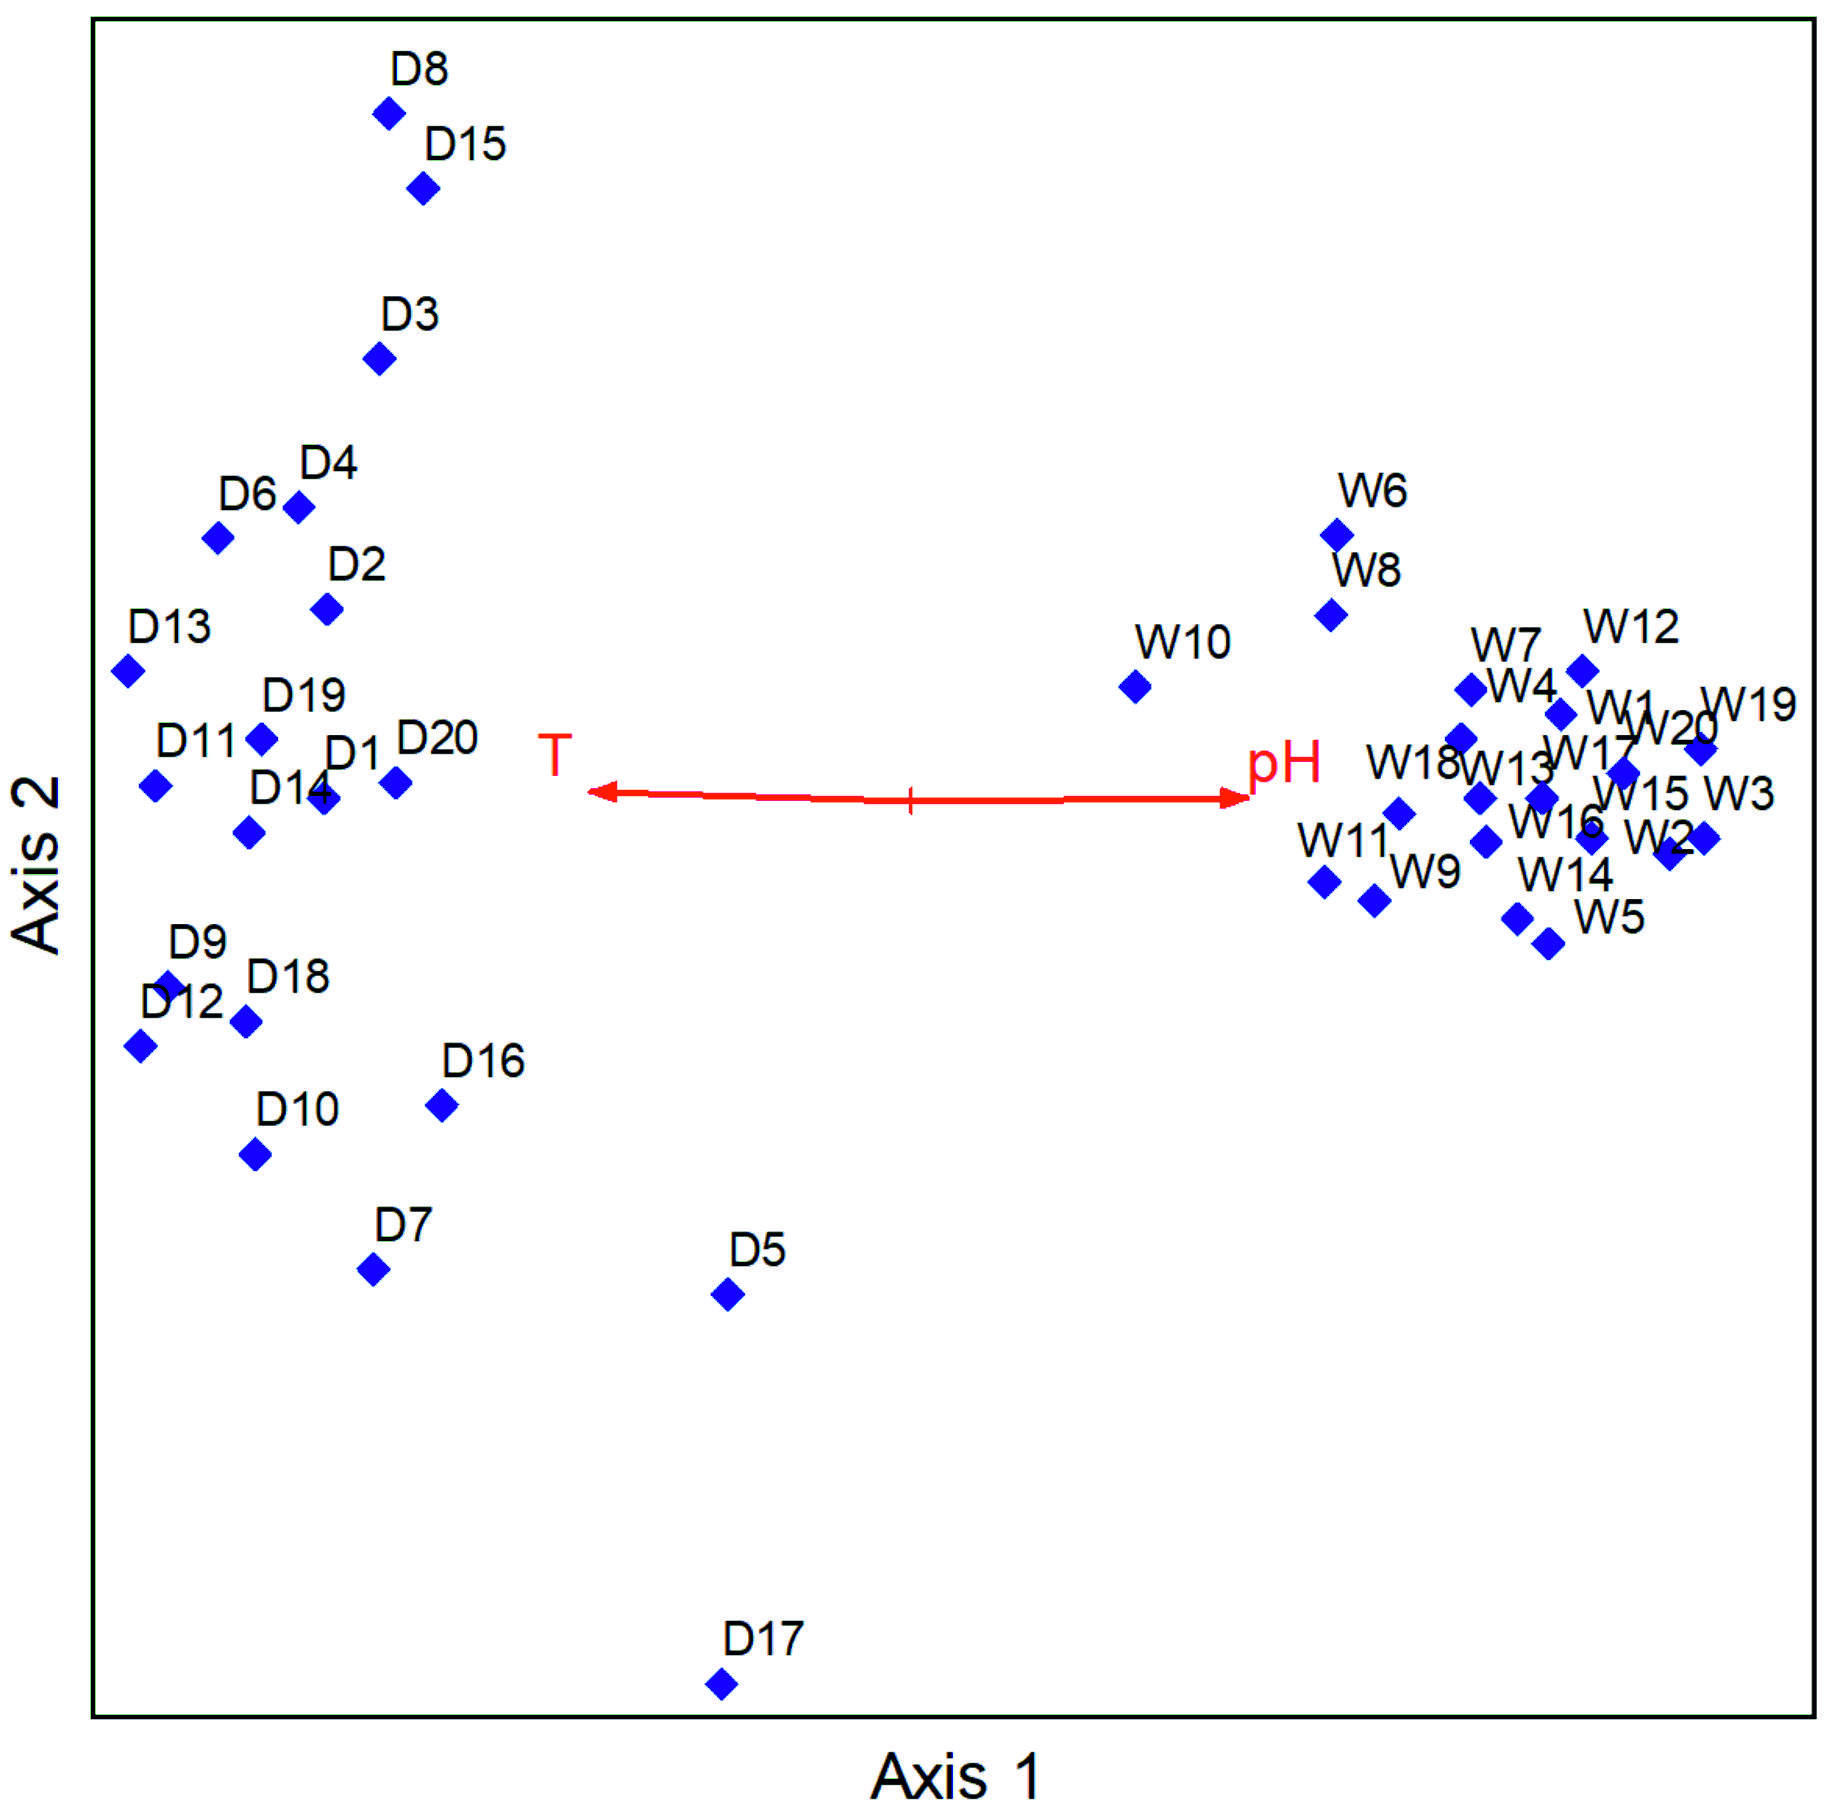
Fig. 5. NMS result of human pathogenic bacteria illustrating a Biplot overlaid with physical factors (D=Dry season samples, W=Wet season samples).
Most clusters of the phylogenetic tree were formed by species belonging to the same genus indicating their close relation. The detection of multiple species in each genus and their close relation confirmed intra-genus versatility. Human pathogenic bacterial species diversity and richness did not show a significant difference between the wet and dry season indicating that hand-dug well bacterial diversity and richness is independent of season. The sustained species diversity and richness was caused by the poor structure, lack of protection from animal access and lack of a covered top throughout the year allowing bacteria to be deposited into these wells. The easy access of livestock, other domestic and wild animals or birds to the water exposes these hand-dug wells to different human pathogenic bacteria regardless of season.
The diversity and richness of human pathogenic bacteria was similar in the hand-dug wells in both season due to continuous contact between soil and water in the hand-dug wells. Since various bacteria belonging to different phyla have mostly been reported to be found in the soil,16 it is plausible that most of the bacteria detected originated from the soil, and were either active or dormant which is an inherent limitation of Metagenomics. Moreover, it is known that water availability and nutrients are among the main limiting factors influencing bacterial growth and survival.17 The water-soil bacteria interface allows these bacteria to survive thereby maintaining the diversity within the hand-dug wells and this agrees with Bull18 who reported that bacteria can grow and survive at various ranges of physicochemical parameters, and growth occurs at a slow rate because the environment is not well optimized. The findings of this study confirmed Sun et al.19 ’s results which showed a high diversity and richness of bacteria in a river in both the wet and dry seasons with no significant difference between the two seasons (P > 0.05). Sun et al.19 recorded Shannon indices values of 9.53 and 9.42 respectively for dry and wet seasons. However, the present study recorded lower values of Shannon indices than reported by Sun et al.19, but still displayed high diversity and richness in both seasons. Furthermore, the high diversity of human pathogenic bacteria in both seasons confirmed that bacteria have pronounced ecophysiological plasticity that permits them to adapt to various freshwater ecosystems and dynamic seasonal changes19,20.
Hand-dug wells had animal droppings and visible floating debris which provided a carbon rich environment propitious for microbial growth. This carbon rich environment coupled with the soil-water interface can enhance the ability of the microorganisms to cope with various or fluctuating environmental conditions by the transfer and exchange of genes owed to microbial interactions. This is evident because Escherichia species were once described to be unable to survive lengthy periods outside the intestines of warm blooded animals but other works21,22 have indicated that E. coli strains survive in soil and water that’s not known to be faecally contaminated. The current status quo demands the development of a more suitable indicator of recent faecal contamination and further research to explore these emerging patterns.
The present study indicated that there was a significant difference in abundance and evenness of human pathogenic bacterial species between the dry and wet seasons. The wet season had higher abundances of human pathogenic bacterial species than the dry season, and human bacteria pathogen species in the dry season were more even than in the wet season. The variation in abundance was due to surface runoff and the downward transportation of bacteria by water through the permeable soil layers in the wet season. Surface runoff transports various bacteria into the hand-dug wells thereby elevating the abundance of some human pathogenic bacteria and leading to none even distribution of bacterial abundance in the wet season. Most of the detected pathogens were soil and gut bacteria and this agrees with Thomas23 who disclosed that Namibia is amongst the highest rated southern African countries with open defecation. The poor architecture of these hand-dug wells and the livestock and human faeces that are found at sites near the hand-dug wells promote the entry of faecal matter especially in the wet season. However, it’s worth noting that surface runoff mainly affects the abundance and evenness than diversity and richness especially that the water is mostly in contact with soil. It is not to rule out that new species are introduced into these hand-dug wells but to emphasize that the amount is either negligible with respect to diversity or it is sustained throughout the year.
The abundance is easily increased since water serves as a transporter of these contaminants especially in rain season when the water penetrates the permeable soil layers reaching the aquifers below that are shared by the hand-dug wells within the same vicinity,24 eliminating potential differences in contamination levels that would otherwise exist due to different types hand-dug wells. Further-more, it was noted that temperature was positively correlated with the dry season and negatively correlated with the wet season while pH was positively correlated with the wet season and negatively correlated with the dry season. It is established that pH and temperature have an influence on the growth and survival of bacteria. Optimal bacterial growth occurs at various levels of pH ranging from low, moderate, and high in different species. Similarly, various bacterial species have different temperature ranges for optimal growth.25 This agrees with literature16,18 disclosing that pH, salinity, water content, temperature, pressure and radiation are the major physicochemical parameters that regulate bacterial growth and survival.
The notable human pathogens of public health concern were; Citrobacter spp. known to cause urinary tract infections (UTI), meningitis, bacteraemia and haemolytic–uraemic syndrome, H. parainfluenzae known to cause sinusitis, otitis media, pneumonia, abscesses, endocarditis, and biliary tract infections26, Legionella species (L. jordanis, L. lytica, L. pneumophila and L. sainthelensi) known to cause Legionnaires’ disease, respiratory tract infections and Pontiac fever, Pseudomonas species (P. mendocina, P. oryzihabitans, P. putida, P. stutzeri) known to cause bacteraemia, UTI, wound infection, abscesses, septic arthritis, conjunctivitis, endocarditis, meningitis, otitis, sepsis, peritonitis, pneumonia and urinary tract infections27, S. sonnei known to cause enteric infections28,29, and V. cholerae known to cause cholera30.
parainfluenzae, L. lytica, L. pneumophila, L. sainthelensi, P. mendocina, P. oryzihabitans, P. putida, P. stutzeri and S. sonnei showed a significant difference in abundance between the wet and dry seasons. L. sainthelensi, P. oryzihabitans, P. putida, P. stutzeri and S. sonnei were more abundant in wet season compared to the dry season, demonstrating that the communities of the CEB are exposed to these pathogens to a higher extent in the wet season than the dry season. The presence of Shigella species in these hand-dug wells is of grave concern because it is highly infectious. Bacterial counts of 0-100 are adequate to induce shigellosis in humans31. H. parainfluenzae, L. lytica, L. pneumophila and P. mendocina were more abundant in the dry season compared to the wet season, indicating that diseases caused by these species are expected to surge in the dry season. However, there was no significant difference in the abundance of Citrobacter spp., L. jordanis and V. cholerae between the wet and dry seasons, indicating that the CEB communities are exposed to these pathogens continuously. This explains the non-seasonal sporadic cholera outbreaks that occur in these communities and highlights the necessity of adhering to hygiene practices and implementing routine hand-dug well water bacteriological analysis. The rest of the detected human pathogens are reported to mostly cause endocarditis, meningitis and bacteraemia.
Metagenomics provided vast information regarding the microbial communities and safety of the hand-dug wells in the CEB for household consumption by bypassing limitations of culturing based methods that lead to the inability to quantify the total natural diversity within a given habitat32. Since Meta-genomics is a PCR-based analyses of microbial diversity, it is entrenched with some biases that are inherent to PCR applications that have been described by other studies33,34,35,36. However, it should be noted that since Meta-genomics as opposed to Metatranscriptomics is a DNA based technique, the microbial communities detected potentially included DNA from dead bacteria thereby displaying an over representation of bacterial communities or omitted some bacteria due to DNA extraction difficulties as described by Filippidou et al34. This might have led to a low coverage of less abundant taxa known as “depth bias” and under representation of certain taxa. The findings of this study led to the conclusions that seasonality has an influence on evenness and overall abundance levels but none on species diversity and richness of human bacterial pathogens in hand-dug wells. Generally, this study showed that the water in hand-dug wells of the CEB is not safe for consumption and domestic use unless sanitized.
CEB: Cuvelai Etosha Basin; SASSCAL: Southern African Science Service Centre for Climate Change and Adaptive Land Management; WHO: World Health Organisation; pH: potential of hydrogen; OTU: Operational taxonomic units; H’: Shannon-Wiener diversity; D: Simpson diversity; R: Richness; E: Evenness; NMS: Nonmetric Multidimensional Scaling; UTI: urinary tract infections; PCR: Polymerase Chain Reaction.
Acknowledgements
We thank Dr. Wanke through SASSCAL for funding this research and Josephine Hamutoko for the combined sampling with Billy McBenedict, and recording of pH, temperature and electrical conductivity.
Conflicts Of Interest
The authors declare that they have no competing interests.
Funding
This work was funded by Dr. Heike Wanke through SASSCAL through a Doctorate research scholarship. The funding body did not have a role in the analysis and interpretation of the data, and preparation or writing of this manuscript.
Author Contributions
BM collected the water samples and performed the research. WH and BM analysed microbial diversity, richness, evenness and the statistical analysis. BM, WH, HW, PC and BH wrote the manuscript. BM, PC and BH reviewed the manuscript.
Funding
This work was funded by Dr. Heike Wanke through SASSCAL through a Doctorate research scholarship. The funding body did not have a role in the analysis and interpretation of the data, and preparation or writing of this manuscript.
Data Availability
The 16S rRNA sequences data that were generated in the current study are available on GenBank, with the following accession numbers: MH050446 – MH050607. The raw sequence files deposited into the Sequence Read Archive (SRA) are also available on GenBank under BioProject ID; PRJNA478691 and BioSample accessions; SAMN 09521643, SAMN 09521644, SAMN 09521645, and SAMN 09521646.
Ethics Statement
Not applicable
- Mendelson J., Jarvis A., Roberts C. and Robertson, T. Atlas of Namibia: A Portrait of the Land and its People. Cape Town. 2009.
- Christellis G., Struckmeier W. and Baumie R. Groundwater in Namibia: an explanation to the hydroegeological map. 2001
- Amakali M., Swatuk L.A. Different approaches to local level participation in river basin management in Namibia: A comparison between the Kuiseb and Cuvelai basins. InTransboundary Water Governance in Southern Africa 2009 Jan 14 (pp. 111-132). Nomos Verlagsgesellschaft mbH & Co. KG.
- Zimmermann M. The coexistence of traditional and large-scale water supply systems in central northern Namibia. Journal of Namibian Studies: History Politics Culture,2010; 7:55-84.
- Kluge T., Liehr S., Lux A., Moser P., Niemann S., Umlauf N., Urban W. IWRM concept for the Cuvelai Basin in northern Namibia. Physics and Chemistry of the Earth, Parts A/B/C, 2008;33(1-2): 48-55.
- Lindenmaier F., Miller R., Fenner J., Christelis G., Dill H.G., Himmelsbach T., Kaufhold S., Lohe C., Quinger M., Schildknecht F., Symons G. Structure and genesis of the Cubango Megafan in northern Namibia: implications for its hydrogeology. Hydrogeology Journal, 2014; 22(6): 1307-28.
- McBenedict B., Wanke H., Hang’ombe B. M. and Chimwamurombe P.M. Bacteriological analysis of household water from hand-dug wells in the Cuvelai-Etosha Basin of Namibia. International Science and Technology Journal of Namibia, 2017; 10; 23-32.
- Sharon I., Banfield J.F. Genomes from meta-genomics. Science, 2013; 342(6162): 1057-8.
- Simon C., Daniel R. Metagenomic analyses: past and future trends. Applied and Environmental Microbiology, 2011; 77(4): 1153-61.
- Capone K.A., Dowd S.E., Stamatas G.N., Nikolovski J. Diversity of the human skin microbiome early in life. Journal of Investigative Dermatology, 2011; 131(10): 2026-32.
- DeSantis T.Z., Hugenholtz P., Larsen N., Rojas M., Brodie E.L., Keller K., Huber T., Dalevi D., Hu P., Andersen G.L. Greengenes, a chimera-checked 16S rRNA gene database and workbench compatible with ARB. Applied and Environmental Microbiology, 2006; 72(7): 5069-72.
- Tamura K., Nei M. Estimation of the number of nucleotide substitutions in the control region of mitochondrial DNA in humans and chimpanzees. Molecular Biology and Evolution, 1993; 10(3): 512-26.
- Kumar S., Stecher G., Tamura K. MEGA7: molecular evolutionary genetics analysis version 7.0 for bigger datasets. Molecular Biology and Evolution, 2016; 33(7): 1870-4.
- Pielou E.C. Ecological diversity. J. wiley and Sons, New York. 1975
- Magurran A.E. Measuring biological diversity. John Wiley & Sons; 2013 Apr 18.
- Mohammadipanah F., Wink J. Actinobacteria from arid and desert habitats: diversity and biological activity. Frontiers in Microbiology. 2016; 28(6): 1541.
- Stevenson A., Hallsworth J.E. Water and temperature relations of soil Actinobacteria. Environmental microbiology reports, 2014; 6(6): 744-55.
- Bull A.T. Actinobacteria of the extremobiosphere. In Extremophiles handbook 2011 (pp. 1203-1240). Springer Japan.
- Sun W., Xia C., Xu M., Guo J., Sun G. Seasonality Affects the Diversity and Composition of Bacterioplankton Communities in Dongjiang River, a Drinking Water Source of Hong Kong. Frontiers in Microbiology, 2017; 31(8): 1644.
- Allgaier M., Br ckner S., Jaspers E., Grossart H.P. Intra and inter lake variability of free living and particle associated Actinobacteria communities. Environmental Microbiology, 2007; 9(11): 2728-41.
- Ishii S., Hansen D.L., Hicks R.E., Sadowsky M.J. Beach sand and sediments are temporal sinks and sources of Escherichia coli in Lake Superior. Environmental Science and Technology, 2007; 41(7): 2203-9.
- NandaKafle G., Seale T., Flint T., Nepal M., Venter S.N., Brצzel V.S. Distribution of Diverse Escherichia coli between Cattle and Pasture. Microbes. and Environments,. 2017; 32(3): 226-33.
- Thomas A. Strengthening post-ODF programming: reviewing lessons from sub-Saharan Africa. Sustainable Sanitation for All: Experiences, challenges, and innovations, 2016: 83.
- Van der Wal A. Understanding Groundwater & Wells in manual drilling. Unicef. http://www. unicef. org/wash/files/04. pdf. 2008.
- Madigan M.T., Martinko J.M., Bender K.S., Buckley D.H. and Stahl D.A. Brock Biology of Micro-organisms. 14th edition. Pearson Education. 2015
- Frankard J., Rodriguez-Villalobos H., Struelens M.J., Jacobs F. Haemophilus parainfluenzae: an under diagnosed pathogen of biliary tract infections. European Journal of Clinical Micro-biology and Infectious Diseases. 2004; 23(1): 46-8.
- Tena D., Fernבndez C. Pseudomonas oryzi-habitans: an unusual cause of skin and soft tissue infection. Infectious Diseases, 2015; 47(11): 820-4.
- Bowen A., Eikmeier D., Talley P., Siston A., Smith S., Hurd J., Smith K., Leano F., Bicknese A., Norton J.C., Campbell D. Notes from the Field: Outbreaks of Shigella sonnei Infection with Decreased Susceptibility to Azithromycin Among Men Who Have Sex with Men-Chicago and Metropolitan Minneapolis-St. Paul, 2014. MMWR. Morbidity and mortality weekly report, 2015; 64(21): 597-8.
- Thompson C.N., Duy P.T., Baker S. The rising dominance of Shigella sonnei: an intercontinental shift in the etiology of bacillary dysentery. PLoS Neglected Tropical Diseases, 2015; 9(6): e0003708.
- Bhuiyan T.R., Hoq M.R., Nishat N.S., Al Mahbuba D., Rashu R., Islam K., Hossain L., Dey A., Harris J.B., Ryan E.T., Calderwood S.B. Enumeration of gut-homing b7-positive, pathogen-specific antibody-secreting cells in whole blood from enterotoxigenic Escherichia coli-and Vibrio cholerae-infected patients, determined using an enzyme-linked immunosorbent spot assay technique. Clinical and Vaccine Immunology, 2016; 23(1): 27-36.
- Alamanos Y., Maipa V., Levidiotou S., Gessouli E. A community waterborne outbreak of gastro-enteritis attributed to Shigella sonnei. Epidemio-logy and Infection, 2000; 125(3): 499-503.
- Lombard N., Prestat E., van Elsas J.D., Simonet P. Soil specific limitations for access and analysis of soil microbial communities by metagenomics. FEMS Microbiology Ecology, 2011; 78(1): 31-49.
- De Bruijn F.J. Handbook of molecular microbial ecology II: metagenomics in different habitats. John Wiley & Sons; 2011 Oct 14.
- Filippidou S., Junier T., Wunderlin T., Lo C.C., Li P.E., Chain P.S., Junier P. Under-detection of endospore-forming Firmicutes in metagenomic data. Computational and Structural Bio-technology Journal, 2015; 13: 299-306.
- Pinard R., de Winter A., Sarkis G.J., Gerstein M.B., Tartaro K.R., Plant R.N., Egholm M., Rothberg J.M., Leamon J.H. Assessment of whole genome amplification-induced bias through high-throughput, massively parallel whole genome sequencing. BMC Genomics, 2006; 7(1): 216.
- Wunderlin T., Junier T., Roussel Delif L., Jeanneret N., Junier P. Stage 0 sporulation gene A as a molecular marker to study diversity of endospore forming Firmicutes. Environmental Microbiology Reports, 2013; 5(6): 911-24.
© The Author(s) 2019. Open Access. This article is distributed under the terms of the Creative Commons Attribution 4.0 International License which permits unrestricted use, sharing, distribution, and reproduction in any medium, provided you give appropriate credit to the original author(s) and the source, provide a link to the Creative Commons license, and indicate if changes were made.