


ISSN: 0973-7510
E-ISSN: 2581-690X
Antimicrobial resistance (AMR) in bacterial pathogens has emerged as a challenge in health care settings resulting in high rates of morbidity and mortality. The aim of the present study was to describe the trends and burden of AMR in a tertiary care hospital. A retrospective observational study was undertaken from October 2018 to March 2021 in a clinical microbiology laboratory where local priority pathogens and their antimicrobial resistance patterns were analyzed. Organism identification and antimicrobial susceptibility testing were performed as per Clinical and Laboratory Standards Institute guidelines. Out of 9948 isolates, Enterobacteriaceae (58%) were mostly isolated followed by Staphylococci (18.6%), Non-fermenting gram negative bacilli (NFGNB) (13.7%), and Enterococci (8.4%) respectively. Highest isolation was from inpatient department (61.3%); 31.5% from outpatient, and 7.2 % from intensive care units. Klebsiella pneumoniae (26.9%) was most isolated organism, mostly from respiratory samples; Escherichia coli was isolated mostly from urine (40.7%). Almost half of the Enterobacteriaceae isolates were extended spectrum beta-lactamase producers while >50% of Enterobacteriaceae and NFGNB isolates were resistant to one or more Carbapenems. Frequency of Methicillin resistant Staphylococcus aureus was 44.7% , Vancomycin resistant Enterococci was 1.2%. A rising trend of resistance to cephalosporins and carbapenems along with fluoroquinolones was observed. Our study has witnessed a high prevalence of Gram negative pathogens with increasing resistance to commonly applied antimicrobials during the surveillance period which can act as a guiding tool in devising local antimicrobial priorities, antibiotic policy, and proper antimicrobial prescribing practices.
Antimicrobial Resistance, Carbapenem Resistant, Methicillin Resistant, Surveillance, Vancomycin Resistant Enterococcus, Yearly Trend
Antimicrobial resistance (AMR) in bacterial pathogens has emerged as a challenge in health care settings resulting in high rates of morbidity and mortality worldwide.1 Globally about 700,000 people die every year due to AMR related illness; death toll will reach an estimated 10 million by 2050.2 The emergence and rapid spread of drug-resistant pathogens especially of multidrug resistant (MDR) and pandrug-resistant bacteria (also known as “superbugs”) has caused infections which are not responding to treatment with existing antimicrobial agents.3 Due to increasing use of broad-spectrum antibiotics like Carbapenems which are usually reserved for treatment of MDR infections, resistance among Gram-negative bacteria has become a global problem.4 Instances of Colistin resistance have also been reported in many countries, for which no effective antibiotic treatment is available at present.3 In 2014, the World Health Organization (WHO) declared AMR as a global health security threat and emphasized the urgent need of reliable surveillance data for formulating strategies and actions to contain AMR.5 Due to huge burden of infectious diseases in India, our country is one of the largest consumers of antibiotics in the world.6 The southern and northern regions of India has witnessed high prevalence of carbapenem-resistant bacterial infections.7 On the other hand, the states of Mizoram, Tripura, Nagaland, and Meghalaya of Northeast India reported below 5% prevalence of carbapenem resistance by virtue of less developed healthcare and lower amounts of carbapenem use.8
Due to lack of nationwide data on AMR, there was a limitation for intensive response against AMR in India.9 To overcome this deficiency and to collect nationwide representative data, Antimicrobial Resistance Surveillance & Research Network (AMRSN) was initiated by the Indian Council of Medical Research (ICMR), New Delhi in 2013.9 Under AMRSN,a hospital based or laboratory based surveillance system was established at major tertiary care centers of India to monitor the antimicrobial susceptibility trends of clinically important pathogen groups similar to the WHO priority pathogen list released in 2017.10 Being a part of AMRSN network since 2018, our laboratory has been monitoring, generating and disseminating AMR data besides developing the local antibiotic policy and infection prevention and control protocol. Since no published literature is available describing the AMR trends in Assam till date, this study was performed to describe the trends and burden of AMR and to provide useful information to clinicians and policy makers.
Study Design
A retrospective observational study was conducted from October 2018 to March 2021 in the Microbiology laboratory of Assam Medical College & Hospital, Dibrugarh, a National Accreditation Board for Testing and Calibration Laboratories (NABL) accredited laboratory of a 1500 bedded government medical college & hospital of Northeast India. Being a regional centre of the ongoing Antimicrobial resistance surveillance network (AMRSN) of Indian Council of Medical Research (ICMR), the necessary approval from institutional ethics committee was obtained(No. AMC/EC/1599 dated 24/07/2020). Demographic data and clinical information such as age, gender, admission date, date of specimen collection, type of specimen, hospital location, clinical history, associated co-morbidity and the method of culture identification and interpretation of antimicrobial susceptibility testing and molecular assay for drug resistant genes were entered into the ICMR’s Antimicrobial Resistant Surveillance System (i-AMRSS) tool, designed by ICMR, India.9 Types of specimen group are –
- Blood (includes Blood-central catheter, blood-peripheral and Blood-peripheral catheter);
- LRT (Lower respiratory tract) includes: BAL (broncho-alveolar lavage), sputum, lung aspirate, endotracheal aspirate (ETA) and lobectomy tissue (Lung tissue).
- Superficial infection includes: SST (Skin and soft tissue), Pus/exudate, Wound swab, superficial biopsy and superficial tissue.
- Deep infection includes: Abscess aspirate, Pus aspirate, Deep biopsy and Deep tissue.
- SS (sterile sites) includes: Fluid from sterile spaces, Abdominal fluid, Intracostal tube fluid, Pancreatic drain fluid, Pericardial fluid, Peritoneal fluid and Pleural fluid.
Surveillance of antimicrobial resistance in clinical isolates
All significant clinical isolates i.e. pure culture isolates or isolates recovered from successive culture belonging to the following bacterial groups are included in the surveillance- members of the family Enterobacteriaceae, Non-fermenting Gram negative bacilli (NFGNB)-Pseudomonas aeruginosa and Acinetobacter baumannii, Staphylococcus aureus, Enterococcus species, enteric pathogens including Shigella species, Salmonella species, and Vibrio species.
Inclusion criteria
- All significant bacterial isolates from clinically defined infections.
- For multiple isolates of a single species from the same patient, only the first isolate has been included.
- For outbreak, only one strain (outbreak strain) has been included in surveillance. Outbreak strain is defined as a group of isolates that were both epidemiologically related and thus presumed to be clonally related.11
Exclusion criteria
- Bacterial isolates from colonization without infection. Colonization is defined as presence of microorganism on/in a host, with growth and multiplication of the organism, but without causing any disease.12
- For outbreaks, all except the index strain(i.e. bacterial strain isolated from the first documented patient of an outbreak)were excluded from surveillance listing.
- For multiple isolates of a single species from the same patient, all isolates except the first isolate were excluded.
The isolates have been classified as outpatient-isolated from patients attending Outpatient department (OPD)s, inpatient-isolated from patients admitted in wards and high dependency areas like Intensive Care Unit (ICUs) and high dependency unit HDUs. For every isolate, the following information was noted: study number, age, gender, clinical diagnosis, OPD/ward/ICU, date of collection of specimen, and nature of specimen (blood, pus, urine, etc). For the ICU cases, the data of admission and the antibiotic therapy was also noted. All the collected data were entered into the i-AMRSS tool of ICMR, Govt. of India and analysis could be done as permissible to regional centre of the AMRSN.
Microbiological identification
Routine microbiological investigations were performed and species identification was performed using standard biochemical reactions or Vitek2 automated system (Biomerieux) method using standard operating procedures Bacteriology of ICMR-AMRSN.
Antimicrobial susceptibility testing
Antimicrobial susceptibility testing was performed against those antimicrobial agents recommended by AMRSN, ICMR, also as per need of institutional antibiotic policy by Kirby Bauer disc diffusion method on all clinical isolates and/or minimum inhibitory concentration (MIC) method using Vitek2 automated system (Biomerieux) as per recent CLSI guidelines.13,14 The MIC of Colistin and Vancomycin was detected using Broth Dilution method as per CLSI criteria.13,14 The antimicrobial susceptibility testing generally covered the following antimicrobials: Amikacin (30 µg), Cefotaxime (30 µg), Ceftazidime (30 µg), Cefepime (30 µg), Cefazolin (30 µg), Ciprofloxacin (5 µg), Levofloxacin (5 µg), Ertapenem (10 µg), Imipenem (10 µg), Meropenem (10 µg), Piperacillin Tazobactam (100/10 µg), Nitrofurantoin (300 µg), Trimethoprim-sulfamethoxazole (1.25/23.75 µg), Fosfomycin (200 µg), Minocycline (30 µg), Tobramycin (10 µg), Colistin (MIC), Chloramphenicol (30 µg), Ampicillin (10 µg), Cefixime (5 µg), Cefoxitin (30 µg), Clindamycin (2 µg), Erythromycin (15 µg), Linezolid (30 µg), Doxycycline ( 30 µg), Mupirocin high level (200 µg), Penicillin (10 µg), High Level Gentamicin (120 µg), Teicoplanin (30 µg) and Vancomycin (MIC). The confirmation of Extended-spectrum beta-lactamase (ESBL) producer, Methicillin resistant Staphylococcus aureus (MRSA), Vancomycin Resistant Enterococcus (VRE) was done as per the CLSI guidelines.13,14 Antimicrobial susceptibility test results of the pathogens isolated during the study period were analyzed; isolates found resistant and intermediate against an antibiotic was considered non-susceptible.
Molecular characterization of drug resistant genes
Production of carbapenemase, encoded by four classes of -lactamase- viz. class A carbapenemases such as Klebsiella pneumoniae carbapenemases (blaKPC), imipenem- hydrolyzing b-lactamase (blaIMI) and Serratia marcescens enzyme (blaSME). Class B Metallo-beta-lactamases such as New Delhi Metallo-beta-lactamases (blaNDM), verona integron metallo-beta-lactamases (blaVIM), imipenemase (blaIMP), German imipenemase (bla GIM-1) and Sao Paulo Metallo-beta-lactamases (blaSPM) class D carbapenemases -oxacillinase-group (blaOXA-48, OXA- 181, OXA-204, OXA-162, OXA-23, OXA-24) and a rare class C -lactamase- cephamycin-hydrolyzing b-lactamase (blaCMY-10).15,16 Polymerase chain reaction (PCR) assay to detect gene targets for mechanisms of resistance in Pseudomonas aeruginosa and Acinetobacter baumannii was performed following standard operating procedure bacteriology of ICMR-AMRSN.17
Quality Control
The quality control strains used for disc diffusion method were Escherichia coli American Type Culture Collection (ATCC) 25922, Enterococcus faecalis ATCC 29212 and for Vitek2 automated method Escherichia coli ATCC 25922, Pseudomonas aeruginosa ATCC 27853, Enterococcus faecalis ATCC 29212, Staphylococcus aureus ATCC 29213 as per CLSI documents.13,14 Our laboratory conducts internal quality control and routinely participates in External Quality Assurance Systems (EQAS) – bacterial identification and AST conducted by Nodal Centers assigned by ICMR as well as national EQAS conducted by Indian Association of Medical Microbiologists (IAMM) collaborating centre Sir Ganga Ram Hospital, New Delhi.
The data entry and analysis of different pathogens and their antimicrobial resistance trend was performed using i-AMRSS tool, designed by ICMR, India.9 The collected data are based on patient’s age, gender, locality, unit/ward, source of sample & antibiotic susceptibility pattern.
A total of 9948 culture isolates were recovered during the period of analysis. Location wise distribution showed most isolates (61.3%; n=6098) were from wards; 31.5% (n=3133) isolates from OPD; rest (7.2 %; n=717 nos.) were recovered from ICUs. Isolates from community acquired infection recovered were 31.3 % (n=3119) while 31.6% (n=3146) were isolated from healthcare associated infection. Rest (n=3683) were of unknown infection type. Our study shows dominance of Gram Negative (GN) pathogen (71%, n=6976); contributed by urine samples (33%); Skin and soft tissue samples (29%); respiratory samples (25%) and sterile body fluids including Blood (9.6%).
Sample type and bacterial isolates
Highest isolation of 3535 (35.5 %) were from urine sample followed by superficial infection samples (n=2087, 21%) and blood (n= 942, 9.5%). (Table 1) When observed the frequency of isolates; most common isolate group was Enterobacteriaceae (except Salmonella) (58%; n=5772); followed by Staphylococci (18.6 %; n=1853); Non Fermenting Gram Negative Bacilli (NFGNB) (13.7 %; n=1360); Enterococci (8.4 %; n=838); Fungi (0.9%; n=88) and fecal isolates(i.e. isolates obtained from stool/rectal swab culture of the patients with acute gastro-enteritis) (0.3 %; n=34) (Table 1).
Table (1):
Isolation rates of different pathogens from different specimen.
| Isolate | Total n=9948 |
Blood n=942 |
Urine n=3535 |
LRT n=1887 |
Superficial Infection n=2087 | Deep Infection n=877 | CSF n=26 |
SS n=100 |
Faeces n=35 |
Others n=459 |
|||||||||||
|---|---|---|---|---|---|---|---|---|---|---|---|---|---|---|---|---|---|---|---|---|---|
| n | % | n | % | n | % | n | % | n | % | n | % | n | % | n | % | n | % | n | % | ||
| No. culture positive | 9948 (100) | 100 | 942 (100) | 9.5 | 3535 (100) | 35.5 | 1887 (100) | 19 | 2087 (100) | 21 | 877 (100) | 8.8 | 26 (100) | 0.3 | 100 (100) | 1 | 35 (100) | 0.4 | 459 (100) | 4.6 | |
| Ward (non ICU) including HDU | 6098 (61.3) | 100 | 595 (63.2) | 9.8 | 1909 (54) | 31.3 | 945 (50.1) | 15.5 | 1660 (79.5) | 27.2 | 634 (72.3) | 10.4 | 19 (73.1) | 0.3 | 81 (81) | 1.3 | 24 (68.6) | 0.4 | 231 (50.3) | 3.8 | |
| OPD | 3133 (31.5) | 100 | 39
(4.1) |
1.2 | 1468 (41.5) | 46.9 | 743 (39.4) | 23.7 | 416 (19.9) | 13.3 | 231 (26.3) | 7.4 | 2 (7.7) | 0.1 | 12 (12) | 0.4 | 11 (31.4) | 0.4 | 211 (46) | 6.7 | |
| ICU | 717 (7.2) | 100 | 308 (32.7) | 43 | 158 (4.5) | 22 | 199 (10.5) | 27.8 | 11 (0.5) | 1.5 | 12 (1.4) | 1.7 | 5 (19.2) | 0.7 | 7 (7) | 1 | 0 (0) | 0 | 17 (3.7) | 2.4 | |
| Enterobacteriaceae | 5772 (58) | 100 | 284 (30.1) | 4.9 | 2206 (62.4) | 38.2 | 1358 (72) | 23.5 | 1184 (56.7) | 20.5 | 419 (47.8) | 7.3 | 4 (15.4) | 0.1 | 60 (60) | 1 | 1 (2.9) | 0 | 256 (55.8) | 4.4 | |
| Staphylococci | 1853 (18.6) | 100 | 272 (28.9) | 14.7 | 486 (13.7) | 26.2 | 169 (9) | 9.1 | 442 (21.2) | 23.9 | 333 (38) | 18 | 3 (11.5) | 0.2 | 15 (15) | 0.8 | 0 (0) | 0 | 133 (29) | 7.2 | |
| NFGNB | 1360 (13.7) | 100 | 272 (28.9) | 20 | 134 (3.8) | 9.9 | 345 (18.3) | 25.4 | 414 (19.8) | 30.4 | 101 (11.5) | 7.4 | 18 (69.2) | 1.3 | 18 (18) | 1.3 | 0 (0) | 0 | 58 (12.6) | 4.3 | |
| Enterococci | 838 (8.4) | 100 | 105 (11.1) | 12.5 | 641 (18.1) | 76.5 | 4
(0.2) |
0.5 | 46 (2.2) | 5.5 | 24 (2.7) | 2.9 | 1 (3.8) | 0.1 | 6 (6) | 0.7 | 0 (0) | 0 | 11 (2.4) | 1.3 | |
| Fungi | 88 (0.9) | 100 | 8 (0.8) | 9.1 | 67 (1.9) | 76.1 | 11 (0.6) | 12.5 | 0 (0) | 0 | 0 (0) | 0 | 0 (0) | 0 | 1 (1) | 1.1 | 0 (0) | 0 | 1 (0.2) | 1.1 | |
| Faecal Isolates | 34 (0.3) | 100 | 0 (0) | 0 | 0 (0) | 0 | 0 (0) | 0 | 0 (0) | 0 | 0 (0) | 0 | 0 (0) | 0 | 0 (0) | 0 | 34 (97.1) | 100 | 0 (0) | 0 | |
| Invasive Salmonella | 0 (0) | 0 | 0 (0) | 0 | 0 (0) | 0 | 0 (0) | 0 | 0 (0) | 0 | 0 (0) | 0 | 0 (0) | 0 | 0 (0) | 0 | 0 (0) | 0 | 0 (0) | 0 | |
Notes:
1. Percentages are out of particular specimen (column).
2. Percentages inside brackets with culture positive are out of culture positive in respective columns.
Among the Enterobacteriaceae, Klebsiella species (spp.) was the predominant isolate (n= 2673; 26.9 %) followed by Escherichia coli (n= 2237; 22.5 %). Klebsiella spp. was mostly isolated from LRT specimen (n=1062; 56.3%), whereas Escherichia coli was isolated mostly from urine (n=1439; 40.7%). Almost similar isolation rate of Acinetobacter spp. (n=687; 6.9%) and Pseudomonas aeruginosa (n= 646; 6.5%) was observed among the NFGNB. Acinetobacter spp. mostly isolated from Blood and CSF (n= 231; 24.5% & n=8; 30.8% respectively) while Pseudomonas aeruginosa from CSF (n=8; 30.8%). Staphylococcus aureus (n= 1786; 18%) was mostly isolated from urine (n=485; 27.2%) followed by Superficial infection (n=441; 24.7%) and deep infection (n=333; 18.6%). Enterococcus faecium (n=617; 6.2%) was commonest among Enterococci which was mostly isolated from urine (n= 492; 79.7%). Almost all the fungal isolates was identified as Candida spp. (n=87; 0.9%); mostly isolated from urine (n=66; 75.9%).
Antimicrobial resistance patterns of Enterobacteriaceae
A substantially higher resistance rate was observed for Cephalosporin among Enterobacteriaceae isolates followed by resistance against Fluoroquinolones. Carbapenems also found resistant in an important fraction of Enterobacteriaceae isolates. (Table 2) Overall, 50% of Enterobacteriaceae isolates were resistant to 3rd generation cephalosporins due to ESBL production (1328/2237 of Escherichia coli and 1067/2673 of Klebsiella spp.).
Antimicrobial resistance patterns of NFGNB
Acinetobacter baumannii (n=550) isolates showed a higher resistant rate mostly to Cephalosporin, followed by Piperacillin-Tazobactam and carbapenems. (Table 2) Pseudomonas aeruginosa (n=590) isolates showed comparatively better susceptibility rate than other isolates.
Table (2):
Antimicrobial resistance pattern of Gram Negative Bacilli (Enterobacteriaceae & NFGNB) isolates.
| Antimicrobial agent |
Escherichia coli (n= 2237) | Klebsiella spp. (n= 2673) | Citrobacter spp. (n= 551) | Proteus spp. (n= 125) | Enterobacter spp. (n= 177) | Acinetobacter baumannii (n=687) | Pseudomonas aeruginosa (n=646) |
|---|---|---|---|---|---|---|---|
| R (%) | R (%) | R (%) | R (%) | R (%) | R (%) | R (%) | |
| Amikacin 30 µg | 44.6 | 42.1 | 47.7 | 47.0 | 47.1 | 66.5 | 32.5 |
| Cefotaxime 30 µg | 79.8 | 83.8 | 91.1 | 70.6 | 92.3 | ND | ND |
| Ceftazidime 30 µg | 85.1 | 71.6 | 85.7 | 54.0 | 85.0 | 86.7 | 46.4 |
| Cefepime 30 µg | ND | ND | ND | ND | ND | 83.2 | 44.4 |
| Cefazolin 30 µg | 73.7 | 71.9 | ND | 62.1 | ND | ND | ND |
| Ciprofloxacin 5 µg | 70.0 | 49.9 | 54.0 | 32.7 | 43.0 | ND | 31.1 |
| Levofloxacin 5 µg | 62.9 | 38.6 | 41.2 | 32.0 | 27.0 | 57.4 | 33.5 |
| Ertapenem 10 µg | 50.2 | 49.4 | 49.0 | 28.6 | 42.4 | ND | ND |
| Imipenem 10 µg | 52.2 | 53.1 | 58.1 | 53.0 | 68.0 | 74.2 | 37.8 |
| Meropenem 10 µg | 37.5 | 44.1 | 47.4 | 27.0 | 44.9 | 64.9 | 23.2 |
| Minocycline 30 µg | ND | ND | ND | ND | ND | 15.8 | ND |
| Piperacillin Tazobactam 100/10 µg | 51.6 | 56.1 | 54.0 | 32.7 | 65.4 | 77.6 | 33.0 |
| Nitrofurantoin 300 µg | 15.3 | 48.0 | 48.4 | 69.0 | 38.1 | ND | ND |
| Tobramycin 10 µg | ND | ND | ND | ND | ND | ND | 31.2 |
| Trimethoprim-sulfamethoxazole 1.25/23.75 µg | 59.3 | 53.3 | 53.0 | 62.1 | 42.9 | ND | ND |
| Fosfomycin 200 µg | 2.2 | 10.0 | 26.0 | 7.0 | 19.0 | ND | ND |
ND- Not done, R-Resistance
Carbapenem resistance in Gram negative isolates
Overall carbapenem resistance among Enterobacteriaceae isolates of this study was 58.8% while frequency among NFGNBs was 56.0%. The carbapenem resistant Acinetobacter baumannii, Escherichia coli, Klebsiella spp. and Pseudomonas aeruginosa isolates also showed higher resistance frequency to other antimicrobials viz. aminoglycosides, fluoroquinolones, cephalosporins, trimethoprim-sulfamethoxazole and Piperacillin-Tazobactam in comparison to carbapenem susceptible isolates. Colistin was found susceptible to all 261 nos. of gram negative isolates tested for MIC.
Resistance pattern of fecal isolates
The only fecal pathogen isolated was Shigella flexneri (n=31) during the study period. Both Nalidixic acid (96.7%) and Norfloxacin (93.5%) witnessed very high resistance frequency. Ampicillin (77.4%), Cotrimoxazole (64.5%), and Cefixime (43.3%) also showed higher resistance frequency.
Resistance patterns in Gram positive pathogens
The frequency of MRSA observed during the period of study was 44.7% (799 out of 1786 isolates). Vancomycin resistant Staphylococcus aureus was not found during this period of study. Higher frequency of resistance to all the antimicrobials was observed among the MRSA isolates in comparison to Methicillin Susceptible Staphylococcus aureus (MSSA) isolates. (Table 3) Among the Enterococci isolates, resistance frequency to Ampicillin, Ciprofloxacin, High level aminoglycoside (Gentamicin 120 µg) and Nitrofurantoin were higher in Enterococcus faecium isolates. Vancomycin resistant Enterococci were observed in 1.2 per cent (10 of 817) of isolates. (Table 3)
Table (3):
Antimicrobial resistance pattern of Gram positive cocci isolates from all specimen
| Antimicrobial agent | Staphylococcus aureus (n=1786) | MSSA (n=987) | MRSA (n=799) | Enterococcus faecalis (n=200) | Enterococcus faecium (n=617) |
|---|---|---|---|---|---|
| R (%) | R (%) | R (%) | R (%) | R (%) | |
| Cefoxitin 30 µg | 799 (44.7) | 0 (0) | 799 (100) | – | – |
| Ciprofloxacin 5 µg | 1139 (63.8) | 499 (50.6) | 640 (80.1) | 134 (67.4) | 538 (87.2) |
| Clindamycin 2 µg | 596 (33.4) | 220 (22.3) | 376 (47.1) | – | – |
| Erythromycin 15 µg | 1301 (72.8) | 600 (60.8) | 701 (87.7) | – | – |
| Linezolid 30 µg | 8 (0.4) | 3 (0.3) | 5 (0.6) | 1(0.5) | 11(1.6) |
| Mupirocin high level 200 µg | 306 (17.1) | 54 (5.5) | 252 (31.6) | – | – |
| Penicillin 10 µg | 1638 (91.6) | 845 (85.6) | 793 (99.2) | – | – |
| Tetracycline 30 µg | 192 (10.8) | 75 (7.6) | 117 (14.6) | – | – |
| Trimethoprim-sulfamethoxazole 1.25/23.75 µg | 547 (30.6) | 1196 (19.9) | 351 (43.9) | – | – |
| Nitrofurantoin 300 µg | – | – | – | 17/132* (12.9) | 209/492* (42.5) |
| Ampicillin 10 µg | – | – | – | 49(24.5) | 426 (69.0) |
| Fosfomycin 200 µg | – | – | – | 11/132* (8.30) | – |
| High Level Gentamicin 120 µg | – | – | – | 77(38.5) | 387(62.7) |
| Teicoplanin 30 µg | – | – | – | 1(0.5) | 5(0.8) |
MRSA: Methicillin Resistant Staphylococcus aureus; MSSA: Methicillin Susceptible Staphylococcus aureus; R-Resistance
Footnote: * Nitrofurantoin and Fosfomycin are tested only for urine isolates as per CLSI guidelines.
Susceptibility trend (2018-2020) in different groups of organism
Enterobacteriaceae isolates showed an increasing trend of susceptibility to Amikacin and decreasing trend to Piperacillin Tazobactam. (Figure 1) The NFGNB isolates showed a decreasing trend of susceptibility to carbapenems & cephalosporins. (Figure 2) The trend is almost static in Staphylococcus aureus isolates except for a slight decrease in susceptibility to Trimethoprim-sulfamethoxazole. (Figure 3) Enterococci isolates, on the other hand witnessed an increasing trend of susceptibility to Ampicillin and Ciprofloxacin over the years (Figure 4).


Figure 1. Yearly trend of susceptibility to Enterobacteriaceae isolates
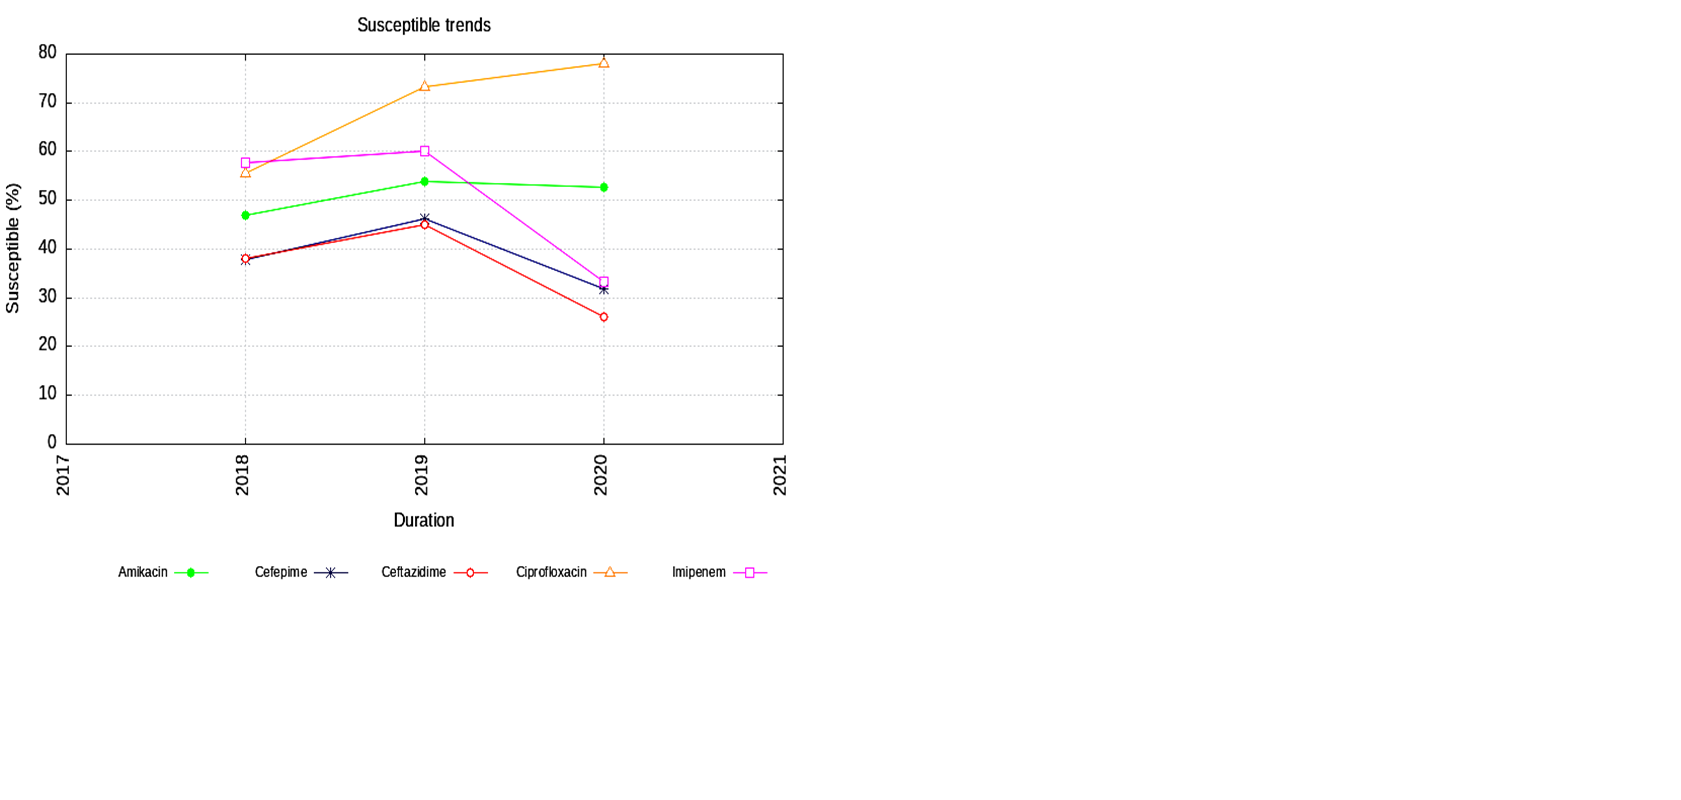
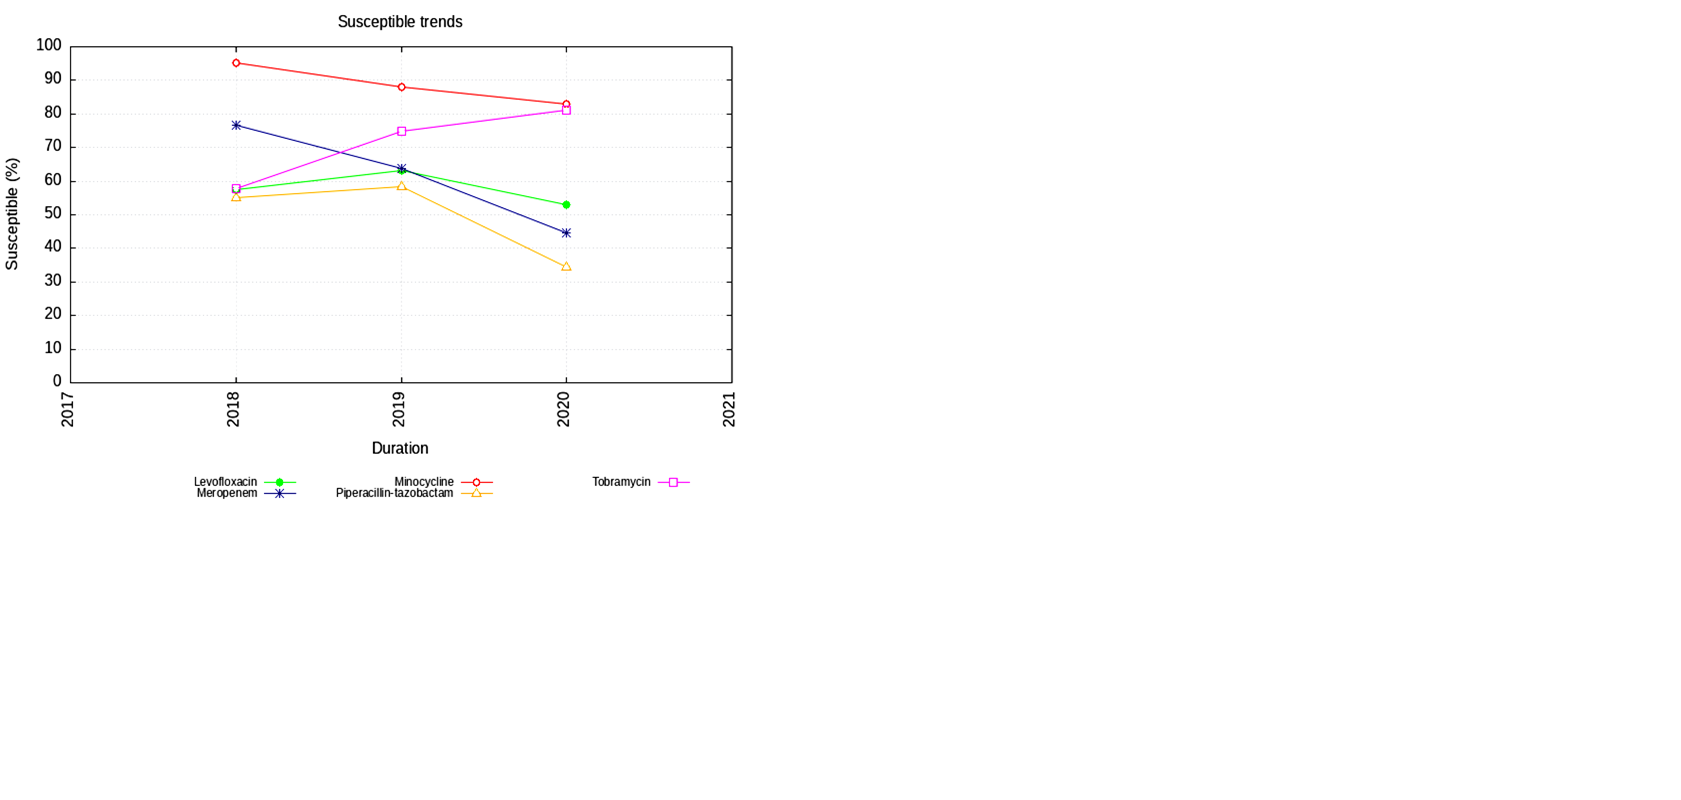
Figure 2. Yearly trend of susceptibility to NFGNB isolates


Figure 3. Yearly trend of susceptibility to Staphylococcus isolates
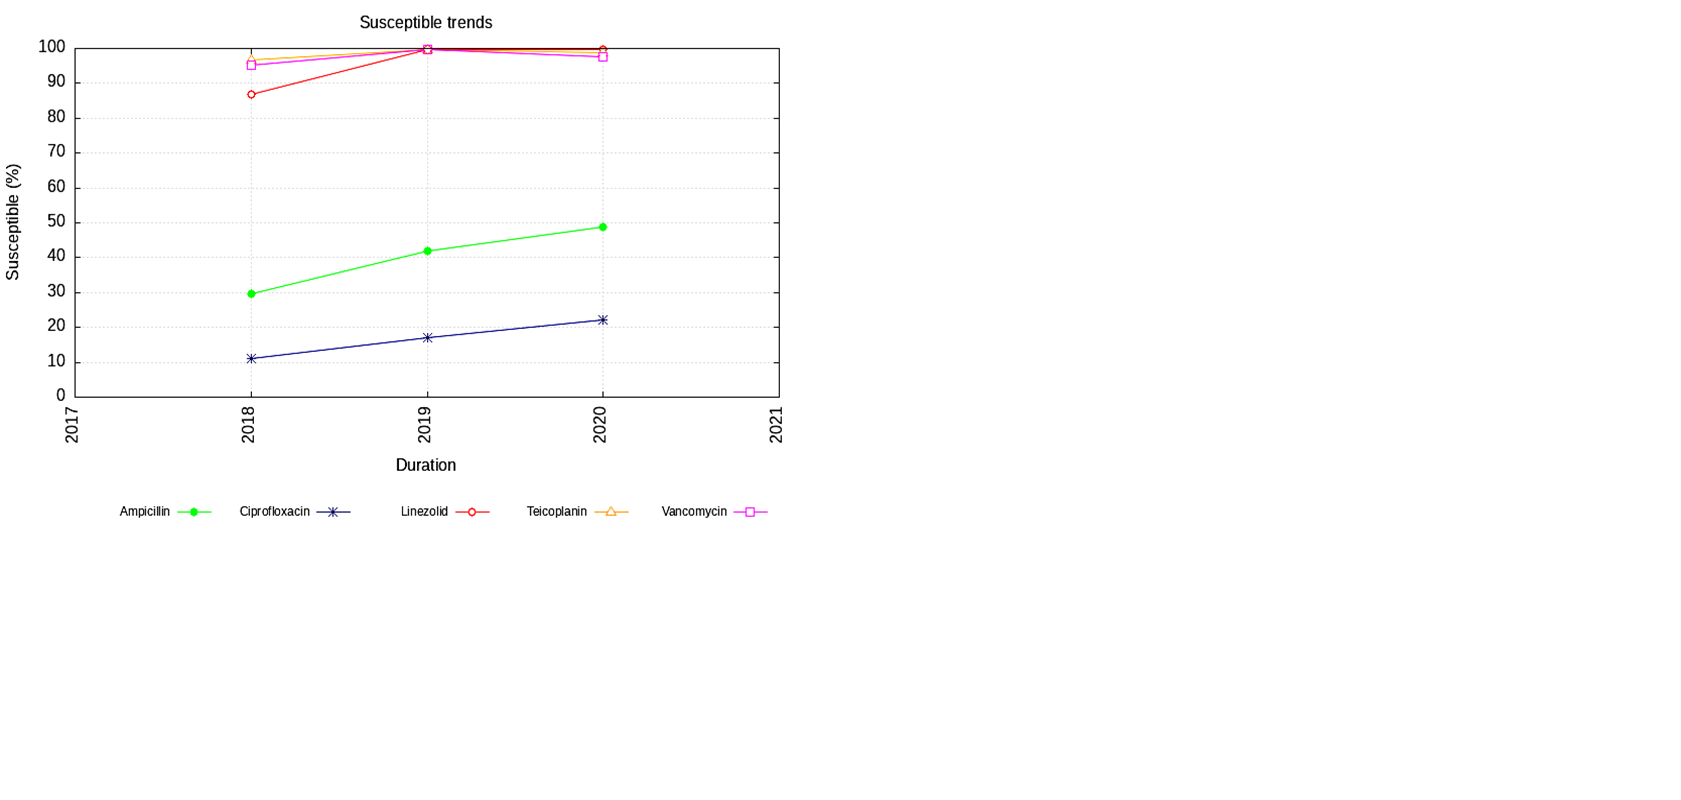
Figure 4. Yearly trend of susceptibility to Enterococci isolates
Distribution of Carbapenemase genes
During the study period one or more carbapenemase gene targets were detected in 79 (28.2 %) of the 280 study isolates using PCR (Table 4).
Table (4):
Distributions of carbapenemase genes detected in few isolates tested.
| Organisms (no. tested /Total isolate) | Year of isolation | Class B Carbapenamases (MβLs) gene target | Class B Carbapenamases gene target | Combination gene | ||||||||||
|---|---|---|---|---|---|---|---|---|---|---|---|---|---|---|
| SPM | IMP | VIM | NDM | VIM + NDM | OXA 23 | OXA 24 | OXA 58 | OXA 51 | OXA 23 + NDM | OXA-23 + PER | OXA-23 + TEM | OXA-23 + NDM + TEM | ||
| Pseudomonas aeruginosa (1/40) | 2021 | 0 | 0 | 0 | 1 | – | – | – | – | – | – | – | – | – |
| Pseudomonas aeruginosa (6/67) | 2020 | 0 | 0 | 3 | 1 | – | – | – | – | – | – | – | – | – |
| Pseudomonas aeruginosa (4/45) | 2019 | 0 | 0 | 0 | 3 | 1 | – | – | – | – | – | – | – | – |
| Acinetobacter baumannii (22/62) | 2021 | 0 | 0 | 0 | 0 | 0 | 4 | 0 | 0 | 0 | 9 | 5 | 4 | 0 |
| Acinetobacter baumannii (24/40) | 2020 | 0 | 0 | 0 | 0 | 0 | 9 | 0 | 0 | 0 | 0 | 0 | 0 | 0 |
| Acinetobacter baumannii (22/26) | 2019 | 0 | 0 | 0 | 1 | 0 | 7 | 0 | 0 | 22 | 2 | 9 | 2 | 1 |
Various AMR surveillance studies in India have been providing key information about antimicrobial resistance in various parts of the country.9,18-20 The present study is first of its kind in the Eastern Assam region of North Eastern India; has been performing AMR surveillance since October, 2018. Our study has witnessed an increasing prevalence of Gram Negative pathogens with increasing resistance to Cephalosporin, Fluoroquinolones, and Carbapenem during the surveillance period. The finding of gram negative dominance has also played a vital role in formulating the institutional antibiotic policy.
WHO in 2017 classified Acinetobacter baumannii, Pseudomonas aeruginosa, Escherichia coli, Klebsiella spp., Enterobacter spp. etc as critical priority pathogen in their guidance document; mentioned carbapenem resistance worldwide and in Indian sub continent for Acinetobacter baumannii (91% &>50%) and Pseudomonas aeruginosa (82% & 31-50%) respectively. Report of WHO also showed carbapenem resistance in Escherichia coli (55%), Klebsiella spp. (70%), and Enterobacter spp. (59%).10 The non-susceptibility pattern of the present study is compared with some earlier studies in Table 5.
Table (5):
Comparison of present study findings with some earlier studies.
| Study (Surveillance period) | Antibiotic group | Non susceptibility per cent organism wise | |||
|---|---|---|---|---|---|
| Escherichia coli | Klebsiella species | Acinetobacter species | Pseudomonas aeruginosa | ||
| Present study (2018-2021) | Third generation Cephalosporin | 79-85 | 83 | 83-86 | 44-46 |
| Walia et al.[9] (2016-2018) | 75-80 | 65-77 | 73-87 | 40 | |
| Mogasale et al.[18] (January 2014- October 2019) |
72 | 63 | |||
| Thacker, N. et al. [19] (January–December 2013 ) |
24 (Enterobacteriaceae) | ||||
| Present study (2018-2021) | Fluoroquinolones | 70 | 50 | 57 | 33 |
| Walia et al.[9] (2016-2018) | 75-80 | 65-77 | 73-87 | 40 | |
| Present study (2018-2021) | Carbapenems | 52 | 53 | 74 | 37 |
| Walia et al.[9] (2016-2018) | 15-25 | 40-50 | 69-80 | 30-32 | |
| Mogasale et al.[18] (January 2014- October 2019) |
46 (Enterobacteriaceae) | 12 | 5 | ||
| Thacker, N. et al [19] (January–December 2013 ) |
27 (Enterobacteriaceae) | 15 | |||
| Veeraraghavan, B. et al.[20] (2014–2016) | 12 | 39 | |||
An increasing trend (2018 onwards) of non susceptibility percentage of third generation cephalosporin and carbapenem has been observed in this study, while that of Fluoroquinolones is on the reverse side. Veeraraghavan B et al. reported an increasing trend of AMR among gram negative isolates but prevalence of carbapenem resistance in Klebsiella spp.(39%) and Escherichia coli (12%) were lower than the current study.20 A lower resistance level in Enterobacteriaceae isolates was earlier reported by Thacker N et al.(January –December 2013) from Mumbai (24% ESBL producer and 27% as carbapenem resistant).19 A recent study from Mizoram, North East Indian state reported as low as 11.3% carbapenem resistance.21 Another recent study from southern part of Assam reported 26.2% of ESBL positive Escherichia coli urine isolate and 12.6% carbapenemase producers which is considerably lower than our finding.22
Though isolates are less in number; a very high frequency of Fluoroquinolones resistance (>95 per cent) was observed among the Shigella species in this study. Mogasale et al. from South India also reported a high frequency of Fluoroquinolones resistance in Shigella species (75 per cent).18
Among the Gram positive pathogens, higher frequency (44.7%) of Methicillin resistant Staphylococcus aureus(MRSA) is observed in comparison to an earlier study in 2016-17 (35.3%) reported by Walia K et al.9 The present study is concordant with their study in non-susceptibility of Staphylococcus aureus isolates to Penicillin (91% vs 93% respectively). But Ciprofloxacin non-susceptibility is in decreasing trend (63% vs 79%). Mogasale et al. from South India reported 53% Methicillin resistant Staphylococcus aureus in their study which is higher than the present study; also reported 1.72 per cent Vancomycin resistant Staphylococcus aureus (VSA).18 VSA was not detected in the present study.
Vancomycin resistant Enterococci (VRE) isolates were relatively less in our study compared to those reported by Walia K et al.9 & Mogasale et al.18 (1.2 per cent, 11.9 per cent & 13.3 per cent respectively). VRE infection in hospital settings is a threat- the source due to cross contamination among patients through health care workers and ICU patient with VRE colonized in gut.23
Limitations
- Molecular characterization of all drug resistant genes could not be reported in detail as only few isolates were tested.
- About AMR pattern of bacterial isolates from community acquired and hospital acquired infections could not be commented as the archived data are impermissible due to the ongoing surveillance program of AMRSN.
- AMR pattern of fungal isolates could not be analyzed as number of isolates of each organism was less (n= <30); which can be addressed in a phased manner of coming period of AMR surveillance.
In conclusion, the leading pathogens Escherichia coli, Klebsiella species, Acinetobacter baumannii, and Methicillin-resistant Staphylococcus aureus have high AMR in this region with an increasing trend of high level of resistance towards third generation cephalosporins, and carbapenems. The regional AMR data provided herein are of great importance to policy makers in making informed decisions for the treatment of bacterial infections and developing appropriate antibiotics prescription guidelines to curb the unnecessary use of broad-spectrum antibiotics, thereby slowing down the rapidly increasing trend of AMR and even multi-drug resistance.
ACKNOWLEDGMENTS
The authors sincerely acknowledge Indian Council of Medical Research, New Delhi, India, for providing the platform to carry out this study. Authors also acknowledge Prof. (Dr.) Sanjeeb Kakati, Principal, Assam Medical College, Dibrugarh for his continued support during the study, and Mr. Rajib Bordoloi, Miss Sewali Thakuria, Mrs. Rumi Basumatary & Mrs. Luna for providing technical support during the study.
CONFLICT OF INTEREST
The authors declare that there is no conflict of interest.
AUTHORS’ CONTRIBUTION
All authors listed have made a substantial, direct and intellectual contribution to the work, and approved it for publication.
FUNDING
This work was supported by Indian Council of Medical Research, New Delhi, India, with grant number AMR/93/RC/2017-ECD-II Dated 26.03.2018.
DATA AVAILABILITY
All datasets generated or analyzed during this study are included in the manuscript.
ETHICS STATEMENT
This study was approved by the Institutional Ethics Committee, Assam Medical College, Dibrugarh, India, with reference No. AMC/EC/1599 dated 24/07/2020.
- Leptihn S. Welcome back to the pre-penicillin era. Why we desperately need new strategies in the battle against bacterial pathogens. Infect Microbes Dis. 2019;1(2):33.
Crossref - Adeyi OO, Baris E, Jonas OB, et al. The World Bank. 2017:1-172. Report No.: 114679. http://documents.worldbank.org/curated/en/323311493396993758/final-report
- World Health Organization. Antimicrobial resistance. World Health Organization. 2020. https: //apps.who.int/Antimicrobial resistance
- Meletis G. Carbapenem resistance: overview of the problem and future perspectives. Ther Adv Infect Dis. 2016;3(1):15-21.
Crossref - World Health Organization. Antimicrobial resistance: global report on surveillance. World Health Organization. 2014. https://apps.who.int/iris/handle/10665/112642).
- Laxminarayan R, Chaudhury RR. Antibiotic resistance in India: drivers and opportunities for action. PLoS Med. 2016;13(3):e1001974.
Crossref - Manohar P, Shanthini T, Ayyanar R, et al. The distribution of carbapenem-and colistin-resistance in Gram-negative bacteria from the Tamil Nadu region in India. J Med Microbiol. 2017;66(7):874-883.
Crossref - Lalhmangaihzuali FE. Z, Varte Z, Laldinmawii G. Antibiotic resistance pattern of uropathogens in urinary tract infections in children at State Referral Hospital, Falkawn, Mizoram, India. Int J Contemp Pediatr. 2018;5(6):2108.
Crossref - Walia K, Madhumathi J, Veeraraghavan B, et al. Establishing antimicrobial resistance surveillance & research network in India: journey so far. Indian J Med Res. 2019;149(2):164.
Crossref - World Health Organization. Prioritization of pathogens to guide discovery, research and development of new antibiotics for drug-resistant bacterial infections, including tuberculosis. World Health Organization. 2017. https://www.who.int/publications/i/item/WHO-EMP-IAU-2017.12
- Tenover FC, Arbeit RD, Goering RV, et al. Interpreting chromosomal DNA restriction patterns produced by pulsed- field gel electrophoresis: Criteria for bacterial strain typing. J Clin Microbiol. 1995;33(9):2233-2239.
Crossref - Dani A. Colonization and infection. Cent Eur J Urol. 2014;67(1):86.
Crossref - Wayne PA. Clinical and Laboratory Standards Institute: Performance standards for antimicrobial susceptibility testing: 20th informational supplement. CLSI document M100-S24. 2018.
- Wayne PA. Clinical and Laboratory Standards Institute. Performance Standards for Antimicrobial Susceptibility Testing; Twenty-Fourth Informational Supplement. CLSI document M100-S24. 2019.
- Nordmann P, Naas T, Poirel L. Global spread of carbapenemase-producing Enterobacteriaceae. Emerg Infect Dis. 2011;17(10):1791.
Crossref - Queenan AM, Bush K. Carbapenemases: the versatile b-lactamases. Clin Microbiol Rev. 2007;20(3):440-458.
Crossref - Indian Council of Medical Research, Standard Operating Procedures Bacteriology. Antimicrobial Resistance Surveillance and Research Network. New Delhi. 2019; 2nd Edition. https://main.icmr.nic.in/sites/default/files/guidelines/Bacteriology_SOP_2nd_Ed_2019.pdf.
- Mogasale VV, Saldanha P, Pai V, Rekha PD, Mogasale V. A descriptive analysis of antimicrobial resistance patterns of WHO priority pathogens isolated in children from a tertiary care hospital in India. Sci Rep. 20214;11(1):5116.
Crossref - Thacker N, Pereira N, Banavali SD, et al. Epidemiology of blood stream infections in pediatric patients at a tertiary care cancer centre. Indian J Cancer. 2014;51(4):438-441.
Crossref - Veeraraghavan B, Jesudason MR, Prakasah JA, et al. Antimicrobial susceptibility profiles of gram-negative bacteria causing infections collected across India during 2014-2016: Study for monitoring antimicrobial resistance trend report. Indian J Med Microbiol. 2018;36(1):32-36.
Crossref - Ralte VS, Loganathan A, Manohar P, et al. The Emergence of Carbapenem-Resistant Gram-Negative Bacteria in Mizoram, Northeast India. Microbiol Res. 2022;13(3):342-349.
Crossref - Paul D, Anto N, Bhardwaj M, et al. Antimicrobial resistance in patients with suspected urinary tract infections in primary care in Assam, India. JAC-Antimicrobial Resistance. 2021;3(4):dlab164.
Crossref - Amberpet R, Sistla S, Parija SC, Thabah MM. Screening for intestinal colonization with vancomycin resistant enterococci and associated risk factors among patients admitted to an adult intensive care unit of a large teaching hospital. J Clin Diagn Res. 2016;10(9):DC06.
Crossref
© The Author(s) 2023. Open Access. This article is distributed under the terms of the Creative Commons Attribution 4.0 International License which permits unrestricted use, sharing, distribution, and reproduction in any medium, provided you give appropriate credit to the original author(s) and the source, provide a link to the Creative Commons license, and indicate if changes were made.