


ISSN: 0973-7510
E-ISSN: 2581-690X
The degradation of maxillofacial prosthetic elastomers that occur throughout life service is usually responsible for the replacement of the prosthesis. The aim of this study was to evaluate the effect of adding different concentrations of 2mm length polyester fibers on the tensile strength, elongation percentage, tear strength, shore A hardness and surface roughness of A-2186 RTV silicone elastomer. 120 samples were fabricated by the addition of (0.25% and 0.5%) by weight of 2 mm length polyester fibers to A-2186 platinum RTV silicone elastomer. The samples were divided into four groups, each group containing 30 samples according to the conducted tests except for the elongation percentage test which was measured concurrently with the tensile strength test. The 30 samples of each test was subdivided into 10 samples for control groups (without addition of polyester fibers),10 samples of 0.25% by weight polyester fiber/silicone group and 10 samples of (0.5%) by weight polyester fibers/silicone group. The addition of (0.25%) and (0.5%) by weight of polyester fibers to A-2186 maxillofacial elastomer resulted in significant difference in the mean values of tensile strength (Pd”0.05) for 0.5% by wt. group and non-significant difference at 0.25% group when compared to control group. However; elongation percentage for both concentrations 0.25% and 0.5% by wt. show significant difference after addition, the tear strength results showed highly significant difference between all tested groups. Surface roughness and shore A hardness on the other hand show highly significant difference (Pd”0.01) of mean values for both 0.25%, 0.5% by wt. concentrations. Incorporation of 0.25% by wt. of 2 mm polyester fibers improve some of mechanical properties and may result in an increase in the service life of the prosthesis.
Polyester fibers, Room Temperature, Silicone Elastomer.
Acquired and congenital defects of the face create a regrettable condition for an individual to lead an uncomfortable life and these individuals require rehabilitation using maxillofacial prosthesis to improve their quality and surface life1.
Rehabilitation of patients with congenital and acquired maxillofacial defects has always considered as an enigma for the prosthodontist. The nature of the defects and the possibility of recurrence have made the prosthodontist to be in challenging situation. Restoration with prosthesis is less expensive when compared plastic and reconstructive surgery2. Rehabilitation goals are focused on the restorative, supportive, palliative and preventive aspects of treatment3.
Siloxane polymers, particularly high molecular weight poly (dimethylsiloxane), PDMS, exhibit some preferable properties, such as high flexibility and mobility of chains, biocompatibility, low chemical reactivity, ease of manipulation, and optical transparency that make them suitable for use in the rubber technology. However, PDMS-based rubbers generally have poor mechanical properties, in the absence of fillers, such as low tensile strength4, ].
A study by Gunay et al. (2008)6 reported improvement in the mechanical properties of A-2186 room temperature vulcanized (RTV) silicone elastomer especially the tear strength after being reinforced with tulle (Nylon).
The aim of this study was to evaluate the effect of adding 2mm length polyester fibers of different concentration by weight on the tensile strength, elongation percentage, tear strength, shore A hardness and surface roughness of A-2186 RTV silicone elastomer.
This study investigated some mechanical properties of A-2186 Platinum RTV silicone elastomer (Factor II Inc., Lakeside, AZ, USA) after addition of 2mm length and 0.017mm diameter polyester fibers of 0.25% and 0.5% by wt. concentrations were used for reinforcement. A specialized cutting of 4±0.05 mm, 2±0.05 mm and 6±0.05 mm thickness acrylic sheets (PT. Margacipta Wirasentosa, Indonesia) is performed by using a laser engraving cutting machine (Tengzhou Jiianda CNC Machine Co., Ltd, China) to prepare the mold parts. The depth of the mold cavity 2±0.05 mm or 6±0.05 thickness sheets corresponds to the thickness of the specimens to be fabricated for each conducted test while the 4±0.05 mm thickness sheets were used to make the bottom and cover parts7.
At first, a pilot study was conducted with 0.25%, 0.5% and 0.75% by weight of 2mm length polyester which were added to the silicone and compared with the 0% polyester (control group). The polyester fibers were first weighted by electronic digital balance followed by the addition of accurate weight of silicone (part A) to prevent dispersion of the fibers. The modified silicone was mixed by a vacuum mixer (Motova 100,BEGO company,Germany) for 10 minutes; the vacuum was turned off for the first three minutes to avoid suction of the fibers and then turned on for the rest of the 7 minutes at 360 rpm speed and a vacuum value of -10 bar. The silicone cross linker (part B) was added to the silicone base or the modified silicone (part A and polyester fibers) and mixed again in the vacuum mixer for 5 minutes to get a homogenous and free bubble mixture [8]. The results revealed that 0.25% and 0.5% by weight polyester fibers concentration by wt. improved the tensile and tear strength of the tested silicone elastomer.
The mold was brushed with separating medium and left to dry then the silicone mixture was poured and the mold was closed with the aid of screws and G-clamps7. According to manufacturer’s instruction, the silicone should be set aside for 24 hours at 23± 2°C and a relative humidity of 50%±10 % for complete setting (Figure 1).
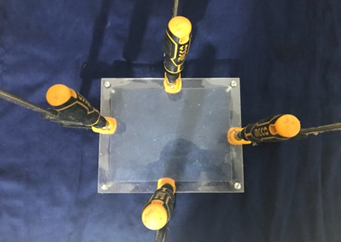
fig. 1. Silicone poured inside the mold
After polymerization, the silicone sheet 15×15 cm9 was separated from the mold cavity and was cut by a custom-made specimen cutting press (MEGA KPD 50E 2012, Spain) with the help of suitable cutting dies to ensure smooth cut surfaces.
A hundred and twenty specimens of the modified silicone were fabricated and divided into 4 groups according to the conducted tests (tensile strength and elongation percentage tests, tear strength test, Shore A hardness test and surface roughness test) with 30 specimens for each test except for the elongation percentage test which was calculated concurrently with the tensile strength test.
All specimens were visually inspected for surface irregularities, bubbles and internal defects10. Sspecimens were stored inside a light proof storage box (china) for, at least, 16 hours of favorable conditions before testing11,12,13.
All tensile strength, elongation at break and tear strength test specimens were tested with a computerized universal testing machine (WDW-20, Laryee Technology Co. Ltd., China) at 500 mm/min cross-head speed14. Thirty specimens of Type 2 dumb-bell shape specimens were fabricated for tensile strength and elongation percentage tests, 10 specimens were used as control group and the other 20 samples divided into 10 samples for 0.25% by weight polyester fibers concentration and the final 10 samples for 0.5% by weight polyester fibers concentration, according to ISO 3715. Specimens were mounted in a computerized universal testing machine 25±0.5 mm apart14. The tensile strength was calculated by the machine software according to the following equation:
Tensile strength=F/A
Where:
F: The maximum force recorded at break (N).
A: The original cross-sectional area of the specimen (mm2).
The elongation percentage test was calculated concurrently with tensile strength test according to the following equation:
Elongation at break= [(L-L0)/L0]×100
Where:
Lo: The original length (mm).
L: Extension at break (mm).
Thirty an un-nicked specimens with a 90° angle on one side and with tab end specimens, were fabricated for tear strength tests, 10 specimens were used as control group and the other 20 samples divided into 10 samples for (0.25% by wt. polyester fibers concentration and the final 10 samples for (0.5% by wt. polyester fibers) concentration, according to ASTM D62416 Specimens were mounted in a computerized universal testing machine with a 30±0.5 mm distance apart17 The tear strength was calculated by the machine software according to the following equation:
Tear strength=F/D
Where:
F: The maximum force required for specimen to break (KN).
D: The median thickness of each specimen (m).
Sixty specimens of 25×25×6 mm for Shore A hardness and surface roughness tests were fabricated7,18, 30 specimens for each test; 10 specimens were used as control group and the other 20 samples divided into 10 samples for 0.25% by wt. polyester fibers concentration and the final 10 samples for 0.5% by wt. polyester fibers concentration, according to ISO 761919.
For hardness test, during testing procedure shore A durometer was held vertically over a flat specimen supported by a rigid, flat surface. Five points were marked with a 6 mm distance apart between each other and the lateral margins of the test specimen; the average of these 5 readings was reported as the hardness value. Readings were taken after 1 second of stable contact over the specimen14.
The surface roughness test was carried out with the aid of a Portable digital roughness tester (Profilometer). The stylus of the device touches the surface of the specimen at three different points to obtain 3 readings. Later on, the mean value of the three readings was reported as roughness value7,18.
Furthermore, FTIR, SEM as well as XRD analysis was performed on 3 samples for each test. One sample represents the silicone material before the addition of polyester fibers and the other 2 samples represent the 0.25% and 0.5% by wt. polyester fibers respectively.
SEM, FTIR, and XRD analysis
SEM results of A-2186 platinum RTV silicone elastomer before and after the addition of 0.25% and 0.5% by weight 2mm length polyester fibers are shown in Figure 2,3 and 4 respectively. The results indicate well dispersion polyester fibers into the silicone matrix (no agglomeration was seen).
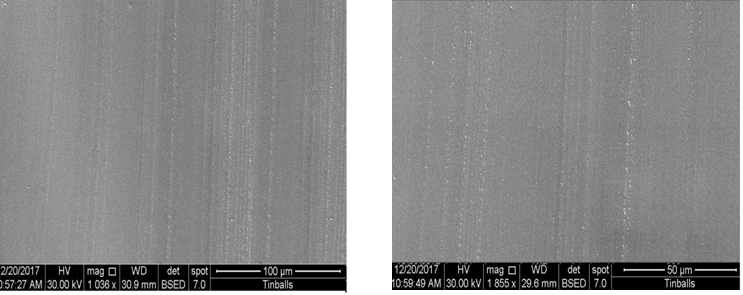
fig. 2. Control group (0%) by weight polyester fibers concentration group
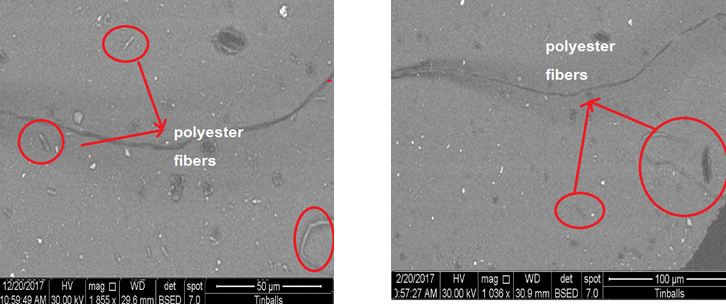
fig. 3. 0.25% by weight polyester fibers concentration group
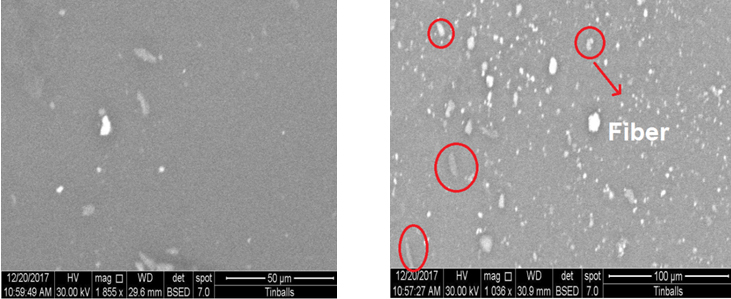
fig. 4. 0.5% by weight polyester fibers concentration group
FTIR spectral results of A-2186 platinum RTV silicone elastomer before and after the addition of 0.25% and 0.5% by weight 2mm length polyester fibers are shown in figure 5. The bands at frequencies (1485.19, 1581.63 and 1629.85 cm-1) refer to some degree of combination between polyester fibers and polydimethylsiloxane silicone.
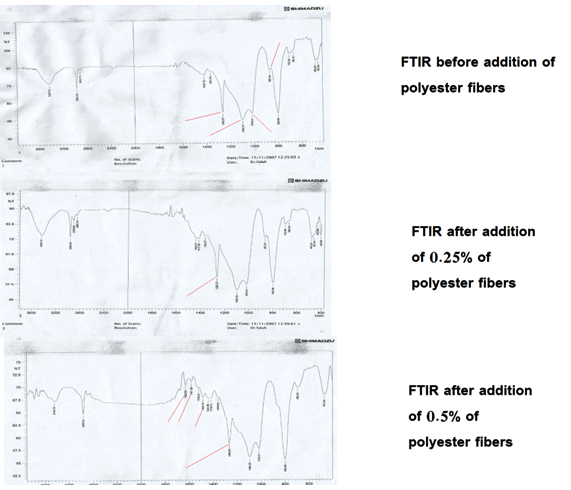
fig. 5. FTIR Spectrum for all groups
XRD diffraction peaks of polyester fibers and A-2186 platinum RTV silicone elastomer before and after the addition of 0.25% and 0.5% by weight (2mm) length polyester fibers are shown in Figure 6. The diffraction angle of x-ray of polydimethylsiloxane of control sample differs from that after addition of polyester fibers in 0.25% and 0.5% concentration and that difference is very clear at 0.5% by weight sample. Change in structural lattice of silicone is observed.
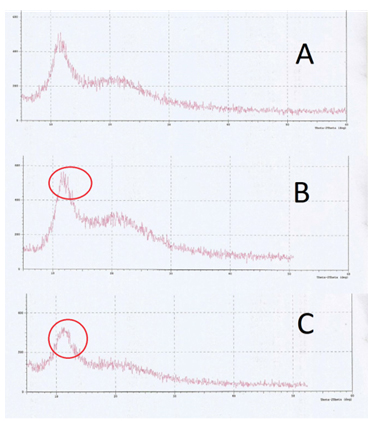
fig. 6. XRD Spectrum for all groups
Tensile Strength, Elongation Percentage
The experimental group (B) showed highest mean values (6.8120 MPa) followed by the control group (A) with (6.6615 MPa) mean value while the lowest mean value was for the experimental group (C) with (6.1090 MPa) as shown in Figure 7 and Table 1.
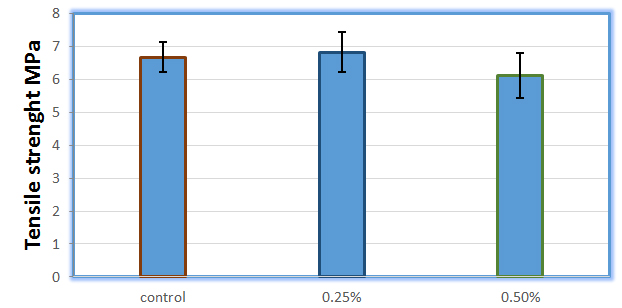
fig. 7.Bar chart of tensile strength test represents the mean values and SD from the mean for all study groups (MPa)
Table (1):
Descriptive statistics of tensile strength test in MPa
| 95% Confidence Interval for Mean | ||||||||
|---|---|---|---|---|---|---|---|---|
| N | Mean | Std. Deviation | Std. Error | Lower Bound |
Upper Bound | Minimum | Maximum | |
| control | 10 | 6.6615 | 0.44668 | 0.14125 | 6.3420 | 6.9810 | 6.19 | 7.63 |
| 0.25% | 10 | 6.8120 | 0.60741 | 0.19208 | 6.3775 | 7.2465 | 5.63 | 7.63 |
| 0.50% | 10 | 6.1090 | 0.68279 | 0.21592 | 5.6206 | 6.5974 | 4.88 | 7.20 |
One-way ANOVA table for tensile strength test results showed significant difference between all tested groups (Table 2).
Table (2):
One-way ANOVA for tensile strength test results.
Sum Of Squares |
DF |
Mean Square |
F |
Sig. |
|
|---|---|---|---|---|---|
Between Groups |
2.740 |
2 |
1.370 |
3.973 |
S. |
Within Groups |
9.312 |
27 |
0.345 |
||
Total |
12.052 |
29 |
To compare the mean values among all study groups, Post-hoc LSD test was conducted. There was non-significant difference between group (A) and group (B) while high significant Mean difference was found between group (A) and group (C) as well as between group (B) and group (C) at 0.05 levels (Table 3).
Table (3):
LSD of tensile strength test results for all study group.
| Groups | Mean Difference (I-J) | Std. Error | Sig. | |
|---|---|---|---|---|
| A (Control) | B (0.25%) | -0.15050 | 0.26264 | N.S. |
| A (Control) | C (0.5%) | 0.55250* | 0.26264 | S. |
| B (0.25%) | C (0.5%) | 0.70300* | 0.26264 | S. |
*The mean difference is significant at the P value< 0.05 level
Elongation percentage test
The experimental group (C) showed highest mean values (220.551%) followed by 0.25% group (B) with (216.29) mean value while the lowest mean value was for the control group (A) with (213.329) as shown in figure 8 and table 4.
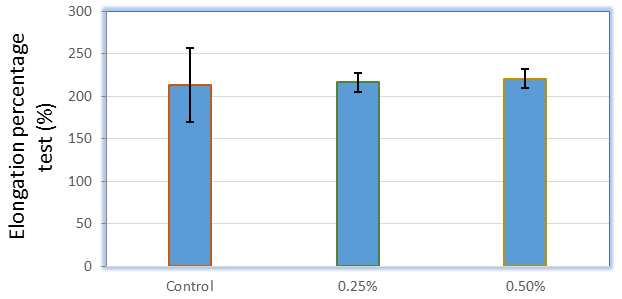
fig. 8.Bar chart of elongation percentage test represents the mean values and SD from the mean for study groups (%)
Table (4):
Descriptive statistics of elongation percentage test
| 95% Confidence Interval for Mean | ||||||||
|---|---|---|---|---|---|---|---|---|
| Groups | N | Mean | Std. Deviation | Std. Error | Lower Bound | Upper Bound | Minimum | Maximum |
| Control | 10 | 213.3290 | 43.33029 | 13.70224 | 182.3324 | 244.3256 | 122.22 | 277.77 |
| 0.25% | 10 | 216.2900 | 10.86171 | 3.43477 | 208.5200 | 224.0600 | 194.44 | 231.48 |
| 0.50% | 10 | 220.5510 | 11.19509 | 3.54020 | 212.5425 | 228.5595 | 201.85 | 235.18 |
One-way ANOVA table for elongation percentage test results showed highly significant difference between all tested groups (Table 5).
Table (5):
One-way ANOVA for elongation percentage test.
Sum of Squares |
DF |
Mean Square |
F |
Sig. |
|
|---|---|---|---|---|---|
Between Groups |
263.603 |
2 |
131.802 |
0.186 |
n.s. |
Within Groups |
19087.388 |
27 |
706.940 |
||
Total |
19350.991 |
29 |
Tear Strength
The experimental group (B) showed highest mean values (25.968 KN/m) followed by the control group (A) with (26.281 KN/m) mean value while the lowest mean value was for the experimental group (C) with (25.34 KN/m) as shown in figure 9 and table 6.
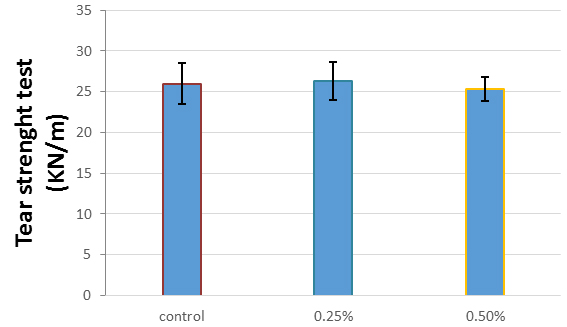
fig. 9. Bar chart of tear strength test represents the mean values and SD from the mean for all study groups (KN/m)
Table (6):
Descriptive statistics of tear strength test in KN/m.
| 95% confidence interval for mean | ||||||||
|---|---|---|---|---|---|---|---|---|
| Groups | N | Mean | Std. Deviation | Std. Error | Lower Bound | Upper Bound | Minimum | Maximum |
| Control | 10 | 25.9680 | 2.49191 | 0.78801 | 24.1854 | 27.7506 | 23.63 | 31.50 |
| 0.25% | 10 | 26.2810 | 2.34361 | 0.74112 | 24.6045 | 27.9575 | 21.73 | 29.04 |
| 0.50% | 10 | 25.3400 | 1.45585 | 0.46038 | 24.2986 | 26.3814 | 23.68 | 27.22 |
One-way ANOVA table for tear strength test results showed highly significant difference between all tested groups (Table 7).
Table (7):
One-way ANOVA for tear strength test results.
Sum of Squares |
DF |
Mean Square |
F |
Sig. |
|
|---|---|---|---|---|---|
Between Groups |
4.593 |
2 |
2.296 |
0.498 |
n.s. |
Within Groups |
124.395 |
27 |
4.607 |
||
Total |
128.988 |
29 |
Shore A Hardness
The experimental group (C) showed highest mean values (45.497) followed by (B) with (43.029) mean value while the lowest mean value was for the control group (A) with (41.329) as shown in figure 10 and table 8.One-way ANOVA table for Shore A hardness test results showed non-significant difference between all tested groups (Table 9).To compare the mean values among all study groups, Post-hoc LSD test was conducted show significant difference was found all groups of study (Table 10).
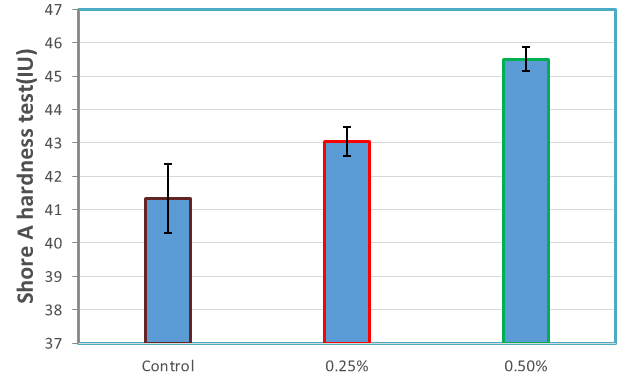
Fig. 10. Bar chart of Shore A hardness represents the mean values and SD from the mean for all study groups.
Table (8):
Descriptive statistics of Shore A hardness test.
| 95% Confidence Interval for Mean | ||||||||
|---|---|---|---|---|---|---|---|---|
| Groups | N | Mean | Std. Deviation | Std. Error | Lower Bound | Upper Bound | Minimum | Maximum |
| Control | 10 | 41.3290 | 1.04149 | 0.32935 | 40.5840 | 42.0740 | 40.00 | 42.66 |
| 0.25% | 10 | 43.0290 | 0.42927 | 0.13575 | 42.7219 | 43.3361 | 42.33 | 43.66 |
| 0.50% | 10 | 45.4970 | 0.35954 | 0.11370 | 45.2398 | 45.7542 | 45.00 | 46.00 |
Table (9):
One-way ANOVA for Shore A hardness test results.
Sum of Squares |
DF |
Mean Square |
F |
Sig. |
|
|---|---|---|---|---|---|
Between Groups |
87.844 |
2 |
43.922 |
94.237 |
H.S. |
Within Groups |
12.584 |
27 |
0.466 |
||
Total |
100.428 |
29 |
Table (10):
LSD of Shore A Hardness test results for all study groups.
| Groups | Mean Difference (I-J) | Std. Error | Sig. | |
|---|---|---|---|---|
| A (Control) | B (0.25%) | -1.70000* | 0.30531 | H.S. |
| A (Control) | C (0.5%) | -4.16800* | 0.30531 | H.S. |
| B (0.25%) | C (0.5%) | -2.46800* | 0.30531 | H.S. |
*The mean difference is significant at P value <0.05%level.
Surface roughness tests
The experimental group (C) showed highest mean values (0.536 ìm) followed by (B) with (0.4268 ìm) mean value while the lowest mean value was for the control group (A) with (0.3917 ìm) as shown in figure 11 and table 11.
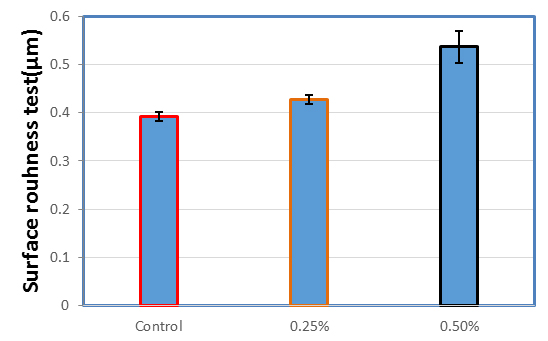
fig. 11. bar chart of surface roughness represents the mean values and sd from the mean for all study groups (μm)
Table (11):
descriptive statistics of surface roughness test in (μm) .
| 95% Confidence Interval for Mean | ||||||||
|---|---|---|---|---|---|---|---|---|
| Groups | N | Mean | Std. Deviation | Std. Error | Lower Bound | Upper Bound | Minimum | Maximum |
| Control | 10 | 0.3917 | 0.009250 | 0.00292 | 0.3850 | 0.39832 | 0.380 | 0.410 |
| 0.25% | 10 | 0.4268 | 0.009438 | 0.00298 | 0.4200 | 0.43355 | 0.415 | 0.447 |
| 0.50% | 10 | 0.5360 | 0.032813 | 0.01037 | 0.5125 | 0.55947 | 0.455 | 0.589 |
One-way ANOVA table for surface roughness test results showed non-significant difference among all tested groups (Table 12).
Table (12):
One-way ANOVA for surface roughness test results.
Sum of Squares |
Df |
Mean Square |
F |
Sig. |
|
|---|---|---|---|---|---|
Between Groups |
0.113 |
2 |
0.057 |
135.775 |
H.S. |
Within Groups |
0.011 |
27 |
0.000 |
||
Total |
0.125 |
29 |
To compare the mean values among all study groups, Post-hoc LSD test was conducted. There was significant difference between all tested groups at 0.05% level (Table 13).
Table (13):
LSD of surface roughness test results for all study groups.
| (I) Groups | Mean Difference (I-J) | Std. Error | Sig. | |
|---|---|---|---|---|
| A (Control) | B (0.25%) | -.035100* | .009133 | .001 |
| A (Control) | C (0.5%) | -.144300* | .009133 | .000 |
| B (0.25%) | C (0.5%) | -.109200* | .009133 | .000 |
*The mean difference is significant at P value <0.05%level.
The addition of fibers is necessary for achieving certain degree of reinforcement that leads to significant improvement of the mechanical properties. The reinforcement depends to a large extent on the polymer properties, gibers characteristics (fiber size or specific surface area, structure and surface activity), and fibers loading (amount of fibers) and processing conditions20, 21, 22.
Chemically, FTIR results not report any chemical interaction between silicone and polyester fibers but refer to some degree of combination between polyester fibers and polydimethylsiloxane silicone. FTIR test is considered as qualitative and quantitative analysis of material properties23.
This mean the amount of material added (polyester fibers) play fundamental role in its detection. The 0.5% and 0.25% by wt. concentration of 2mm length polyester fibers is so small amount to be detected. The XRD analysis was performed to study the presence and absence of incorporation of 2mm polyester fiber and A-2168 silicone elastomer matrix and degree of changing in silicone lattice which was observed clearly at sample of 0.5% by weight polyester fibers sample.
The results of tensile strength and elongation indicated that elongation percentage significantly increased when adding polyester fibers in amounts of 0.25% and 0.5% by wt., while tensile strength is increased in 0.25% by wt. polyester fibers concentration and decreased in 0.5% by wt. concentration when compared to the unreinforced silicone. This could be due to the chemical and physical interactions of polyester with the polymer chains. Tensile strength and elongation of cured silicone elastomer depend mainly on the cross-linking system, cross-linking density and the interaction between fillers and polymer chains24. The addition of the polyester fibers to A-2186 silicone may improve energy dissipation capability of polymeric matrix that increase tensile strength and the elongation percentage of silicone25.
Fiber-reinforced maxillofacial silicone prosthesis tends to have more stable margins and a sufficient bond between silicone and fibers26.
The results of tear strength show increase in material tear strength at fibers concentration (0.25%) by wt., while the material shows decrease in tear resistance when fibers concentration increased into (0.5%) of silicone weight when compared to control group. The reasons why the results of the tear strength how decrease at fibers concentration (0.5%) may be attributed for two possible causes. Firstly creating a stress concentration points at the surface of the specimen by polyester fibers aggregation which might be the consequence of micro cracks emerging between the filler and the matrix, which would cause an early failure of the silicone material .The possible second reason is failure of the material from infiltrating into the accumulated polyester fibers, which would result in a void and deterioration that would make the tear strength less than the other groups. This may explain the reason for using an appropriate type and quantity of polyester fibers.
In contrast to the previously mentioned values, hardness and surface roughness values increased proportionally with increased polyester fibers in comparison to the control group. Increased Shore A hardness may due to dispersing of polyester fibers in the silicone elastomer, which increases the crosslink density, thereby leading to increased hardness. However;the hydrophobicity of the material is an important property relating to the smoothness of the material surface ,the increased surface roughness may due to hydrophobicity of polyester fibers27,28.
The following conclusions were reached after taking into consideration the limitations of this study. The addition of 2mm length polyester fibers improves some mechanical properties of silicone (Tear strength and tensile strength at certain concentrations). Variation in the mechanical properties values’ is directly proportional to the amount of fiber content.
- Kenneth J. Anusavice, Chiayi Shen, H. Ralph Rawls. Phillips’ Science of Dental Materials. 12 th ed St. Louis, Mo.: Elsevier; 2013. ISBN: 9781437724189
- Mantri S. and Khan Z. Prosthodontic Rehabilitation of Acquired Maxillofacial Defects, Head and Neck Cancer.Dr. Mark Agulnik (Ed.), In Tech,(2012).
- Moser, VF., Crevenna R., Korpan M., Quiltan, M. Cancer Rehabilitation particularly with aspects of physical impairment. J. Rehab Med., 2003; 35(4): 153-62.
- Cochrane H. and. Lin CS. The Influence of Fumed Silica Properties on the Processing, Curing, and Reinforcement Properties of Silicone Rubber. Rub Chemi and Tech., 1993; 66(1):48-60.DOI:10.5254/1.3538299
- Hatamleh, MM. and Watts, DC. Effects of accelerated artificial daylight aging on bending strength and bonding of glass fibers in fiber-embedded maxillofacial silicone prosthese. J. Prosthodont., 2010; 19(5): 357–363.
- Gunay, Y., Kurtoglu, C., Atay, A., Karayazgan, B., Gurbuz, CC. Effect of tulle on the mechanical properties of a maxillofacial silicone elastomer. Mater., 2008; 27(6): 775-779. DOI: 10.4012/dmj.27.775.
- Atta Allah, J. and Muddhaffer, M. Influence of Artificial Weathering on Some Properties of Nano Silicon Dioxide Incorporated Into Maxillofacial Silicone. IJSR, 2017; 6(5): pp. 423-428.
- Tukmachi, M. and Moudhaffer, M. Effect of Nano silicon dioxide addition on some properties of heat vulcanized maxillofacial silicone elastomer. JPBS. 2017; 12(3-4): 37-43.
- Rai, S. Y. and Guttal, S. S. Effect of intrinsic pigmentation on the tear strength and water sorption of two commercially available silicone elastomers. J. Indian. Prosthodont, 2013; 13(1): 30-35.
- ISO/TR 27628. Workplace atmospheres – Ultrafine, nanoparticle and nano-structured aerosols – Inhalation exposure characterization and assessment. 2007.
- Dos Santos, D. M., Goiato, M. C., Moreno, A., Pesqueira, A. A., De Carvalho Dekon, S. F., Guiotti, A. M. Effect of addition of pigments and opacifier on the hardness, absorption, solubility and surface degradation of facial silicone after artificial ageing. Degrad. Stab., 2012; 97(8): 1249-1253.
- Abdullah, H.A. Evaluation of some mechanical properties of a new silicone material for maxillofacial prostheses after addition of intrinsic pigmen M.Sc. Thesis, University Of Baghdad. 2016; 53-58
- Haddad, M. F., Goiato, M. C., Dos Santos, D. M., Moreno, A., D’almeida, N. F., Pesqueira, A. A. Color stability of maxillofacial silicone with nanoparticle pigment and opacifier submitted to disinfection and artificial aging. Bio med. Opt., 2011; 16(9):095004-095006.
- Zayed, S. M., Alshimy, A. M., Fahmy, A. E. Effect of surface treated silicon dioxide nanoparticles on some mechanical properties of maxillofacial silicone elastomer. J. Biomater., 2014; 2014: 750398-750405.
- ISO 37. Rubber, vulcanized or thermoplastic — Determination of tensile stress-strain properties.2011.
- ASTM D624-00. Standard Test Method for Tear Strength of Conventional Vulcanized Rubber and Thermoplastic Elastomers. ASTM International, West Conshohocken, PA, USA. 2012.
- Al-Harbi, F. A., Ayad, N. M., Saber, M. A., Arrejaie, A. S., Morgano, S. M. Mechanical behavior and color change of facial prosthetic elastomers after outdoor weathering in a hot and humid climate. Prosthet. Dent., 2015; 113(2): 146-151.
- Fouad, M. and Moudhaffer, M. Effect of Disinfection on Some Properties of Heat-Vulcanized Maxillofacial Silicone Elastomer Reinforced by Nano Silicone Dioxide. J Bagh Coll dent, 2016; 28(4): 16-21.
- ISO 7619-1. Rubber, vulcanized or thermoplastic – Determination of indentation hardness – Part 1: Durometer method (Shore hardness). 2010.
- Yatsuyanagi F, Suzuki N, Ito M and Kaidou H. Effects of secondary structure of fillers on the mechanical properties of silica filled rubber systems. J Polymer, 2001; 42(23):9523–9529.
- Robertson C.G, Lin C.J, Rackaitis M and Roland C.M .Influence of Particle Size and Polymer”Filler Coupling on Viscoelastic Glass Transition of Particle-Reinforced Polymers. Macro mol., 2008; 41(7): 2727–2731.
- Mahrholz T, Stängle J. and Sinapius M. Quantitation of the reinforcement effect of silica nanoparticles in epoxy resins used in liquid composite moulding processes. J Comp Part A: App Sci Manu., 2009; 40(3): 235-243.
- Shaikh, T. N. and Agrawal, S. Qualitative and Quantitative Characterization of Textile Material by Fourier Transform Infra-Red. IJIRSET, 2014; 3(1): 8496-8502.
- Aziz T, waters M, jagger R .Analysis of the properties of silicone rubber maxillofacial prosthetic materials. J dent, 2003; 31(1):67-74.
- Zhao, Z. Y., Khatri, N.D., Nguyen, K., Song, S. Q., Sun. L. Synthesis and Mechanical Properties of Interconnected Carbon Nano fiber Network Reinforced Polydimethylsiloxane Composites. J Nano sci and Nano Tech, 2011; 11: 1092–1097.
- Vallittu P.k,. Flexural properties of acrylic resin polymers reinforced with unidirectional and woven glass fibers. J Prosthet Dent., 1999; 81(3): 318-26.
- Amin, M., Akbar, M. and Amin, S. Hydrophobicity of silicone rubber used for outdoor insulation (an overview). Rev. Adv. Mater. Sci., 2007; 16: 10-26. Available at http://www.ipme.ru/e-journals/RAMS/no_11607/amin.html.
- Natarajan. S., and Jeyakodi moses. J. Surface modification of polyester fibric using polyvinyl alcohol in alkaline medium. J Ind fibr and text res., 2012; 37:287-291.
© The Author(s) 2018. Open Access. This article is distributed under the terms of the Creative Commons Attribution 4.0 International License which permits unrestricted use, sharing, distribution, and reproduction in any medium, provided you give appropriate credit to the original author(s) and the source, provide a link to the Creative Commons license, and indicate if changes were made.