

ISSN: 0973-7510
E-ISSN: 2581-690X
This research aimed to examine the dual effects of Coffea arabica on the cell division of Allium cepa and its antibacterial properties. This was achieved by utilizing the A. cepa bioassay to study mitosis and measuring optimal density, as well as using the agar well diffusion method to evaluate the antibacterial effect against Pseudomonas aeruginosa, Staphylococcus aureus, and Bacillus subtilis. To study the impact of Coffea arabica on mitosis, root tips of Allium cepa were exposed to three different levels of coffee (1.5, 5.5, and 10.5 g/100 ml). The frequency of chromosomal aberrations (CA) and mitotic index (MI) were observed under a microscope. For the antibacterial effect, the coffee extracts were tested against P. aeruginosa, S. aureus, and B. subtilis using two methods. First, the optimal density of bacterial growth was measured for three different coffee levels (3, 12.5, 20 mg/ml). Second, the agar well diffusion method was used to evaluate the size of the inhibition zones around the wells containing the coffee extract. The results revealed that Coffea arabica at levels of 10.5 g/100 ml and 5.5 g/100 ml significantly affected mitosis in A. cepa root cells, leading to an increase in CA, such as multinucleated cells, chromosomal stickiness, and chromosomal bridges. The MI was also noticeably elevated at these levels. Regarding antibacterial activity, P. aeruginosa was found to be the most susceptible to coffee at 12.5 mg/ml, as indicated by the optical density measurement. The agar well diffusion method showed that S. aureus exhibited the largest inhibition zone (1.9 cm) at 20 mg/ml. This research highlights the dual impact of Coffea arabica on both chromosomal stability and bacterial growth. The coffee extract demonstrated a clear effect on mitosis, causing CA and surged MI in A. cepa root cells. Additionally, coffee exhibited antibacterial properties, particularly against P. aeruginosa and S. aureus. These findings suggest that while coffee has beneficial antimicrobial effects, its impact on cellular processes, such as chromosomal integrity, should also be considered in future studies.
Bacteria, Chromosomes, Coffee, Inhibition, Mitosis
Coffee is the second most prevalent brew after water, with over 1.6 billion cups consumed every day around the world. The consumption of coffee has been a longstanding habit to keep awake and alert. Coffee contains many mixes, predominantly caffeine (1,3,7-trimethylxanthine C8H10N4O2). It is a naturally emotive stimulant that is found in over 60 plants, primarily coffee, tea, and cacao plants. Caffeine is generally found in a large number of plants, especially in the leaves, seeds, and fruits. Over recent decades, caffeine and other energy-enhancing amalgams have gained widespread popularity with the rise of energy drinks, pre-workout supplements, and innovative coffee products. Caffeine stands out for its versatile use in various pharmacological formulations, including pain relievers, dietary aids, and treatments for flu symptoms.1
After ingestion, approximately 99% of caffeine is absorbed in the gut and distributed to various organs and tissues, where it elicits a range of physiological effects. These effects depend on factors such as the dose consumed, individual tolerance, and overall physical health. Caffeine has been revealed to boost energy levels, influence mood, and disrupt sleep patterns. However, excessive intake is associated with adverse outcomes like arrhythmias and hypertension. Research on calcium regulation suggests that caffeine may slightly reduce calcium balance in individuals with inadequate calcium intake, although this effect can be fully offset by consuming 1-2 tablespoons of milk. For healthy individuals, moderate caffeine consumption is generally considered safe and free of adverse side effects. Potential issues such as chromosomal abnormalities, restlessness, nervousness, nausea, and surged heart rate can often be avoided by limiting high caffeine levels and maintaining moderate consumption levels.2
A recent study conducted at McMaster University in Canada has revealed that certain proteins in the human body interact with caffeine in coffee, helping the liver lower levels of low-density lipoprotein (LDL) or ‘bad’ cholesterol. Elevated LDL cholesterol levels are linked to a surged risk of cardiovascular disease. The researchers found that regular caffeine consumption is associated with reduced levels of a protein called Proprotein convertase subtilisin/kexin type 9 (PCSK9) in the bloodstream. Lower PCSK9 levels enhance the liver’s ability to eliminate excess LDL cholesterol. Additionally, the study showed that caffeine and its derivatives can inhibit the activation of Sterol Regulatory Element-Binding Protein (SREBP2), which in turn reduces PCSK9 levels. In summary, the findings suggest that caffeine and its derivatives may help lower PCSK9 levels in the blood, potentially decreasing the risk of cardiovascular disease.3
It has been established that caffeine causes chromosomal abnormalities in actively dividing cells, particularly during prophase and G2 (the second growth of interphase). Abnormalities appear in response to several biological genetic interactions within the human body. Abnormalities or abnormal chromosomes occur mostly as a result of an error during cell division, either during mitosis (error during the division of somatic cells) or meiosis (error during the division of sex cells). The MI is the percentage of cells undergoing mitosis at any particular time. A reduction or increase in MI is an excellent indicator of the presence of clastogenic material, which are substances that cause breaks in chromosomes, resulting in the addition, deletion, or rearrangement of chromosomal regions.4-7
The Allium cepa test allows the investigation of various genetic endpoints. CA can be classified by alterations in chromosome number or structure. The numeric CAs are a result of anomalous chromosome segregation, whereas structural chromosomal changes may arise from numerous factors, for instance, inhibition of DNA synthesis, DNA breaks, and replication of altered DNA. For the assessment of chromosomal abnormalities, various forms of CAs are observed at different stages of mitosis.
The extensive use of antibiotics to combat bacterial infections has led to the expansion of resistance in many bacteria against commonly used antibiotics. As a result, there is an urgent need to discover new antibiotics that bacteria are less likely to resist. Recently, the potential of plant-derived products as antimicrobial agents has garnered attention, especially considering that most antibiotics have historically been sourced from fungi or bacteria. Accompanying the increase in resistance, along with the awareness of the limitation of the actual lifespan of any antibiotic, novel sources, particularly plant-based derivatives, are feeling intensive research. Some studies have verified antimicrobial action by several natural complexes, including coffee. In addition to being a popular beverage known for its stimulating and refreshing effects, coffee is increasingly being recognized for its potential health benefits. Among its various health benefits, coffee has demonstrated antimicrobial activity, exhibiting distinct effects against several bacterial genera due to mixtures such as caffeine. Studies have publicized significant variations in the antibacterial activity of coffee depending on its level.
Namboodiripad and Kori are pragmatic that persons who drank coffee daily without sugar or milk had a discount in dental caries related to those who did not follow the same habit, highlighting coffee’s antimicrobial properties. Additionally, caffeine has been reported to possess antimicrobial activity against certain bacteria. Caffeine in coffee is toxic to many microorganisms, although some microorganisms can degrade caffeine and use it as a nutrient source to promote growth. A study at the University of Karbala tested the effects of caffeine and antibiotics on bacteria and found that caffeine was more effective than the standard antibiotic ampicillin against Streptococcus aureus and Enterobacter aerogenes. Caffeine-degrading bacteria include strains belonging to Pseudomonas, Serratia, Klebsiella, and Alcaligenes. Additional research suggested that the bacteria Pseudomonas putida can use caffeine as a carbon source. Caffeine is serene of carbon, hydrogen, nitrogen, and oxygen, all of which are essential for bacterial growth. It also has higher growth rates upon exposure to elevated caffeine levels. Antimicrobial agents are generally accepted as the most operative means of fighting infectious diseases. Antimicrobial drugs given systemically have been identified as a major cause of surge resistance of microbes to the same drugs. They are linked with the progress of an unbalanced intestinal microbiome. Recent studies have publicized that natural substances that exert antibacterial effects against specific pathogens, including coffee, could potentially play a significant role in the medical field by allowing the expansion of new treatments for diseases, including oral pathologies.
Based on the above problem statement, the following objectives are set to investigate the possibility of using coffee extract on Allium cepa roots and its efficiency as a defense mechanism against bacterial infections, to compare the different levels of the tested beverage containing caffeine such as Turkish coffee, on cell division and to study the following: antibacterial activity of coffee, bacterial strains of interest, MI, and chromosomal abnormalities (CAs).
The Effect of Coffee on Onion Roots
Treatment
To study the effect of coffee on onion root tips, four Allium cepa bulbs were selected and grown in distilled water at room temperature until the roots stretched a length of about 2-3 cm. Three of the four onion bulbs were moved to coffee for 24 hours, while the fourth remained in distilled water as a control.8 This experimental design aimed to observe the impact of coffee on cell division and chromosomal abnormalities in the root tips. The Allium cepa test is commonly used to assess the genotoxicity of substances, as it provides a reliable model for studying MI and CA.9 Additionally, previous studies have demonstrated that coffee’s bioactive mixtures, particularly caffeine, can influence cellular processes such as DNA replication and mitosis.10
Preparation of different levels
Turkish coffee was chosen because it is the dominant type of caffeine consumed in the Middle East. The three different levels (1.5, 5.5, 10.5 g/100 ml) were selected based on the questionnaire results. This was based on the number of teaspoons used in preparing coffee among the general public, with one teaspoon estimated at 2.5-3 g, one and a half teaspoons at 3.75-4.5 g, and two teaspoons at 5-6 g. It has been revealed that two teaspoons of coffee (5-6 g) is the average amount of consumption for the majority of participants.11 For this reason, the standard level for this research was set at 5.5 g/100 ml, and the two other levels were selected to be lower (1.5 g/100 ml) and higher (10.5 g/100 ml) than the standard level.12
Slide preparation
The terminal areas of the evolving roots were fixed in a freshly prepared mixture of 3 ml of ethyl alcohol and 1 ml of glacial acetic acid for 24 hours. The next step is hydrolysis, in which the roots are treated with 1 N hydrochloric acid at 60 °C for 10 minutes using the LabTech Analog water bath. This process helps break the protoplasmic bonds and softens the cell walls, facilitating the squashing of these roots and the spreading of plant tissue. Once hydrolysis is complete, the roots are rinsed thrice in distilled water. Moreover, the roots are kept in leucobasic fuchsin dye (Fuchsin-Feulgen) for 30 minutes. After this, the roots are transferred to a microscopic slide with a drop of acetic acid and squashed using a needle under a cover slip. Finally, the prepared slides were observed under the Olympus light microscope at a magnification of 40X. For this study, one cytological slide was prepared for each treatment, and in each slide, microscopic fields were examined.13
Effect of coffee on bacterial growth
Bacterial isolates
To study the effect of coffee on three bacterial isolates, one Gram-negative (P. aeruginosa) and two Gram-positive (B. subtilis and S. aureus) isolates were obtained from King Fahad Hospital Laboratory.
McFarland standards
McFarland standards are widely used in microbiology to standardize bacterial suspensions for various microbial tests, ensuring consistency in the results.14 These standards are designed to adjust the turbidity of bacterial suspensions, making sure the number of bacteria in the suspension falls within a specific range typically used for antimicrobial susceptibility testing.15 The original McFarland standards were created by mixing a specific level of BaCl2 and H2SO4, which forms a barium sulfate precipitate that is used to regulate the turbidity level.16 To create the desired turbidity, a bacterial suspension is prepared and associated visually with the McFarland standard, which serves as a reference.17 The comparison is typically done by matching the turbidity of the bacterial suspension with that of a McFarland standard. If the bacterial suspension is too concentrated (turbid), it can be diluted with a sterile diluent, such as saline or nutrient broth, until the desired turbidity is achieved. Conversely, if the suspension is too clear and lacks the necessary turbidity, additional bacteria can be added to increase the level. This method ensures that the bacterial level is consistent for accurate testing, particularly in antimicrobial susceptibility tests, where the outcome depends on the bacterial load.18
Spectrophotometer (APEL) and turbidity measurement
The spectrophotometric method is a technique used to estimate the total biomass of both alive and dead cells.19 This technique is based on the turbidity of bacterial populations by devious turbidity or optical density (OD), which represents the cloudiness of a suspension of a broth culture.20 To use the spectrophotometer, a blank sample is placed in a cuvette.21 To set the turbidity measurement at the correct wavelength, the spectrophotometer is zeroed.22 The clear side of the cuvette should be placed facing the path of the light source to take a reading.23 The lid should be closed, and the button (named as 0%T) should be pressed until it shows 0.24 The blank is replaced with a new sample to measure and record the absorbance reading.25 Turbidity is commonly quantified in Nephelometric Turbidity Units (NTU), which measure the amount of light scattered by particles in a liquid sample.26 The nephelometric method involves comparing the scattering of light in the sample to that of a reference solution, typically a standard with a known turbidity. This method allows for the precise determination of the particle level, such as bacterial cells, within the suspension. In this study, two bacterial isolates, P. aeruginosa and B. subtilis, were selected and labeled for analysis. These isolates were subjected to turbidity measurements to standardize their level for further experimentation. The turbidity of the bacterial suspensions was adjusted using the McFarland standards to ensure accurate and consistent microbial testing, facilitating the assessment of their behavior in various conditions or reactions.27 The bacterial samples were inoculated into 25-30 ml of nutrient broth flasks, and the bacterial suspension was well mixed.28 Then, 3, 12.5, and 20 mg/ml of coffee solution were added, respectively, with no coffee extract added to the control. The three levels (3, 12.5, and 20 mg/ml) were named low, standard, and high, respectively.29 The flasks were incubated at 37 °C for 3 hours, and a reading was taken every 30 minutes to stimulate bacterial growth colonies, using the spectrophotometer (OD) to measure optical density.30
Bacterial suspension
Trace smears of bacterial colonies were taken and placed in cuvettes filled with 500 ml of nutrient broth.31 Smears were taken from two different types of bacterial colonies, P. aeruginosa and B. subtilis.32 The bacteria and nutrient broth must be mixed well. McFarland Standard 0.5 was used to compare the turbidity with the mixture. If the suspension is too light, more bacteria should be added, and if it is too dense, it should be diluted with nutrient broth.33
Agar well method
In this experiment, 25 ml of sterile nutrient broth was added to 100 ml Erlenmeyer flasks, which were then inoculated with the selected pure bacterial isolates.34 The flasks were incubated at 37 °C for 24 hours. Following incubation, 100 µl of the overnight culture, equivalent to a 0.5 McFarland suspension, was transferred into Petri dishes. To each Petri dish, 25 ml of warm nutrient agar (45-55 °C) was poured and gently mixed with the bacterial suspension. The plates were then left to solidify, creating “seed plates”. Using a sterile cork borer or a sterile tube, holes approximately 8 mm in diameter were made in the solidified agar of the seed plates. Into each hole, 100-250 µl of one of the three different coffee extracts was transferred under aseptic conditions. To allow for proper diffusion of the coffee extracts, the plates were refrigerated for 2 hours before incubation. Afterward, the plates were incubated at 37 °C for 24 hours.35 Following incubation, the plates were examined for antimicrobial activity (Table 1). The presence of clear inhibition zones around the wells, where bacterial growth was prevented, was noted as evidence of antimicrobial activity. The size of the inhibition zones was measured with a ruler using a centimeter scale.
Table (1):
The MI in root tip cells of Allium cepa L. induced by coffee
Different Levels of Coffee |
Control (No Coffee) |
Low (1.5 g/100 ml) |
Standard (5.5 g/100 ml) |
High (10.5 g/100 ml) |
|---|---|---|---|---|
MI in the 1st Replicate (%) |
4.37 |
2.91 |
3.95 |
5.60 |
MI in the 2nd Replicate (%) |
4.10 |
3.57 |
4.14 |
6.94 |
MI in the 3rd Replicate (%) |
4.57 |
3.91 |
2.44 |
5.18 |
Mean ± SD |
4.35 ± 0.24 |
3.47 ± 0.51 |
3.51 ± 0.93 |
5.91 ± 0.92 |
The results showed the measurement of the differences in MI and chromosomal aberration (CA) for the root tips experiment. The effect on bacterial growth was resolute by using spectrophotometer analysis to measure the turbidity and agar well technique.
Questionnaire results
The questionnaire was distributed to 254 people. Approximately 82.7% of them were female, and 18.3% were male. The rate of coffee consumption between the ages of 15-25 was higher than that associated with the age of 36-45 in Arab societies. Since the ages of most coffee consumers are between 15 and 25, university students are the first coffee consumers. As the consumption of coffee surged, people became more aware that different percent of caffeine may affect health with different percent. 68.5% of people notice the difference in these percent while shopping, and only 31.5% do not notice (Figure 1).
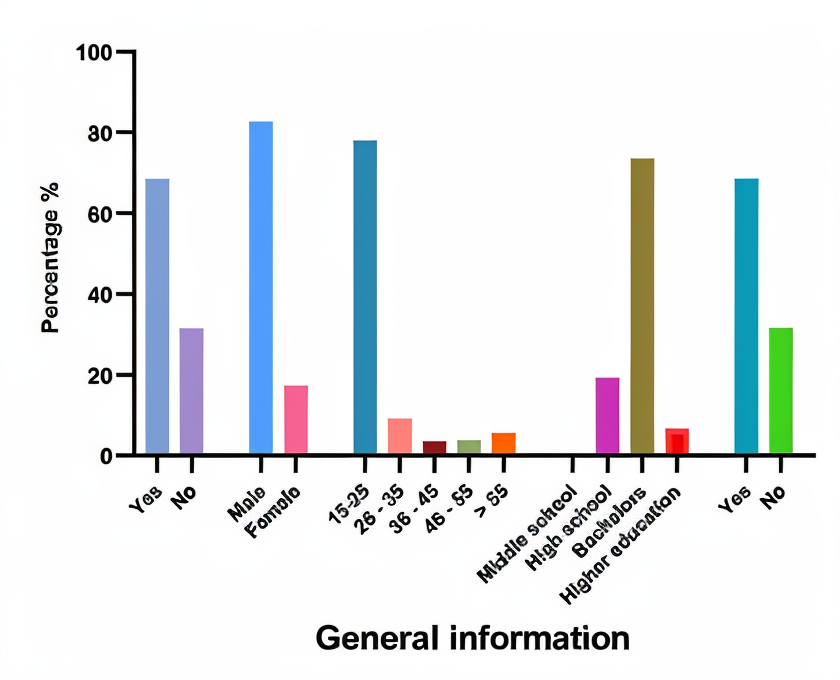
Figure 1. Gender, Age, Academic Achievement, and Awareness of Caffeine Content of Consumers
The results showed that the dominant type of caffeine consumption was hot Turkish coffee, with 60.2% consuming caffeine drinks. Followed by Saudi coffee at 49%. After that, energy drinks, pre-workouts, tea, and soft drinks came in a small % linked to coffee and 10.2% of those who never consume caffeine (Figure 2).
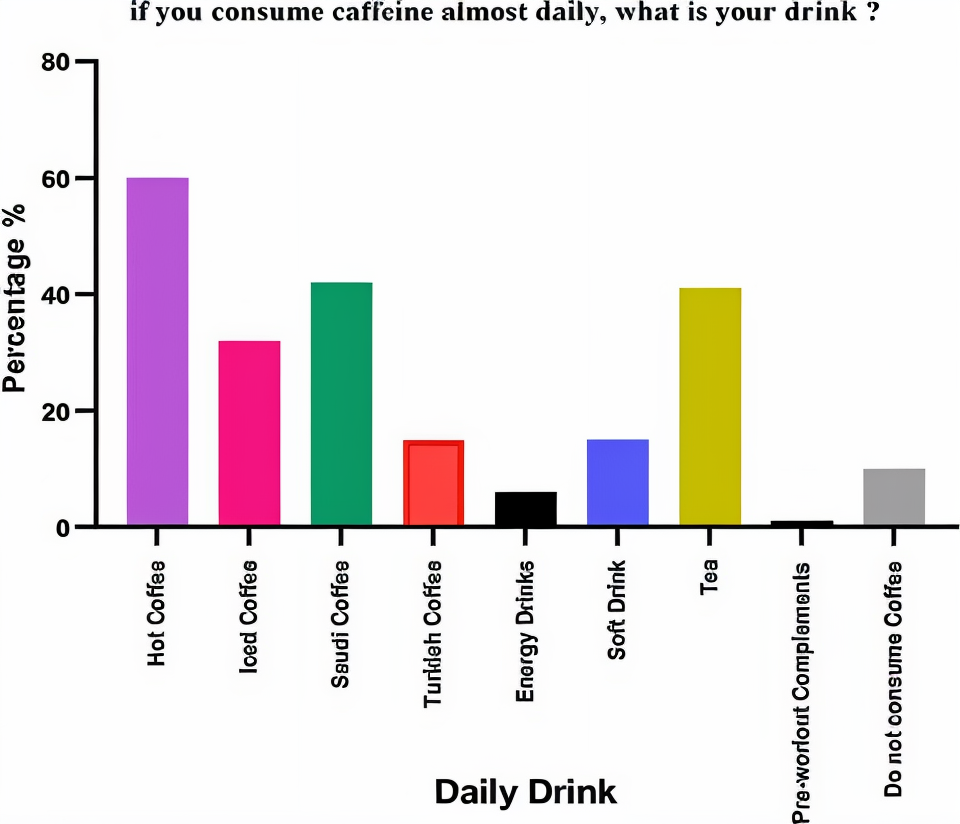
Figure 2. Daily consumption of caffeinated beverages: Analyzing the prevalence and effects of caffeine in hot drinks, iced teas, soft drinks, and other popular choices
The effect of coffee on onion roots
One cytological slide was prepared for each treatment and in each slide microscopic fields were used for microscopic analysis of onion root tips treated with three different levels of coffee {low (1.5 g/100 ml), standard (5.5 g/100 ml) and high (10.5 g/100 ml)} in addition to a control group, the MI and the frequency of CA were designed using Microsoft Excel (Eq. 1 and 2; Table 2 & Table 3 and Figure 3).
Frequency of CA = [Number of aberrant cell / Total number of cells counted] × 100
…1
Mitotic Index (MI) = [Number of dividing cells (n) / Total number of cells counted (N)] × 100
…2
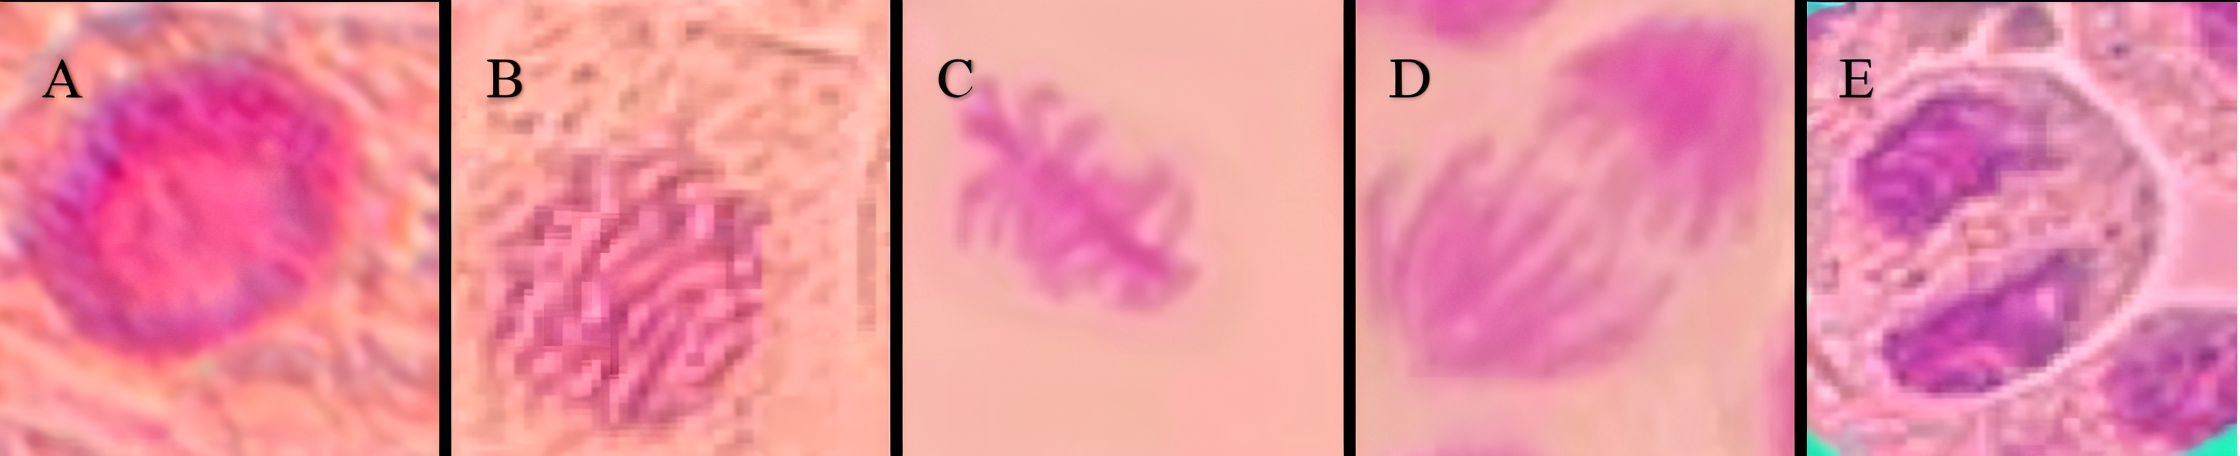
Figure 3. Normal Dividing Cells: (A) Normal interphase cell, (B) Normal Prophase cell, (C) Normal metaphase cell, (D) Normal anaphase cell, (E) Normal Telophase cell
Table (2):
ANOVA for Mitotic Index
Source of Variation |
Degree of Freedom (Df) |
A sum of Squares (SS) |
Mean of squares (MS) |
P-value |
|---|---|---|---|---|
Between Groups |
3.00 |
11.70 |
3.90 |
0.01 |
Within Groups |
8.00 |
4.06 |
0.51 |
|
Total |
11.00 |
15.76 |
Table (3):
Tukey Test Analysis of Mitotic Index Between the Four Different Groups (Control, Low, Standard, High)
Treatment pairs |
Tukey HSD P-value |
Tukey HSD inference |
|---|---|---|
Control Vs Low |
0.47 |
Insignificant |
Control Vs Standard |
0.51 |
Insignificant |
Control Vs High |
0.10 |
Insignificant |
Low Vs Control |
0.89 |
Insignificant |
Low Vs High |
0.01 |
P
|
Standard Vs High |
0.01 |
P
|
The results indicate that most CA observed were stickiness, bridge, multinucleated, multipolar anaphase, disturbed metaphase, disturbed prophase, and disturbed anaphase (Figure 4 and 5).
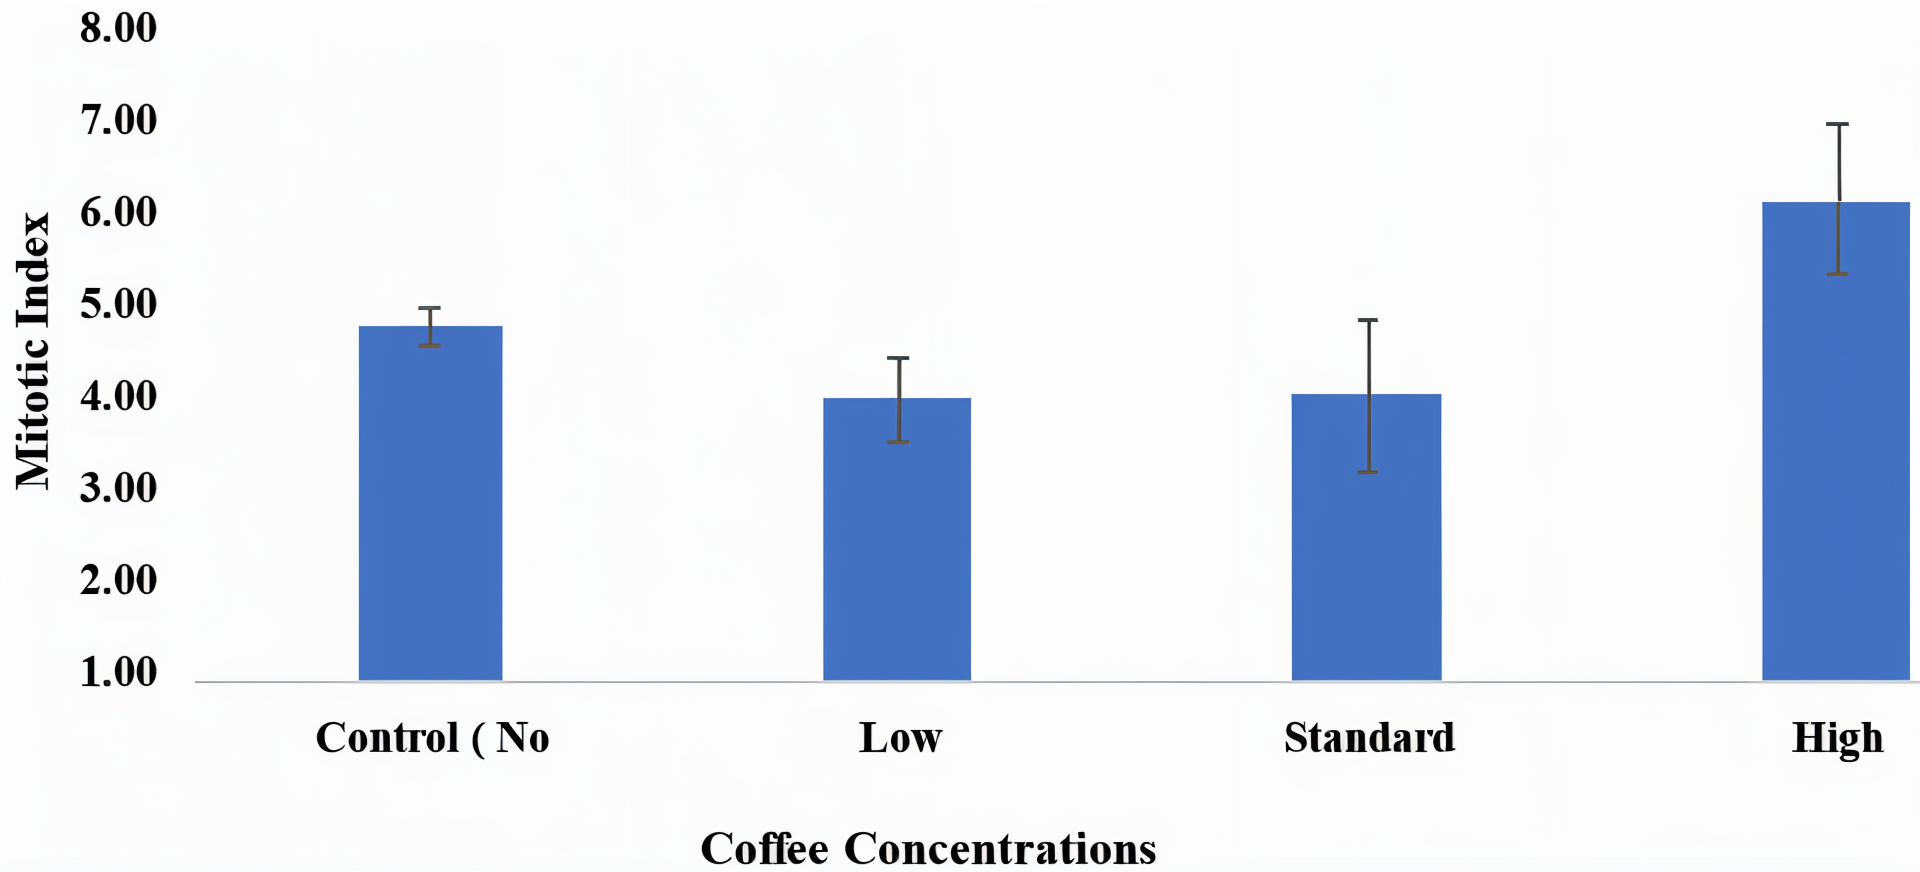
Figure 4. The Average MI at Different Coffee Levels
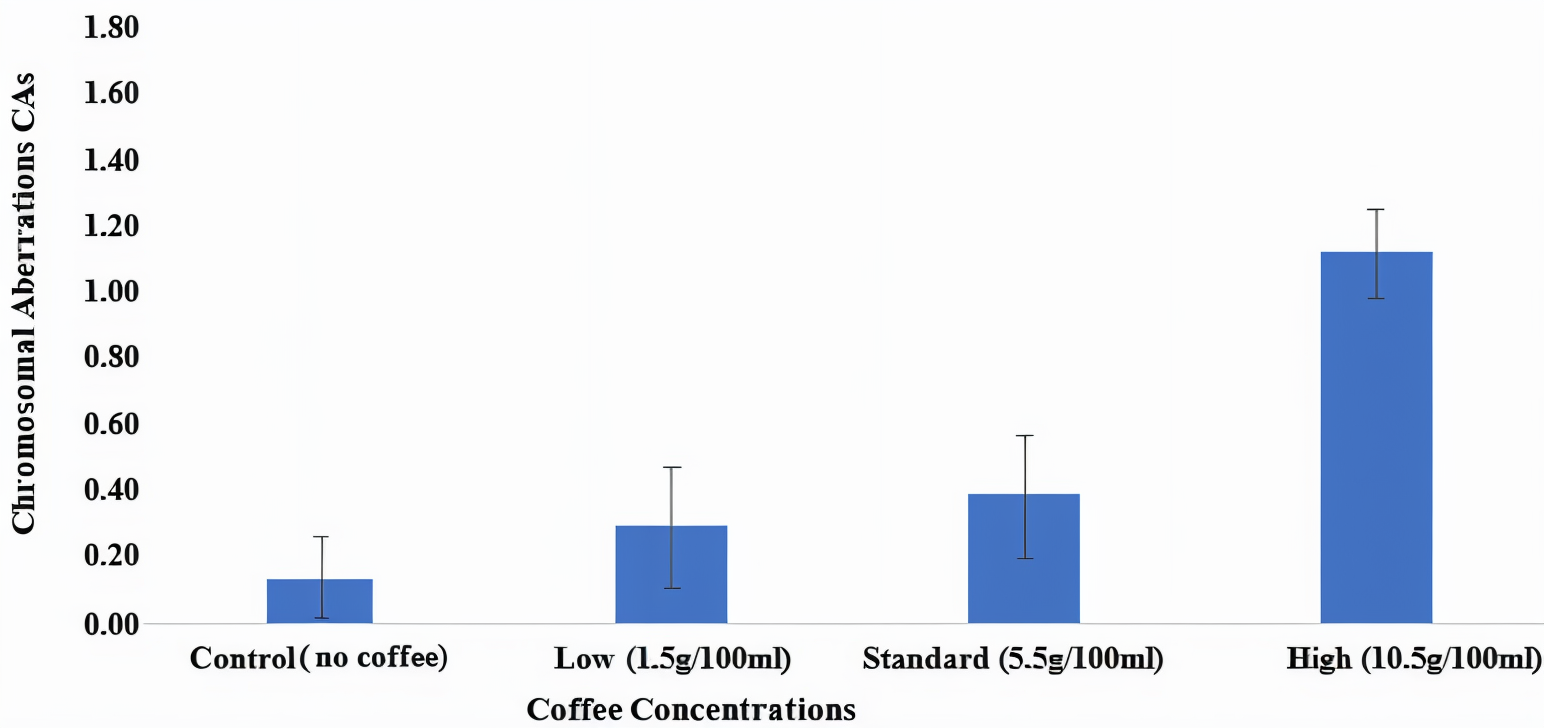
Figure 5. The Average CA at Different Coffee Levels
An insignificant decrease in MI was observed in meristem cells at low and standard levels when related to the control group. However, the MI surged at a high level when related to the control group. Furthermore, there was a noticeable, gradual increase in the CA value with increasing coffee levels.
When Allium cepa roots were treated with three different levels of coffee (low, standard, and high) the chromosomal deviations were 0.40 ± 0.25, 0.52 ± 0.25, and 1.52 ± 0.19, respectively as related to the control group, which was 0.19 ± 0.17. It was clear that the rate of abnormal cell division surged upon increasing the level of coffee. On the other hand, the MI at the lower level of coffee treatment was found to be 3.47 ± 0.51, while in the standard level, it was 3.51 ± 0.93 and 5.91 ± 0.92 in the high level. However, it was 4.35 ± 0.24 in the control group.
This experiment was replicated three times. Based on the statistical analysis using ANOVA and Tukey test analysis by Microsoft Excel. We observed that there were statistically significant differences (P < 0.05) in MI between (low and high) and (standard and high) levels. ANOVA result shows no significant differences in MI between the other treatments. The results of Tukey pairwise analysis for CA which show highly significant differences in CAs between the high level and all the other levels (Table 4, 5, 6 and 7).
Table (4):
Chromosomal abnormalities induced by coffee in root tip cells of Allium Cepa L.
Different Levels of Coffee |
Control (No Coffee) |
Low (1.5 g/100 ml) |
Standard (5.5 g/100 ml) |
High (10.5 g/100 ml) |
|---|---|---|---|---|
CA in the 1st Replicate |
0.00% |
0.55% |
0.81% |
1.54% |
CA in the 2nd Replicate |
0.31% |
0.11% |
0.42% |
1.69% |
CA in the 3rd Replicate |
0.27% |
0.53% |
0.34% |
1.32% |
Mean ± SD |
0.19 ± 0.17 |
0.40 ± 0.25 |
0.52 ± 0.25 |
1.52 ± 0.19 |
Table (5):
One-Way Analysis of Variance (ANOVA) For CA
Source of Variation |
Degree of Freedom (Df) |
Sum of Squares (SS) |
Mean of Squares (MS) |
P-value |
|---|---|---|---|---|
Between Groups |
3 |
3.13 |
1.04 |
0.00 |
Within Groups |
8 |
0.38 |
0.05 |
|
Total |
11 |
3.51 |
Table (6):
Tukey test analysis of ca between the four different groups (control, low, standard, high)
Treatment pairs |
Tukey HSD P-value |
Tukey HSD inference |
|---|---|---|
Control Vs Low |
0.65 |
Insignificant |
Control Vs Standard |
0.30 |
Insignificant |
Control Vs High |
0.00 |
**P
|
Low Vs Control |
0.87 |
Insignificant |
Low Vs High |
0.00 |
**P
|
Standard Vs High |
0.00 |
**P
|
Table (7):
Spectrophotometer analysis of P. aeruginosa growth
Level/time |
30 min |
60 min |
90 min |
120 min |
150 min |
180 min |
|---|---|---|---|---|---|---|
Control |
0.05 |
0.07 |
0.12 |
0.19 |
0.41 |
0.59 |
Low (3 mg/ml) |
0.08 |
0.06 |
0.07 |
0.11 |
0.22 |
0.41 |
Standard (12.5 mg/ml) |
0.05 |
0.03 |
0.03 |
0.08 |
0.11 |
0.23 |
High (20 mg/ml) |
0.06 |
0.10 |
0.14 |
0.24 |
0.37 |
0.64 |
Spectrophotometer analysis
Figure 6 illustrates the greatest decline in the growth of P. aeruginosa when coffee was at the standard level (12.5 mg/ml) during all 3 hours of incubation. In addition, the inhibitory effect of coffee was also observed in the lowest level (3 mg/ml). However, the high level of coffee (20 mg/ml) may accelerate the growth rate of bacteria linked to the control. Generally, the low level of coffee extract indicates its inhibitory effect.
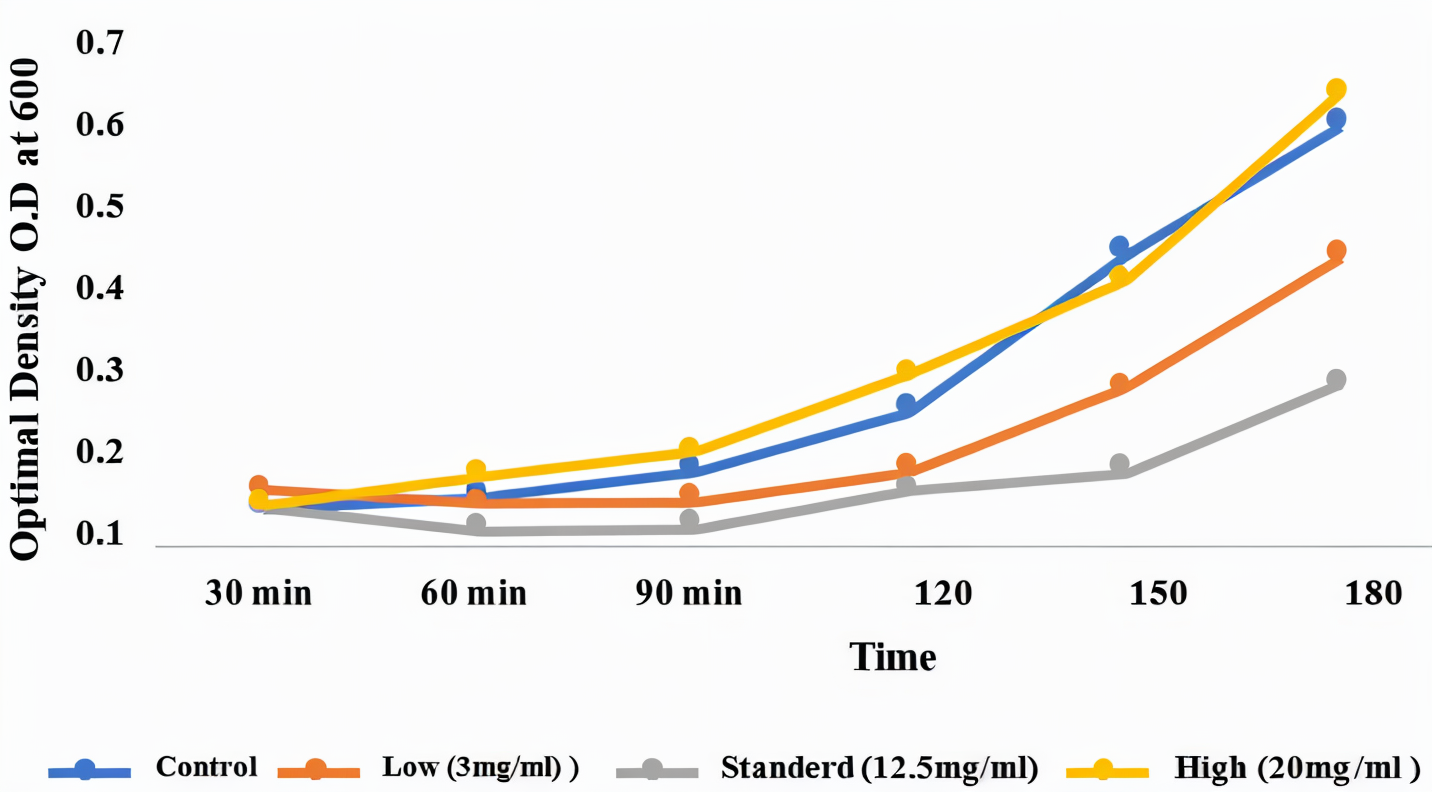
Figure 6. The growth rate of P. aeruginosa. The x-axis measures the time, and the y-axis measures the growth rate with absorbance. The blue curve is the control group, the orange is 3 mg/ml coffee, the grey is 12.5 mg/ml, and the yellow is 20 mg/ml
B. subtilis had the fastest growth rate when coffee at a high level (20 mg/ml) was added to its media, which indicates its resistance to coffee. The following levels were the standard level (12.5 mg/ml) and then the control group, respectively. While the lowest level of coffee (3 mg/ml) experienced a slower growth rate than all of the other groups (Figure 7).
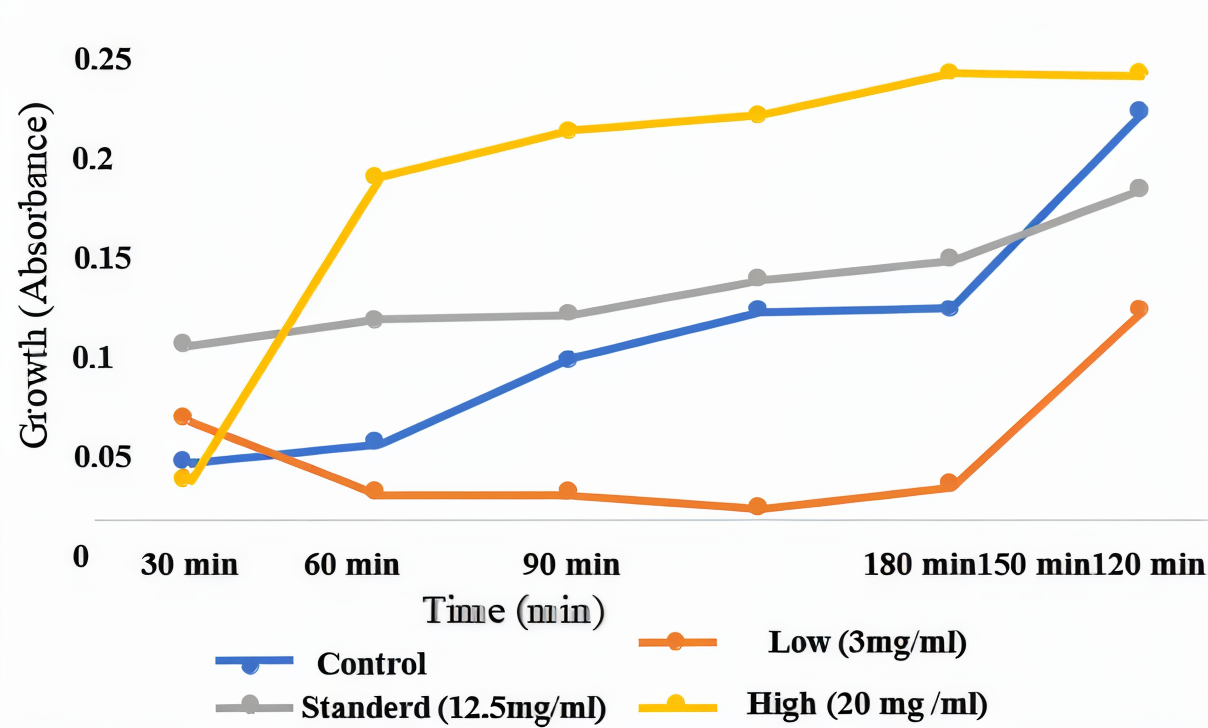
Figure 7. The growth rate of bacteria B. subtilis. The x-axis measures the time, and the y-axis measures the growth rate with absorbance. The blue curve is the control group, the orange is 3 mg/ml coffee, the grey is 12.5 mg/ml, and the yellow is 20 mg/ml
Antibacterial activity
Another technique was used to govern the effect of the antibacterial activity of coffee extract. In addition to P. aeruginosa and B. subtilis that were used in OD, S. aureus was used to investigate the effect of coffee by the agar well method. The results showed that coffee extract has antibacterial activity on two bacterial isolates P. aeruginosa and S. aureus at 12.5 mg/ml and 20 mg/ml however, the inhibition zone showed a high impact on bacterial growth at 20 mg/ml instead of 3 mg/ml and that was after incubation for 24 h. B. subtilis was resistant to the coffee extract (Figure 8 and 9).
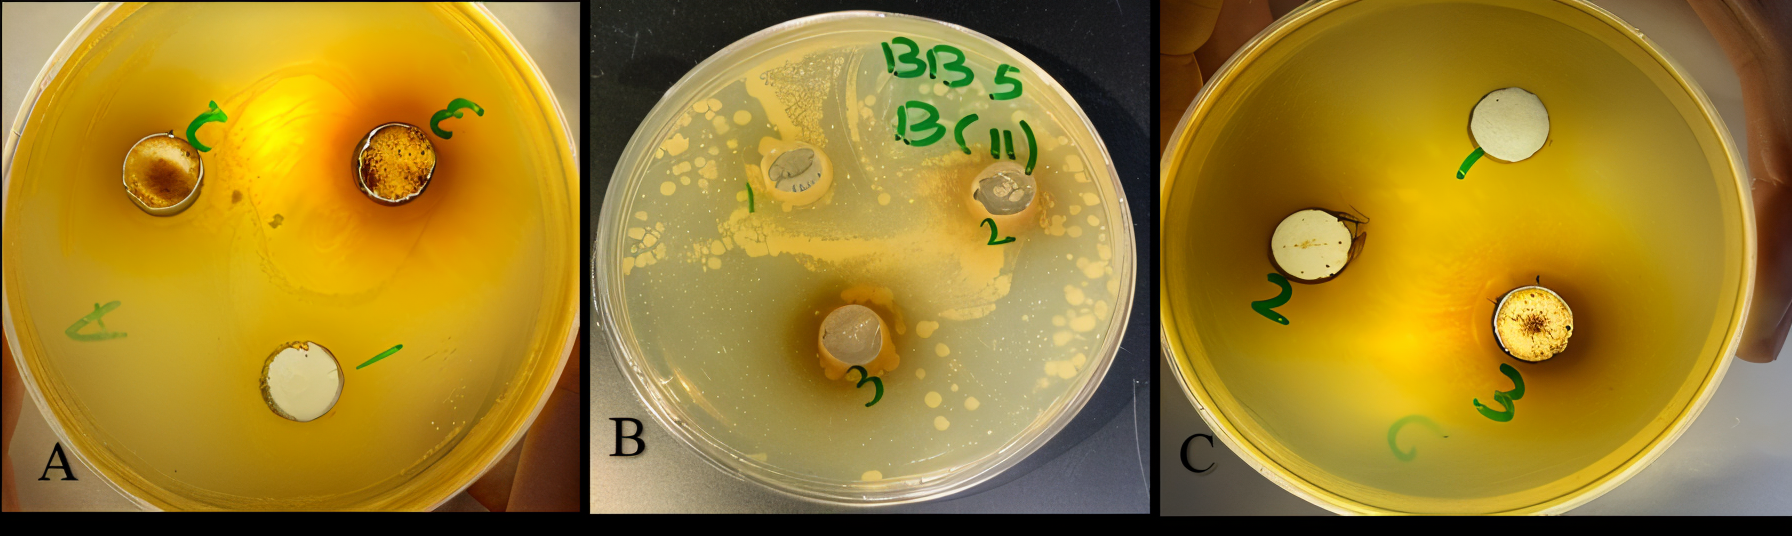
Figure 8. The Effect of coffee extract on bacterial growth is indicated by the agar well method. (A) P. aeruginosa, (B) B. subtilis, (C) S. aureus
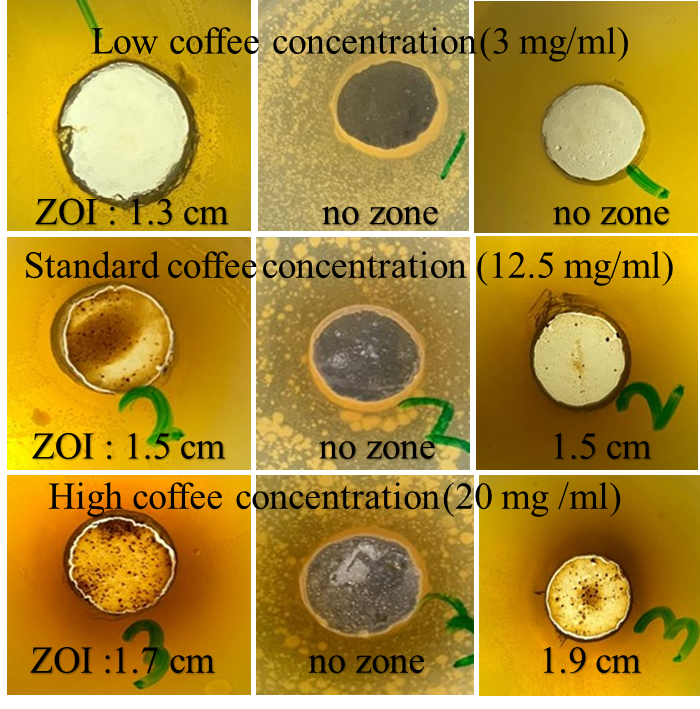
Figure 9. The zone diameter size for each bacterium affected by coffee with three different levels
In vivo, the Allium cepa test is an important test in which the roots grow in direct communication with the substance of interest, agreeing on the estimate of possible DNA damage in humans.36 In this study, the test allows for the evaluation of various genetic endpoints that arise as a result of coffee consumption. Mitotic index (MI) is an established evaluation of cytotoxicity in all organisms. The current results indicate that coffee induces alterations in the genetic material of the meristematic region. These alterations are contingent upon the level used. At the low and standard levels, no significant increase was detected in CA, which indicates that coffee has no evident harmful effect if consumed at these levels (1.5 g/100 ml, 5.5 g/100 ml). The elevated CA at the high level of coffee is per the surged MI, which is a result of the increase in abnormal cells at telophase and metaphase, hence an increase in the total number of cells.37 The most CA were stickiness and multinuclei. This elevation in CA suggests that the high level of coffee (10.5 g/100 ml) is genotoxic to the A. cepa cells. The genotoxicity of coffee is proven in human cells as well. From the present study, it is clear that high levels of coffee are harmful to health, and its intake must be avoided. The damage caused by coffee can be related to its numerous constituents and acidity (pH 4.5) since low pH can decrease the metabolic rate and the body’s antioxidant defenses.38
Coffee at a high level (10.5 g/100 ml) induced different kinds of CA. To assess chromosomal abnormalities employing the A. cepa test, various forms of CAs are resolute at separate stages of mitosis. The majority of CAs observed in this study were sticky chromosomes, chromosome bridges, and multinuclei. Stickiness is defined as the clumping of chromosomes at any stage of mitosis and is presumed to be derived from the defective functioning of a certain protein required for chromatid segregation. Chromosomal stickiness could also be associated with a rise in chromosomal condensation and contraction or rather from the depolymerization of DNA and nucleoprotein partial dissolution. Stickiness is irreversible, and it represents high toxicity.¹² Chromosomal bridges are considered to be clastogenic and are associated with chromatid and chromosomal breaks. Binucleated cells are regarded as the inhibition of cytokinesis during any stage of the cellular cycle. The inability of the cell plate to form in binucleated cells evokes the multinucleated state. Micronuclei are small nuclei formed whenever a chromosome or a chromosome fragment is not joined into one of the daughter nuclei during cell division.39 The present study revealed that coffee proved detrimental unless consumed at moderate levels (between 1.5-5.5 g/100 ml). Some of the positive effects attributed to coffee are its ability to eradicate bad cholesterol (LDL) from the bloodstream as well as decreasing the risk of cardiovascular diseases. However, the addition of cream or sugar may counteract the positive effects of coffee. We recommend that future studies also test different coffee levels and exposure times. Several studies suggest that there is an excellent association between chromosome abnormalities found in root-tip systems and those found in mammalian cell systems. There is also a good association with mutagenic activity. Correspondingly, plant and animal chromosomes have a strong resemblance in both morphology and in response to treatment with mutagenic substances.40
Coffee may potentially be a potent antibacterial agent against some bacteria because of its wide availability, inexpensiveness, and because it is only detrimental to humans at high levels. Among the three bacteria used for this research, P. aeruginosa was the most susceptible to the activity of coffee, while B. subtilis exhibited resistance to coffee.41 The action of antimicrobial substances takes place in several ways, such as selective toxicity, inhibition of cell membrane synthesis and function, and inhibition of protein and DNA synthesis by blocking the incorporation of thymidine and adenine. Moreover, caffeine enhances genotoxicity. Resistance to coffee has been found in many bacteria due to the production of a caffeine-degrading enzyme.42
Previous studies on some Gram-negative bacilli bacteria have revealed that caffeine inhibits the synthesis of DNA and impairs RNA and protein synthesis.43 This can be the reason for the non-viability of P. aeruginosa cells upon exposure to coffee and lysis of different bacterial species. Following the results of this research, coffee could be a real antimicrobial agent against some bacteria.44 However, the effect varies between one type of bacteria and another, therefore, further research needs to be conducted to specify which species will be affected by coffee the most.45 The growth of B. subtilis surged upon the addition of coffee as a result of the usage of caffeine as a nutrient source and the transformation of caffeine to nontoxic derivatives.46 Future studies should also test other bacteria because all the bacteria tested in this test were bacilli.47 In support of the results obtained from OD bacteria, B. subtilis demonstrated no zone, which suggests that coffee did not exhibit any inhibitory effect.48 In contrast, P. aeruginosa and S. aureus demonstrated a clear zone, which reflects the antibacterial effect of coffee.49 Numerous factors may affect the antibacterial activity of coffee (the degree of roast, coffee type, coffee level, and extract preparation).50 Antioxidants such as chlorogenic acid and alkaloids such as trigonelline have been associated with the antibacterial activity of coffee.
This study explored the dual biological effects of Coffea arabica, specifically its cytological impact on Allium cepa root tips and antibacterial activity against P. aeruginosa, S. aureus, and B. subtilis. Increasing coffee levels were associated with a rise in CA, particularly at higher levels, indicating its cytotoxic potential. The MI showed level-dependent variations, decreasing at lower levels but significantly increasing at higher ones. In antibacterial assessments, coffee extract demonstrated the strongest inhibitory effect at a level of 12.5 mg/ml, highlighting its potential as a moderate antibacterial agent. However, higher levels (20 mg/ml) occasionally promoted bacterial growth, suggesting a complex interaction influenced by level. The study also revealed high coffee consumption among young adults, with Turkish coffee being the preferred form, and varying levels of awareness regarding caffeine’s health implications. Overall, the findings confirm that coffee exhibits cytotoxic effects at elevated levels in plant cells and moderate antibacterial properties at optimal levels. These results suggest potential applications for coffee as a natural bioactive agent in microbial management while also emphasizing the importance of moderate consumption for health benefits. Future research should investigate the antimicrobial potential of higher caffeine levels to further elucidate its efficacy.
ACKNOWLEDGMENTS
The authors would like to thank the R&D Department of the Taibah University for the encouragement and support.
CONFLICT OF INTEREST
The authors declare that there is no conflict of interest.
AUTHORS’ CONTRIBUTION
Both authors listed have made a substantial, direct and intellectual contribution to the work, and approved it for publication.
FUNDING
None.
DATA AVAILABILITY
All datasets generated or analyzed during this study are included in the manuscript.
ETHICS STATEMENT
Not applicable.
- Nawrot P, Jordan S, Eastwood J, Rotstein J, Hugenholtz A, Feeley M. Effects of caffeine on human health. Food Addit Contam. 2003;20(1):1-30.
Crossref - Pawar P, Bikkad S, Kurhade S, Kadbane S. Evaluation of antibacterial activity of caffeine. Int J Res Ayurveda Phar. 2011;2(4):1354-1357.
- Lebeau PF, Byun JH, Platko K, Saliba P, Sguazzin M, MacDonald ME, Paré G, Steinberg GR, Janssen LJ, Igdoura SA, Tarnopolsky MA. Caffeine blocks SREBP2-induced hepatic PCSK9 expression to enhance LDLR-mediated cholesterol clearance. Nature communications. 2022;13(1):770.
Crossref - Słoczyńska K, Powroźnik B, Pękala E, Waszkielewicz AM. Antimutagenic compounds and their possible mechanisms of action. J Appl Genetics. 2014;55(2):273-285.
Crossref - Cabaravdic M. Induction of chromosome aberrations in the Allium cepa test system caused by the exposure of cells to benzo (a) pyrene. Med Arh. 2010;64(4):215-8.
- Cowan MM. Plant products as antimicrobial agents. Clinical Microbiology Reviews. 1999;12(4):564-82.
- Maity S, Chatterjee A, Guchhait R, De S, Pramanick K. Cytogenotoxic potential of a hazardous material, polystyrene microparticles on Allium cepa L. Journal of Hazardous Materials. 2020;385:121560.
- Bonciu E, Firbas P, Fontanetti CS, et al. An evaluation for the standardization of the Allium cepa test as cytotoxicity and genotoxicity assay. Caryologia. 2018;71(3):191-209.
Crossref - Amor CJR, Abaya RAA, Alcera CMA, et al, In vivo Antibacterial Activity of Biosynthesized Selenium Nanoparticles using a Zebrafish Model. Asian Journal of Biological and Life Sciences, 2024;13(2):338-346.
Crossref - McFarland standards. Wikipedia. Available at:https:// en.wikipedia.org/wiki/McFarland_standards. Accessed on January 1, 2025.
- McFarland Standard. Dalynn Biologicals. https:// www.dalynn.com/dyn/ck_assets/files/tech/TM53.pdf. Accessed on January 1, 2025.
- Ojodomo B, Ashar SJ. Isolation and Identification of possible pathogenic bacteria on carrots sold at community market, Ahmadu Bello University, Zaria. bioRxiv. 2023:2023-09.
Crossref - Preparation of 0.5 McFarland Turbidity Standards. https://microbiologyclass.net/preparation-of-0-5- mcfarland-turbidity-standards/. Accessed on January 1, 2025.
- Zhang Y, Zhang S, Xu L. The pivotal roles of gut microbiota in insect plant interactions for sustainable pest management. npj Biofilms and Microbiomes. 2023;9(1):66.
- Donnelly RC, Nippert JB, Wedel ER, Ferguson CJ. Grass leaf structural and stomatal trait responses to climate gradients assessed over the 20th century and across the Great Plains, USA. AoB Plants. 2024;16(5):plae055.
Crossref - Roth E, Schwenninger SM, Eugster-Meier E, Lacroix C. Facultative anaerobic halophilic and alkaliphilic bacteria isolated from a natural smear ecosystem inhibit Listeria growth in early ripening stages. Int J Food Microbiol. 2011;147(1):26-32.
- Yi L, Du Y, Mao C, Li J, Jin M, Sun L, Wang Y. Immunogenicity and protective ability of RpoE against Streptococcus suis serotype 2. Journal of Applied Microbiology. 2021;130(4):1075-1083.
Crossref - Ahad HA, Haranath C, Tarun K, Krishna JV, Chandana N, Indrani B. Immuno-boosters as health accelerants to tackle viral infections. Asian Journal of Pharmaceutical Research. 2021;11(3):212-6.
Crossref - Ruiz GL, Jiménez-Pitre I, Molina-Bolívar G. Bacteriological Quality of the Mangrove Oyster (Crassostrea rhizophorae) in the Swamp of Mestizo-Cordoba (Colombia). Indian Journal of Science and Technology. 2018;11(25):1-6.
Crossref - Kyei L, Piedl K, Menegatti C, Miller EM, Mevers E. Discovery of biofilm inhibitors from the microbiota of marine egg masses. Journal of Natural Products. 2024;87(6):1635-42.
- Ahad HA, Rani EM, Kranthi G, Gupta PR, Reddy MN, Prakash G. Spectrophotometric Determination of Cefadroxil in Cefadroxil Tablets by Bromination Method. Analytical Chemistry Letters. 2011;1(2):185-188.
- Ahmad B, Ali J. Physiochemical, minerals, phytochemical contents, antimicrobial activities evaluation and fourier transform infrared (FTIR) analysis of Hippophae rhamnoides L. leaves extracts. African Journal of Pharmacy and Pharmacology. 2013;7(7):375-388.
Crossref - Suh GA, Lodise TP, Tamma PD, et al. Considerations for the use of phage therapy in clinical practice. Antimicrobial Agents and Chemotherapy. 2022;66(3):e02071-21.
- Patel AK, Patel KK, Patel KR, Shah S, Dileep P. Time trends in the epidemiology of microbial infections at a tertiary care center in west India over last 5 years. J Assoc Physicians India. 2010;58(58):37-40.
- Zwietering MH, Gorris LG, Farber J. Campylobacter, health impact, performance objectives and effectiveness of sampling plans. InIAFP 2019 Annual Meeting Abstracts 2019 (Vol. 82, pp. 16-16).
- Guzmà L, Ramirez BS, Maribel CF, Pescador MG, Cruz FJ. Low accuracy of the McFarland method for estimation of bacterial populations. African Journal of Microbiology Research. 2018;12(31):736-740
- Lee K, Cobanli SE, Robinson BJ, Wohlgeschaffen G. Application of Microbiological Methods to Assess the Potential Impact of Produced Water Discharges. In: Lee, K., Neff, J. (eds) Produced Water. Springer, New York, NY. 2011:353-73.
Crossref - Parker SJ, Watkins PE. Experimental models of gram-negative sepsis. Br J Surg. 2001;88(1):22-30.
Crossref - Wang C, Zheng C. Using Caenorhabditis elegans to model therapeutic interventions of neurodegenerative diseases targeting microbe-host interactions. Front Pharmacol. 2022;13:875349.
Crossref - Yadav M, Kaushik M, Roshni R, et al. Effect of green coffee bean extract on Streptococcus mutans count: A randomised control trial. J Clin Diagn Res: JCDR. 2017;11(5):ZC68-ZC71.
Crossref - Ortega HE, Ferreira LL, Melo WG, et al. Antifungal compounds from Streptomyces associated with attine ants also inhibit Leishmania donovani. PLOS Negl Trop Dis. 2019;13(8):e0007643
- Wegener A, Damborg P, Guardabassi L, et al. Specific Staphylococcal cassette chromosome mec (SCC mec) types and clonal complexes are associated with low-level amoxicillin/clavulanic acid and cefalotin resistance in methicillin-resistant Staphylococcus pseudintermedius. J Antimicrob Chemother. 2020;75(3):508-511.
- Nagesh, Ahad HA, Pilli Y, Bhanubee, Prathima. Phytochemical and hypoglycemic evaluation of Gynandropsis gynandra root extract. Journal of Biologically Active Products from Nature. 2012;2(1):38-45.
Crossref - Haranath C, Reddy JL, Ahad HA, Reshma T, Shubha BN. Aquasomes: A novel approach for the delivery of bioactive molecules. J Med Pharm Allied Sci. 2022;11(5):5325-5330
- Arena D, Ammar HB, Major N, et al. Diversity of the Morphometric and Biochemical Traits of Allium cepa L. Varieties. Plants. 2024;13(13):1727.
- Azizah E, Ardiyansah A, Fauzi I. Keragaan karakter o-agronomi beberapa aksesi bawang merah (Allium cepa L.) lokal jawa berdasarkan analisis multivariat. Jurnal AGRO. 2025;11(2):154-64.
Crossref - Kumari M, Khan SS, Pakrashi S, Mukherjee A, Chandrasekaran N. Cytogenetic and genotoxic effects of zinc oxide nanoparticles on root cells of Allium cepa. Journal of Hazardous Materials. 2011;190(1-3):613-21.
Crossref - Yousuf J, Raina A, Rasik S, Reshi ZA, Shahwar D. Comparative effects of caffeine and lead nitrate on the bio-physiological and yield associated traits of lentil (Lens culinaris Medik.). Heliyon. 2023;9(6).
Crossref - Natarajan TG, Ganesan N, Carter-Nolan P, Tucker CA, Shields PG, Adams-Campbell LL. γ-Radiation-induced chromosomal mutagen sensitivity is ssociated with breast cancer risk in African-American Women: Caffeine modulates the outcome of mutagen sensitivity assay. Cancer Epidemiology Biomarkers & Prevention. 2006;15(3):437-442.
Crossref - Ozkan O, Gul S. In vitro antimutagenicity of Allium tuncelianum ethanol extract against induction of chromosome aberration by mutagenic agent mitomycine C. Kafkas Univ Vet Fak Derg. 2013;19(2):259-262.
Crossref - Celik TA. Potential genotoxic and cytotoxic effects of plant extracts. In: Arup Bhattacharya eds. A compendium of essays on alternative therapy. inTech eBook. 2012:233-50.
Crossref - Okorie Asita A, Moramang S, Rants’o T, Magama S. Modulation of mutagen-induced genotoxicity by vitamin C and medicinal plants in Allium cepa L. Caryologia. 2017;70(2):151-65.
Crossref - Islam MT, Quispe C, Mubarak MS, et al. Protective effects of natural products and their derivatives on genetic material: a critical review. Records of Natural Products. 2021;15(6):433-462.
Crossref - Yalçın E, Macar TK, Macar O, Çavuşoğlu K. Protective Role of Green Coffee against Cytotoxic and Genotoxic Effects of Food Dye Tartzanine in A. cepa L. Root Tip Cells. Akademik Gıda. 2021;19(1):49-58.
Crossref - Lyu G, Li D, Li S, Ning C, Qin R. Genotoxic effects and proteomic analysis on Allium cepa var. agrogarum L. root cells under Pb stress. Ecotoxicology. 2020;29:959-972.
Crossref - Alias C, Feretti D, Viola GV, et al. Allium cepa tests: A plant-based tool for the early evaluation of toxicity and genotoxicity of newly synthetized antifungal molecules. Mutation Research/Genetic Toxicology and Environmental Mutagenesis. 2023;889:503654.
- Edenharder R, Sager JW, Glatt H, Muckel E, Platt KL. Protection by beverages, fruits, vegetables, herbs, and flavonoids against genotoxicity of 2-acetylaminofluorene and 2-amino-1-methyl-6-phenylimidazo [4, 5-b] pyridine (PhIP) in metabolically competent V79 cells. Mutation Research/Genetic Toxicology and Environmental Mutagenesis. 2002;521(1-2):57-72.
Crossref - Lerda D, Miotti E, Litterio N. Detection and Genotoxicity of Ochratoxin A (OTA) in Raisins. European Scientific Journal (ESJ). 2017;13(6).
Crossref - Mandala P, Raia A, Mishra S, Tripathi A, Das M. Mutagens in Food. Mutagenicity: Assays and Applications. 2018:133-160.
Crossref - Dubey AK, Sharma M, Parul, Raut S, Gupta P, Khatri N. Healing wounds, defeating biofilms: Lactiplantibacillus plantarum in tackling MRSA infections. Front Microbiol. 2023;14:1284195.
Crossref
© The Author(s) 2025. Open Access. This article is distributed under the terms of the Creative Commons Attribution 4.0 International License which permits unrestricted use, sharing, distribution, and reproduction in any medium, provided you give appropriate credit to the original author(s) and the source, provide a link to the Creative Commons license, and indicate if changes were made.