

ISSN: 0973-7510
E-ISSN: 2581-690X
Bacterial Extracellular vesicles or BEVs are infinitesimal bi-layered lipid vesicles secreted from non-pathogenic and pathogenic bacteria to be used as a targeted drug-delivering system (DDS). Our study compared the biophysical and molecular characteristics of OMVs isolated from E. coli BL21 (DE3) transformed with the plasmid pET28a-His6-Signal Anchoring Green Fluorescent Protein (SAGFP) grown in Luria-Bertani and M9 minimal media to select the best medium for the growth of engineered bacterial OMVs. Isolation of BEVs using the ultracentrifugation method yielded bacterial vesicles with smaller mean sizes and excellent recovery of vesicle morphology. The evaluation of the size distribution profile of BEVs using the Dynamic light-scattering technique assessed for vesicle size with particle aggregation ranging from 20-750 nm. 3D interactive surface plots and particle size-distribution analyses of BEVs obtained from their HR-TEM results depicted slight morphological dissimilarities. Investigation on SAGFP cargo sort into vesicles using fluorescence spectrophotometry, and fluorescent microscopy solidates the expression of SAGFP in OMVs isolated from transformed bacterial culture when the expression was induced with 10 mM Isopropyl-D-1-thiogalactopyranoside (IPTG) at OD600 = 0.6 in both media. Isolation of engineered BEVs (eBEVs) grown in LB media had higher vesicle yield and good particle recovery that could be directly incorporated into targeted therapeutics. However, BEVs grown in minimal media had good particle purity with increased protein concentration but yielded vesicles with lower particle recovery. This comparative investigation should help analyze the efficacy and characteristics of engineered BEVs grown in two different media and provide a robust and straightforward method to engineer BEVs. These engineered BEVs could be utilized as both fluorescent probes and a drug-delivering vehicle in targeted therapeutics.
Bacterial Extracellular Vesicles, Green Fluorescent Protein, Particle Size Distribution, Drug-delivery Vehicle, Targeted Therapeutics
Extracellular vesicles are delicate nanoscopic biomolecules with the ability to transport the cellular contents between two neighboring cells.1-4 The soluble products like lipo glycans, short-chain fatty acids (metabolites), nucleic acids, quorum-sensing peptides, proteins, and extracellular vesicles (membrane vesicles) secreted from bacteria help the bacterial cells to interact with the host and the other bacterium.5,6 Both non-pathogenic and pathogenic bacteria release spherically enveloped membranous vesicles of diameter 20 to 400 nm that carry and circulate the cellular cargo of parental bacterium inside the extracellular-microenvironment.7,8 The biochemical and proteomic evaluation revealed that BEVs are packed with a diverse cargo of peptidoglycan, nucleic acids, periplasmic proteins, polysaccharides, enzymes, and toxins.8,9 The origin and formation of bacterial extracellular vesicles follow various routes, resulting in distinctive BEV subcategories, with each having unique molecular cargo patterning and biological function.10
The formation of vesicles from Gram-negative bacteria includes two major biogenetic pathways.11 The first pathway forms the OMVs, and the blebbing of the outer membrane surface of the bacterium occurs. The second pathway engenders the formation of explosive outer membrane vesicles and outer inner membrane vesicles (EOMVs and OIMVs) during explosive-cell lysis.12-15 The Gram-negative bacterial cell wall comprises a thin layer of murein (peptidoglycan) -a polymer-like lattice made of amino acids and sugars present in the periplasmic region; in between the outer and inner membrane bilayers. The outer leaflet on the outer membrane region of Gram-negative bacteria consists of endotoxins, also known as lipopolysaccharides. Likewise, the outer membrane also has porin ion channels and several membrane-bound proteins that actuate non-vesicle-mediated communications.16-18 The process of outer membrane blebbing leading to the formation of OMVs in the first biogenetic pathway occurs due to the disassociation of crosslinks connecting the peptidoglycan layer and the outer membrane region. The outer membrane of the Gram-negative bacterial extracellular vesicle is also composed of an inner leaflet of phosphatides (phospholipids).17,18 Of note, the presence of outer and inner leaflets of lipopolysaccharide and phospholipids in the outer membrane of Gram-negative extracellular vesicles is notable for engaging Toll-like-receptor 4 (TLR4).19 The Gram-negative BEV is refined with specific outer membrane proteins like outer membrane porin A (ompA) and other Braun’s lipoproteins (BLP) such as ompC, ompD, phoE, and ompF. Likewise, the periplasmic proteins like AcrA and alkaline phosphatase; virulence factors like invasins and adhesins are also present in the Gram-negative BEVs.20-25
The Gram-negative BEVs are highly competitive because of their ability to effortlessly fuse with the hosts’ cellular membrane, their non-immunogenic transportation or delivery, and their propensity to outmaneuver lysosomes and evade phagocytosis.26,27 Extracellular vesicles are considered the most idealized drug-delivering system due to their applications in targeted therapeutics, diagnosis, and prognosis of various disorders.27-29 The nanosized particles released from bacteria are highly biocompatible, efficient, and less toxic by nature, and as a result, they have been utilized for several therapeutic strategies.30-34 Extracellular vesicles have shown significant potential as novel prospects for intracellular transportation of various therapeutic cargo, including large proteins, RNA, and small synthetic biomolecules.35 To contemplate the use of BEVs in targeted drug delivery and theranostics, we have to be mindful of the molecular and biophysical attributes of bacterial extracellular vesicles.36-38 The characteristic features of these vesicles, including their topology, morphology, size and uniformity, vesicle purity, storage conditions, efficacy, and the method of particle delivery into the targeted cells with an advancement in the medicinal potential of these vesicles play a pivotal role in targeting and engineering BEVs for theranostic purpose.39,40 BEVs can be programmed to alter their cargo sort with the desired molecule of interest.41 Significantly, the modification of BEVs with protein cargo is usually achieved by engineering the cell with a plasmid that encodes and overexpresses the protein of interest fused to a membrane or intraluminal protein naturally sorted into BEVs during their process of biogenesis.42
Approaches for the artificial loading of cargo into extracellular vesicles have evolved and developed in recent times. Techniques like cargo-incubation; transfection-mediated overexpression of molecules of interest, cargo-loading chaperons; and physical treatments including sonication, electroporation, extrusion, dialysis, freeze-thaw, and treatment of surfactants have been taken into the picture to promote cargo-loading efficiency into EVs.43-47 The emergence of techniques to engineer extracellular vesicles for targeted delivery includes Receptor-ligand binding-based delivery, pH gradient-driven targeted delivery, and magnetism-based targeted delivery.48-50 In transfection-mediated loading of cargos, the emergence of a new strategy known as targeted and modular EV-loading (TAMEL) promoted the sorting of cargos into EV by enhancing the expression of cargo-binding molecules via transfection.51 Unlike cargo incubation, the sonication-based cargo loading technique enabled the cargo’s loading capacity, including nanomaterials, proteins, and drugs.46,52 Also, the sonication method efficiently loaded gold nanoparticles into EVs when compared with other techniques.
Similarly, the extrusion-based cargo loading method actuates the genesis of exosome-mimetic nanovesicles (EMNVs).53 Despite its cargo loading potentiality, the sonication approach is not applicable for the large-scale production of cargo-engineered EVs due to its tendency to weaken and damage the integrity of the vesicular membrane.44 Other techniques like electroporation and freeze-thaw treatment also have drawbacks like poor cargo loading capacity and an evident clustering of cargo sort.54 Recent approaches like cellular nanoporation biochip, RGE-Exo-SPION/Cur, lipHA-hEVs, exosome conjugated biomimetic porous-silicon nanoparticles (PSiNPs), and TEV-GIONs have also been developed to engineer extracellular vesicles for targeted DDS.55 Though there are various techniques available and many more are under development, the transformation of recombinant protein into the parental cell is the most robust, typical, direct, and feasible technique available for engineering bacterial extracellular vesicles, as the recombinant protein gets naturally sorted into BEVs during the process of biogenesis. Hence, the drug-delivering capability of extracellular vesicles has drawn increasing attention in EV science and has been considered the most promising medicament strategy in targeting and treating various disorders, including cancer.
In our current study, we compared the molecular and biophysical characteristics of SAGFP cargo-loaded eBEVs (by transforming the plasmid pET28a-His6-SAGFP into the parental cell) grown in LB and minimal media to select an optimal medium for eBEVs genesis. The vesicles secreted from the bacterial culture grown in both mediums were isolated and evaluated for their total yield and proteome. Our study provided the most straightforward method to engineer BEVs and provide insights into the influence of the culture medium on eBEVs biogenesis.
Bacterial cell culture and recombinant protein expression
Inoculum
15 µL of the bacterial stock (E. coli BL21 (DE3) transformed with pET28a-His6-SAGFP) was pre-inoculated into 15 ml LB medium (Himedia® India) (5.0 g/L Yeast extract, 10.0 g/L Tryptone, and 5.0 g/L sodium chloride, pH 7.2) and Minimal Broth, (Himedia® India) (1.0 g/L Dextrose, 1.0 g/L (NH4)2 SO4, 7.0 g/L Dipotassium phosphate, 2.0 g/L Monopotassium phosphate, 0.50 g/L Na3C6H5O7 and 0.10 g/L MgSO4, pH 7.2) with each medium enriched with 50 µg/mL kanamycin, incubated at 37 °C for 16 hours and 1 g in a shaking incubator (ORBITEK® LT, Seigenics Biotech).
Bacterial growth
After 16 hours of incubation, 1 mL from the saturated inoculum was transferred into 100 mL LB and Minimal medium, each enriched with 50 µg/mL kanamycin, in 200 mL flasks, incubated at 37 °C in an orbital shaker at 3 g. Cells were grown until they reached the OD value of 0.6 to induce IPTG for the recombinant protein expression.
IPTG induction
10 mM of IPTG was induced to the transformed bacterial culture when the absorbance measurements at 600 nm reached the OD value of 0.6 in both LB and Minimal media. After induction with IPTG, the cells were incubated at 28 °C and 3 g for 8 hours for better recombinant protein expression.
Isolation of BEVs
After expressing the recombinant protein, the bacterial extracellular vesicles were isolated using the ultracentrifugation (UC) method. The recombinant culture grown in two different media was pre-processed using the serial-centrifugation technique to remove the bacterial cells and other cellular debris. The UC of the bacterial samples was achieved with a TLA-55 fixed angle (45°) rotor of Beckman-Coulter-Optima MAX-XP (California, USA)by spinning the cells at a minimal centrifugal force of 300 g and slowly increasing the force to 2000 g and 10,000 g, thereby pelleting and eliminating the cellular debris.56 The supernatant separated at this phase is subjected to ultracentrifugation at 1,00,000 g for 2 hours at 4 °C. The extracellular vesicles containing the pellet formed after the first UC spin was washed with 1X-PBS and again ultracentrifuged at 1,00,000 g for 2 hours at 4 °C. After the second spin, the pellet formed at the bottom of the tube was resuspended in 50 µl of nuclease-free water (NFW) and stored at -80 °C for characterization studies.
Quantification of BEV yield and proteome
The yield and total proteomic content of extracellular vesicles were quantified using Bradford’s reagent (Himedia® India). The quantification of total proteomic content was performed by lysing the EVs using RIPA lysis buffer (50 mM Tris-HCL, 150 mM Sodium Chloride, 1 mM EDTA, 1% sodium deoxycholate, 1% NP-40 (nonyl phenoxypolyethoxylethanol-40), 0.01% sodium azide, 0.1% SDS) at 95 °C for 10 minutes.57 Similarly, the surface protein content of BEVs was quantified without lysing the vesicles. Both digested and undigested EVs were treated with Bradford reagent (the color change was observed from brown to blue). The absorbance was measured at 595 nm in a UV visible Spectrophotometer (GENESYS 180 UV-Vis Spectrophotometer, Thermo Scientific™). The experimentations were performed in triplicates
(n = 3), and the data was examined using OriginLab Pro and ImageJ software.
Characterization of BEVs
Dynamic Light scattering (DLS)-Particle size distribution analyzer
The particle size of BEVs was determined using the DLS-Particle size analyzer. Dynamic light scattering measurements of engineered BEVs were performed using an SZ-100 Nano Particle Analyzer (Horiba Scientific, Minami-Ku Kyoto, Japan) equipped with a solid-state green laser, functioning at a particular angle of 173 °C. The measurement of particle diameter in the SZ-100 Nano Particle Analyzer ranges from 0.3 nm to 8.0 µm. For particle size distribution analysis, the BEVs were diluted 1:10 times with NFW and vortexed for 5 minutes to achieve a uniform, individual BEV distribution and avoid extracellular particle aggregates. 1 ml from the diluted working stock was loaded onto the solvent-resistant micro cuvettes for analyzing the particle size.
High-Resolution Transmission Electron Microscopy (HRTEM)
The BEVs were imaged using JEM-2100Plus Electron Microscope (Jeol TEM-2100 plus, Tokyo, Japan). The EVs were imaged with a magnification scale of 20 nm to 1 µm with an electromotive force or voltage applied at 220 kV (kilovolts). For visualizing the vesicles under HRTEM, the BEVs were diluted 1:10 times. 5 µl of the diluted sample from the working stock was loaded onto a carbon-supported copper grid (size 200 mesh). The copper grid was incubated at 37 °C for 18 hours before imaging it under HRTEM. No negative staining reagents or fixatives were added to the grid while preparing the BEV samples.
Image analysis of BEVs obtained from HRTEM
3D interactive surface mapping of BEVs was generated from the images acquired from HRTEM. The 3D-surface analysis of BEVs was utilized to create particle-size distribution (PSD) plots for determining the size variation, distribution, and particle morphology of BEVs., The BEV images were constructed using ImageJ software to rebuild the images acquired from HRTEM for analyzing the PSD by measuring their scale and adjusting their threshold values. The surface area of each vesicle was analyzed by measuring their Feret diameter, and surface-volume mean diameter (Sauter mean diameter) with optimal binning and normalized parameters (binning provides an ideal histogram bin width in ImageJ software). The 3D-surface mapping of BEVs was designed by using the interactive 3D-surface plots plugin in ImageJ software. Optimizing the z = xy ratio, surface maxima, and surface minima is essential while constructing an interactive surface plot for BEVs. Nevertheless, other criteria like grid size, Z-scale, smoothing, and perspective angle should be considered while creating accurate 3D mapping BEVs. The grid size was calibrated to 512 nm square area, while the surface maxima and surface minima were optimized to 100% and 0%, respectively. The Z-scale value of 0.20 with a perspective angle of 0.28° and an optimal smoothing score of 8.0 is likely to differentiate between individual BEVs and noise.
SDS-PAGE
The BEV samples were treated with 1X RIPA buffer (ice cold) and thoroughly agitated for 5 minutes. The protein precipitation of lysed BEVs was performed by adding acetone (ice cold) and incubating for 1 hour at -20 °C. The samples were centrifuged at 13,000 g for 30 minutes at 4 °C. The pellet formed at this stage was resuspended with 20 µl of 1x loading dye (Laemmli’s buffer) and loaded onto the SDS-PAGE wells. The SDS-PAGE was performed with 5% stacking gel and 10% separating gel at 150 V. [(10% separating gel: 30% Acrylamide mix, 1.5 M Tris (pH 8.8), 10% SDS, 10% APS (ammonium-persulphate), TEMED); (5% stacking gel: 30% Acrylamide mix, 1.0 M Tris (pH 6.8), 10% SDS, 10% APS, TEMED)]. The gel was stained with a staining solution with Coomassie dye (Coomassie-brilliant blue R-250 (Himedia® India)) to visualize the proteomic profile of BEVs.
Fluorescence measurement of SAGFP-Engineered BEVs
The measurement of fluorescence in eBEVs was performed using a Fluorescence spectrophotometer F-7000 (Hitachi High-Tech GLOBAL, Japan), with a measuring wavelength of 200-750 nm and a self-deozonating 150 W xenon lamp source. The minimal sample loading volume of the Fluorescence spectrophotometer F-7000 is 600 µl (0.6 ml). The recombinant GFP is a fusion protein expressed of Signal anchor from the OM 45 and the GFP with a His-Tag in E. coli. The EVs isolated from bacteria expressing recombinant SAGFP were measured for fluorescent intensity to ensure the SAGFP cargo was sorted into BEVs. Two methods were used to measure fluorescence in engineered BEVs: (i) Measurement of fluorescent intensity on the vesicular surface/lipid membrane surface; and (ii) Measurement of fluorescent intensity of total BEV by lysing them using Triton X-100. The BEVs are treated with 0.1% Triton X-100 (pH-7.4) at room temperature for 30 minutes. Lysed and unlysed BEVs were diluted 1:10 times, and 1 ml from the diluted working stock was loaded onto the cuvette for fluorescence measurement. The BEVs were exited at 488 nm, and the emission of fluorescence was detected at 510 nm.
Quantification of BEV proteome and BEV yield
Quantification of BEVs using Bradford’s protein assay is one of the indirect approaches used for protein quantification. However, the BCA method’s protein analysis had the most reliable connection with the NTA’s particle count evaluation across various vesicle concentrations. Thus, the estimation of proteins using the BCA method and their comparison with the vesicle count can help us understand the influence of the bacterial culture medium.
The graphical representation of BEV protein quantification is depicted in Figure 1.
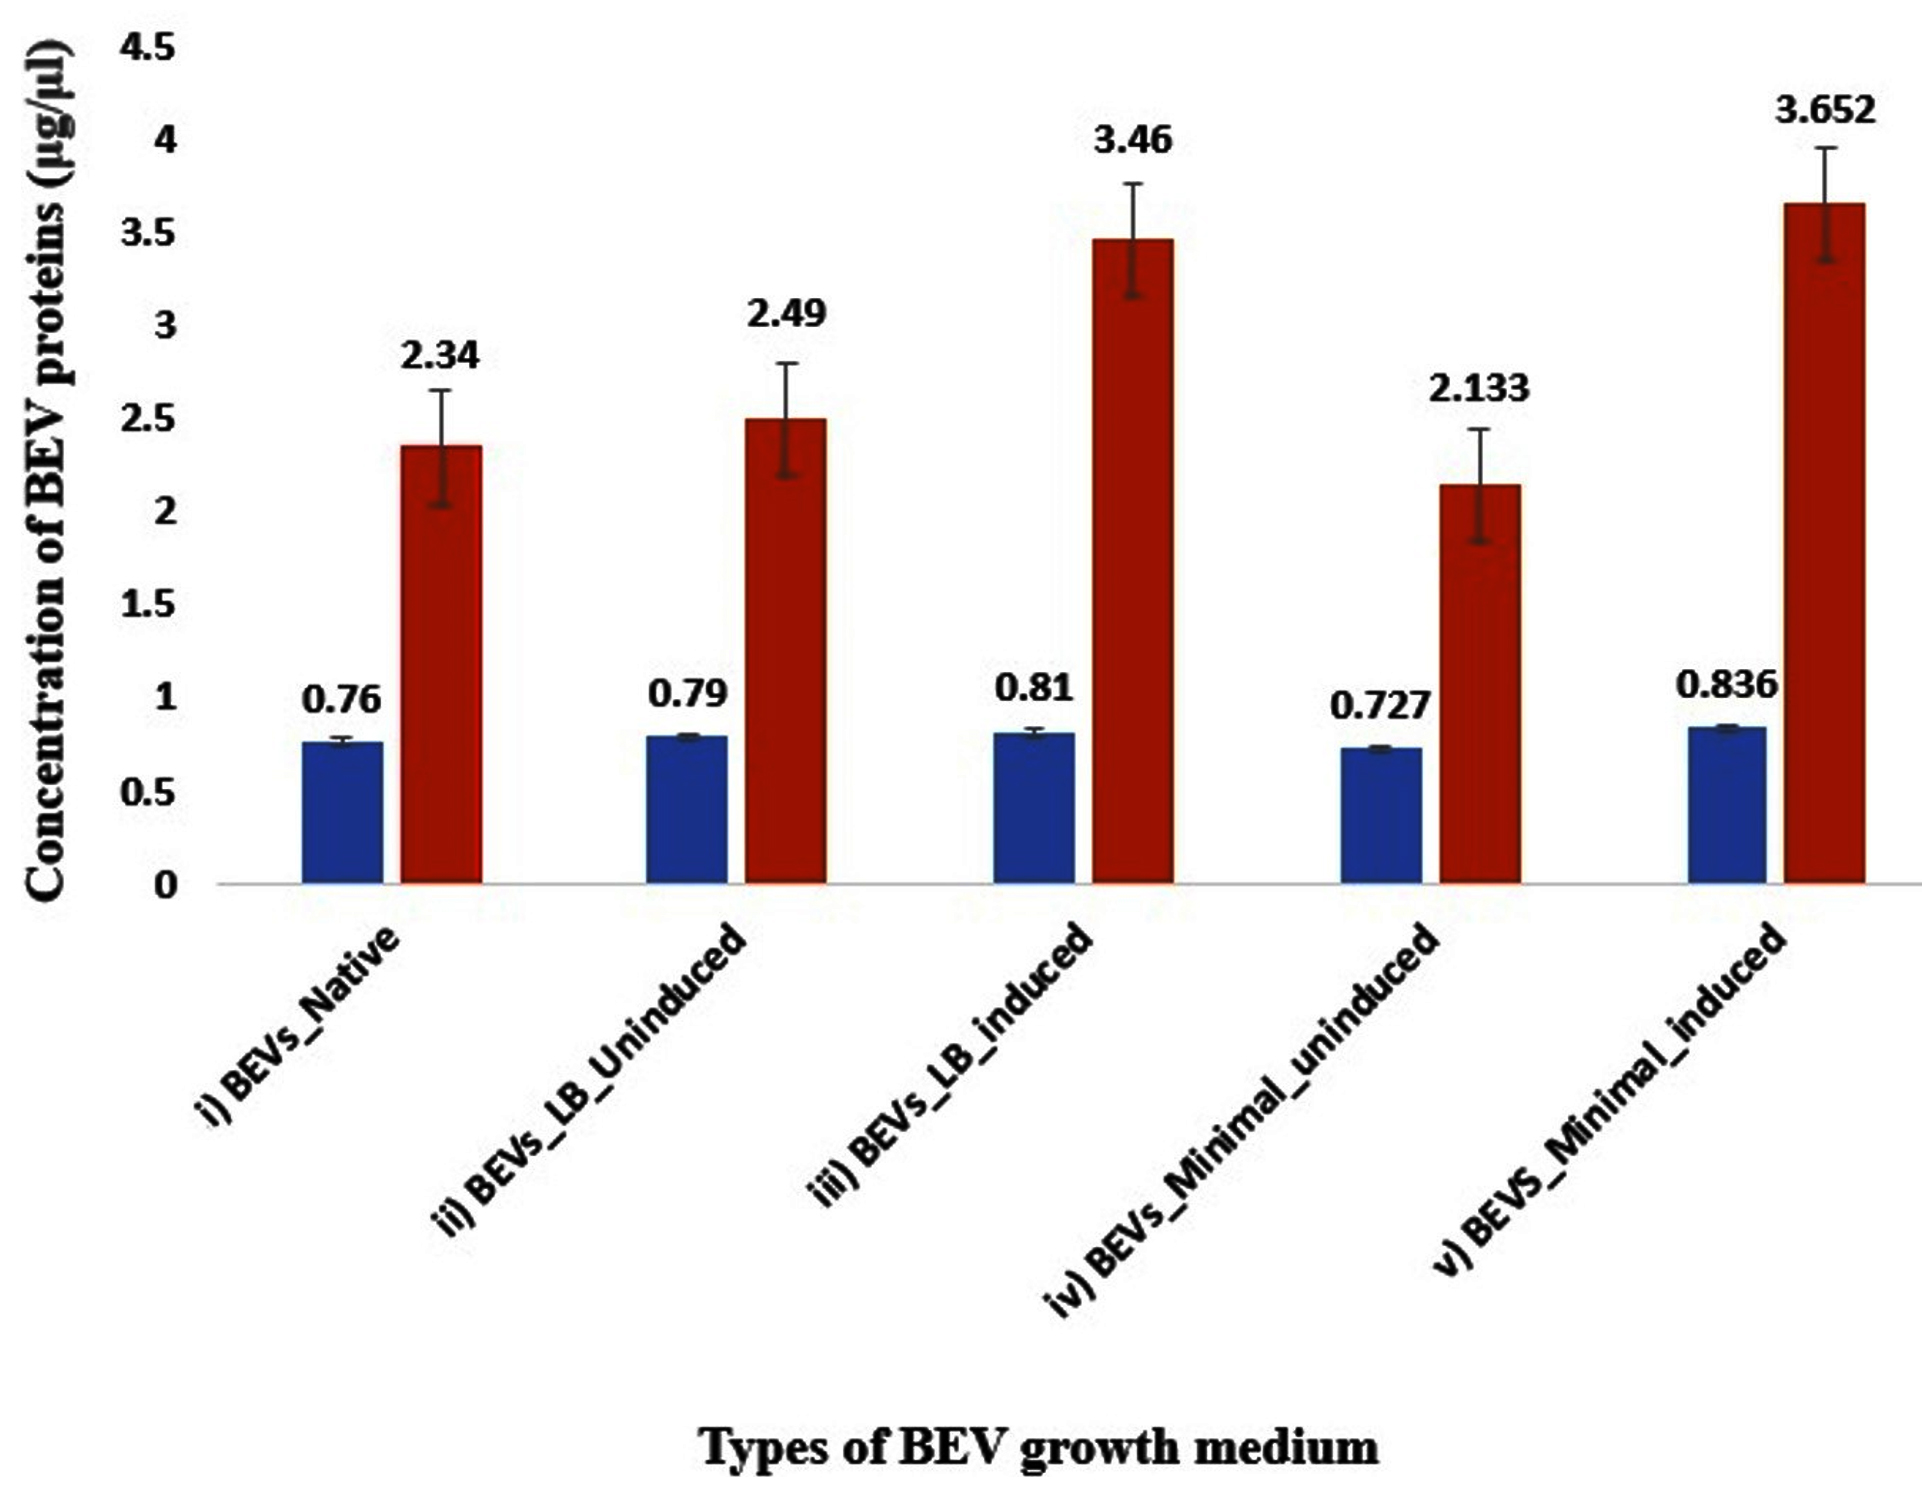
Figure 1. Bar-graph representing the protein concentration of BEVs obtained from native and recombinant E. coli strains. The blue bar represents the concentration of the membrane proteins, and the red bar represents the concentration of total BEV protein content (lysed with RIPA), respectively. i) Native BEVs, ii) Uninduced recombinant BEVs cultivated in LB medium, iii) Induced recombinant BEVs cultivated in LB medium iv) Uninduced recombinant BEVs cultivated in minimal medium, v) Induced recombinant BEVs cultivated in minimal mediu
Characterization of BEVs
Particle size distribution analyzer- Dynamic light scattering
The morphology and size of BEVs were assessed using this technique. The evaluation of particle size distribution using the DLS technique is represented in Figure 2. BEV preparations are heterogeneous and consist of various types of vesicles with differing compositions. Research on the specific mechanisms that selectively package these proteins and various types of cargo in vesicles is a challenging yet active area of study. The results indicate the presence of EVs in different sizes. The separation of extracellular vesicles (EVs) of similar sizes will make it easier to figure out how cargo is sorted in complex EV mixtures. The DLS analysis of BEV samples was performed with three independent biological replicates. The results of the three separate data were represented as the x̄ ± σ (mean ± standard deviation). The differences and the P-value of the data were determined using the Origin Lab software.
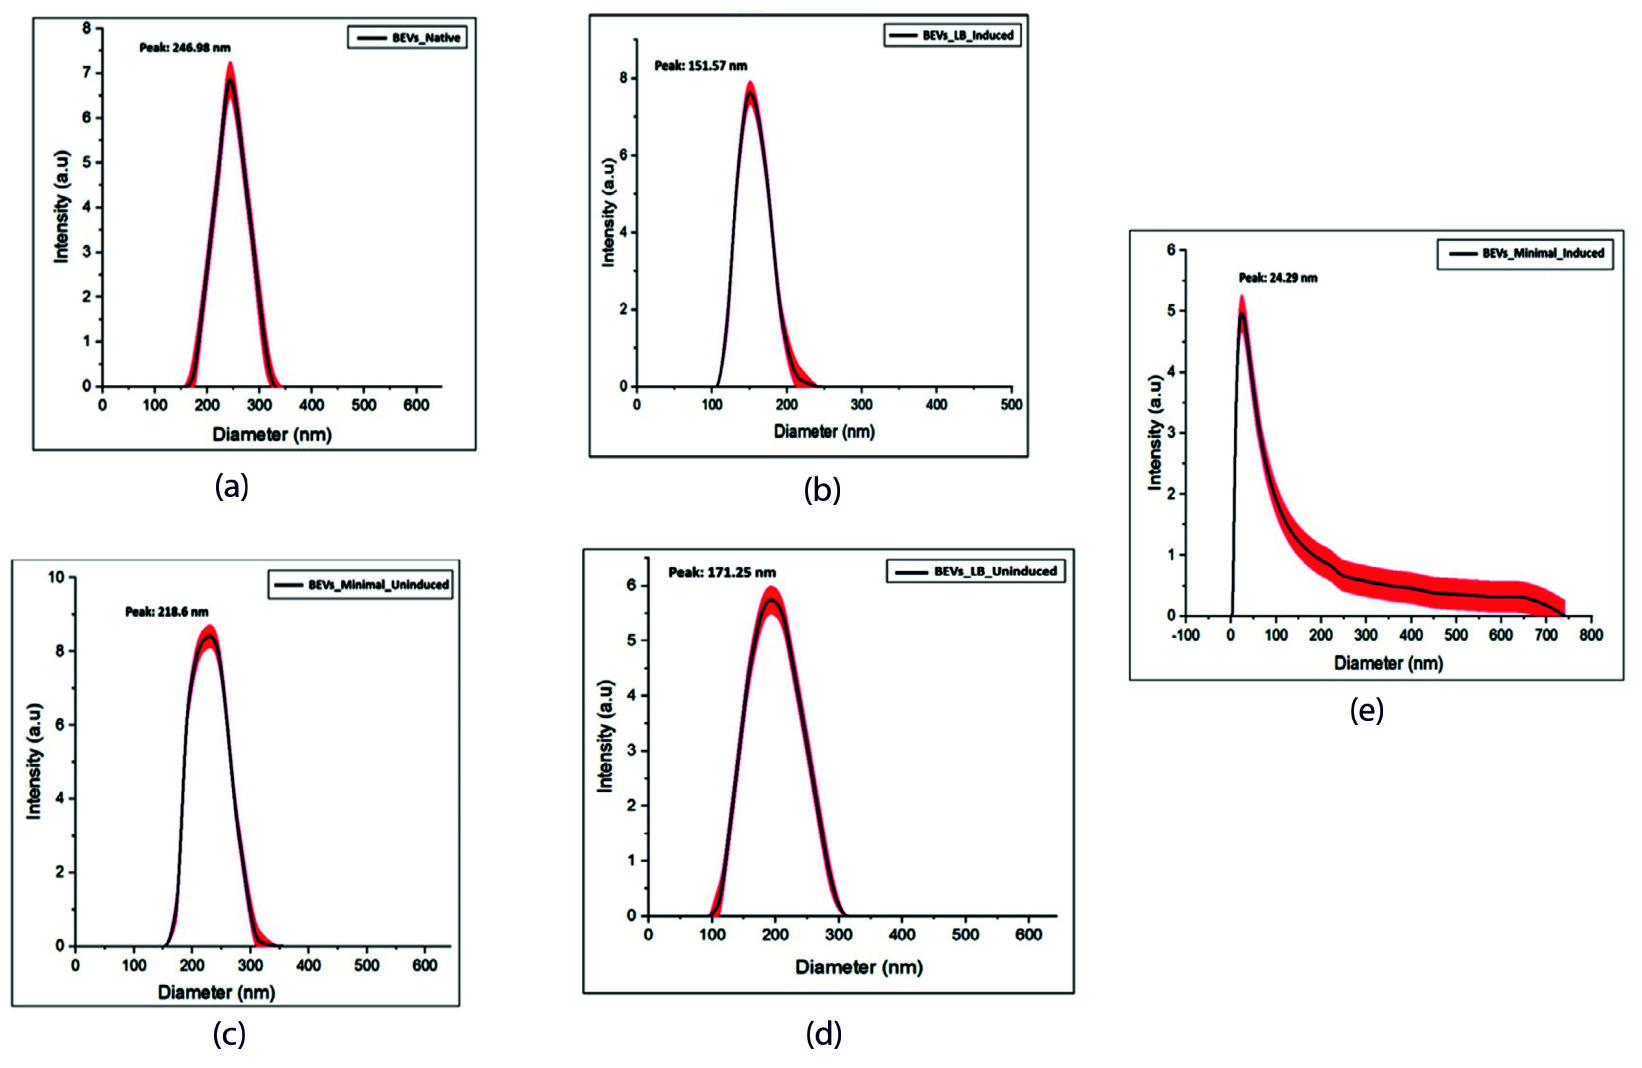
Figure 2. Particle size distribution analysis of EVs isolated from the bacterial culture grown in LB and minimal medium. The Dynamic light scattering technique revealed the particle size of the extracellular vesicle isolated from each bacterial culture. (a) Native BEVs, (b) Uninduced recombinant BEVs cultivated in LB medium, (c) Induced recombinant BEVs cultivated in LB medium (d) Uninduced recombinant BEVs cultivated in minimal medium, (e) Induced recombinant BEVs cultivated in minimal medium
The DLS analysis of BEV samples manifests a bimodal distribution of particles. In Figure 2, sample number (a-d) shows the size ranging between 20-400 nm defines BEVs, and another measure of 0-700 nm (Figure 2), sample number (e) might explain the particle aggregates of the vesicles. Large particles at very low concentrations (lower as 0.5% of all the particles) tend to modify the intensity-weighted PSD because they scatter brighter light,59 and lead to the false magnification of the number of large particles in a dynamic light scattering setting. Hence, the results obtained from DLS should be checked, calibrated, and modified with other techniques like TEM.
High-Resolution Transmission Electron Microscopy (HRTEM)
The HRTEM images were further analyzed to compare and study the morphological characteristics of each engineered BEV by identifying their PSD. The EVs isolated from native and recombinant E. coli strains showed distinct morphological characteristics for each case with a slight difference in the particle size. The IPTG-induced recombinant BEVs cultivated in the LB medium showed unique morphology compared with other samples. The HRTEM images of EVs isolated from both native and recombinant bacteria grown at different culturing mediums are shown in Figure 3 (a). The formation of vesicles inside Escherichia coli is depicted in Figure 3 (b).
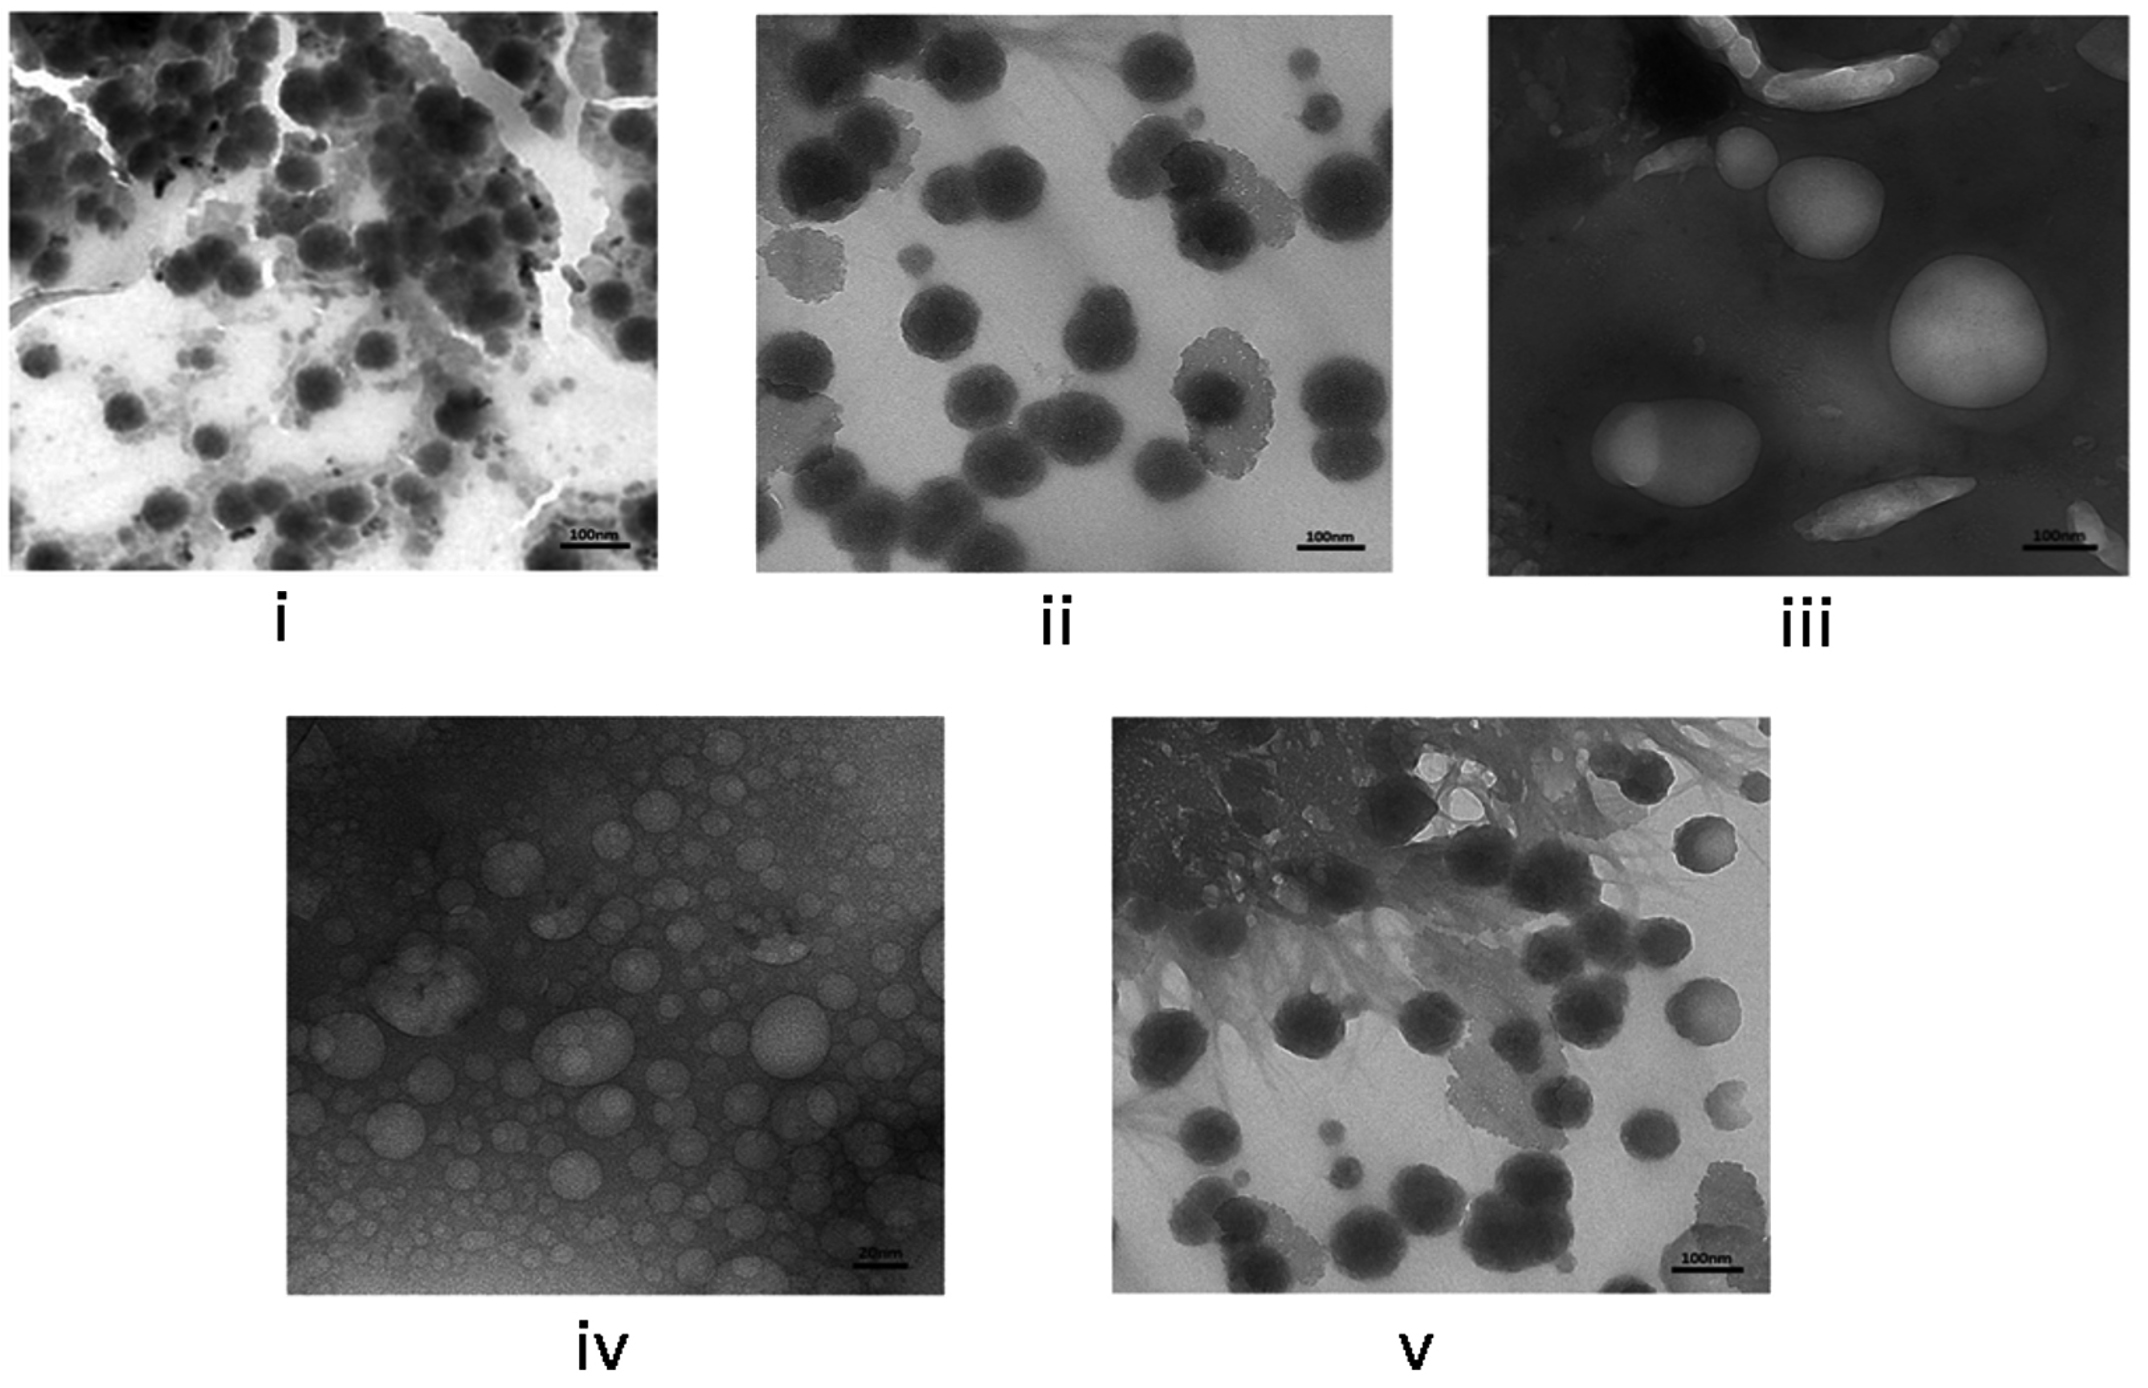
Figure 3(a). High-resolution transmission electron microscopy of BEVs. (i) Native BEVs, (ii) Uninduced recombinant BEVs cultivated in LB medium, (iii) Induced recombinant BEVs cultivated in LB medium (iv) Uninduced recombinant BEVs cultivated in minimal medium, (v) Induced recombinant BEVs cultivated in minimal medium. The images obtained from HRTEM represents a resolution of 100 nm ((i), (ii), (iii), (v)), and image (iv) represents 20 nm
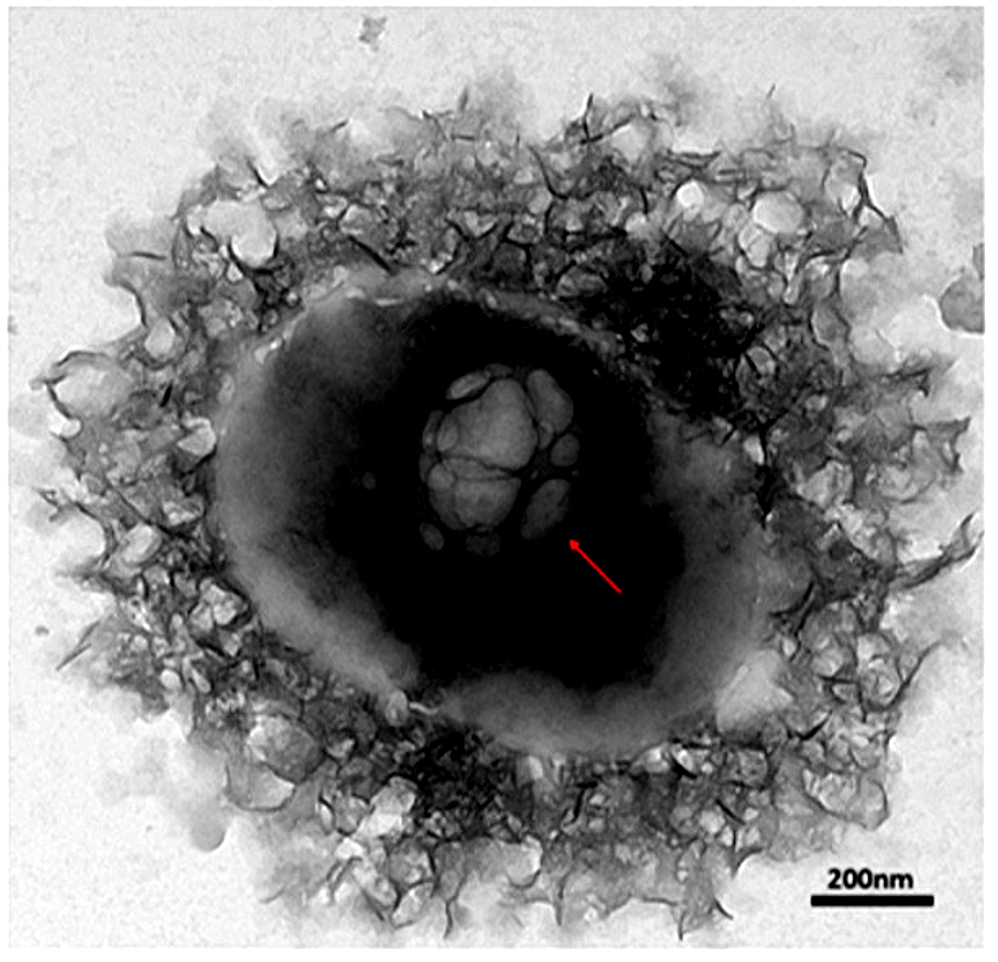
Figure 3(b). The HRTEM image of the vesicles formed inside Escherichia coli. Recombinant Escherichia coli cultivated in LB medium. The image represents the formation of late endosomes and intraluminal vesicles inside the bacterial cell with a resolution of 200 nm
Analysis of BEV images obtained from HRTEM
3D interactive surface plots for morphology studies
The interactive surface mapping sub-tool parameters in ImageJ software were optimized to plot the high-resolution surface plots for BEV images obtained from HRTEM. The surface plots, including morphology plots, thermal plots, and distribution plots of BEVs, were plotted and depicted in Figure 4 (a). Bex V-HRTEM images’ analyses for morphological studies resulted in a contrastive morphology of vesicles isolated from recombinant E. coli culture cultivated in two different growth environments.
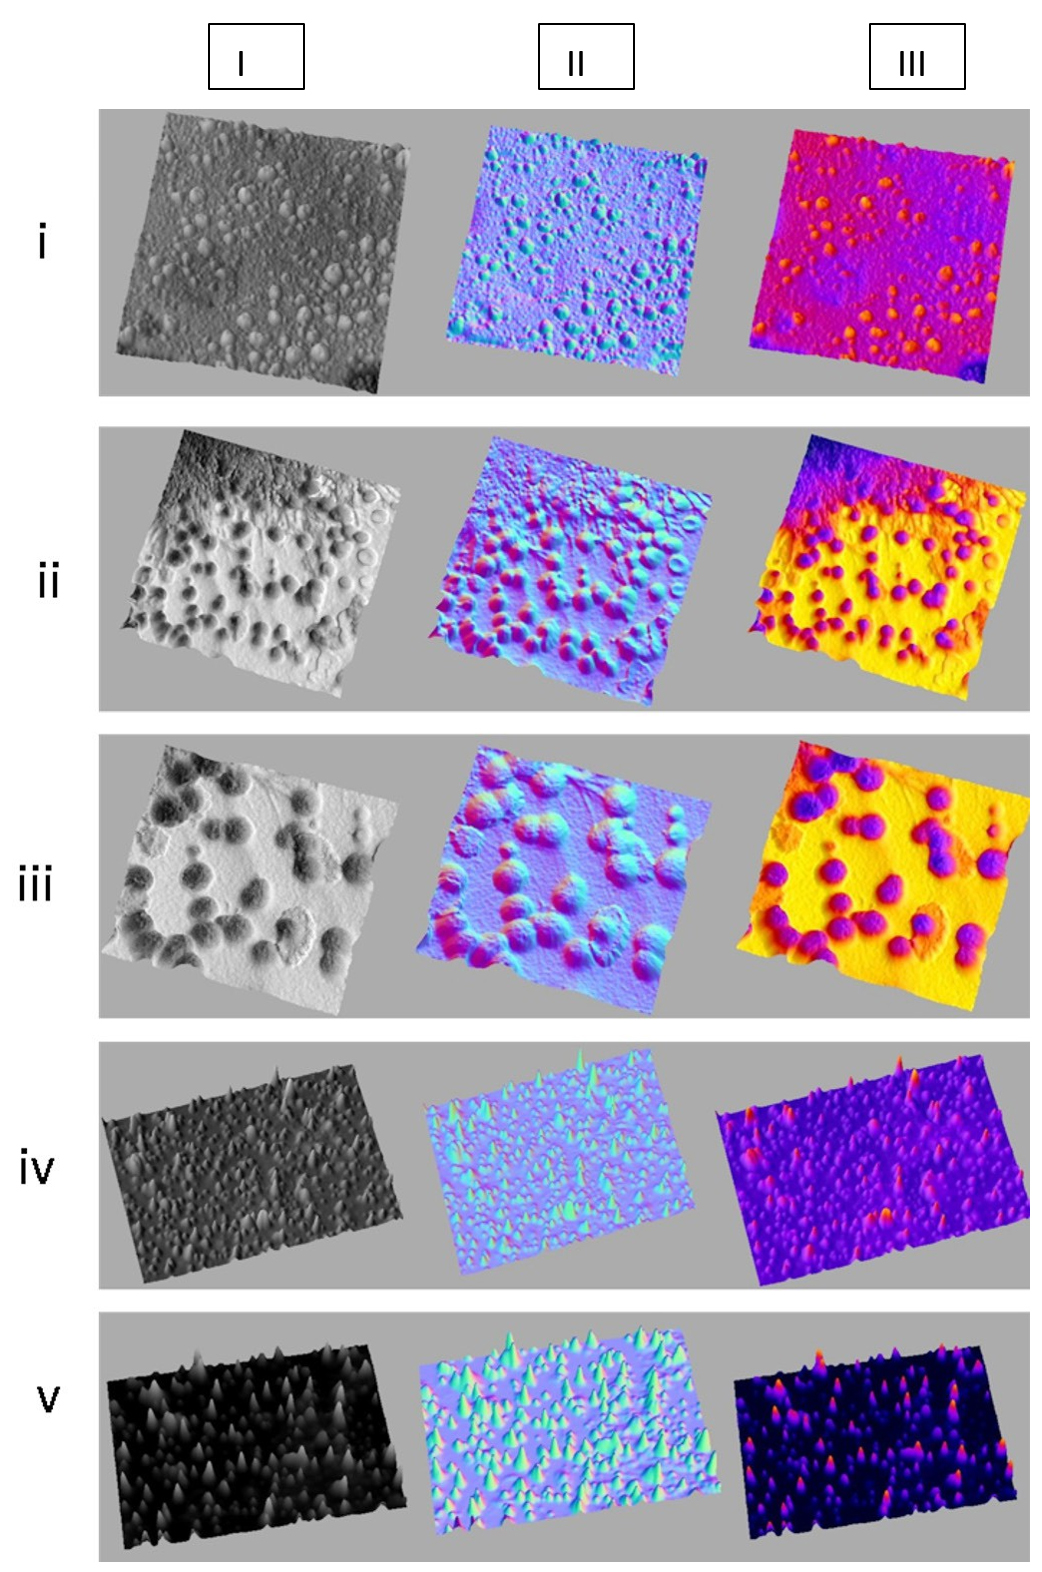
Figure 4(a). High-resolution 3D interactive surface plots for BEVs. I. Morphology plots, II. Thermal plots and III. Distribution plots were shown in the figure. i) Native BEVs, ii) Uninduced recombinant BEVs cultivated in LB medium, iii) Induced recombinant BEVs cultivated in LB medium, iv) Uninduced recombinant BEVs cultivated in minimal medium, and v) Induced recombinant BEVs cultivated in minimal medium
The physical attributes and 3-dimensional morphology of BEVs were studied by plotting the topology maps for extracellular vesicles. The distribution mapping of BEVs represented a clear image of vesicles’ distribution and dispersion pattern, accurately differentiating the distribution pattern of small and large vesicles. During the transmission of an image, it is most common to acquire a random variation of brightness, an undesirable by-product that overshadows or obscures the original information. The thermal plots were plotted to differentiate between background noise and actual BEVs for PSD analysis. The thermal graphs depicting BEVs’ thermal peaks were considered true vesicles and were utilized for statistical analysis.
Particle size distribution analysis
HRTEM images of BEVs provided accurate information regarding the vesicle’s morphology and size. Based on the images obtained from HRTEM, the surface volume-mean diameter or SMD (Sauter mean diameter) for each bacterial vesicle was calculated. The area and diameter of each vesicle released from the bacteria were measured using ImageJ, and the Particle Size-frequency Distribution and Normal Distribution curves were plotted using Origin Lab. The parameters like particle mean size and standard deviation of each vesicle were recorded. The calculation of particle size and standard deviation for each bacterial extracellular vesicle is shown in Figure 4 (b).
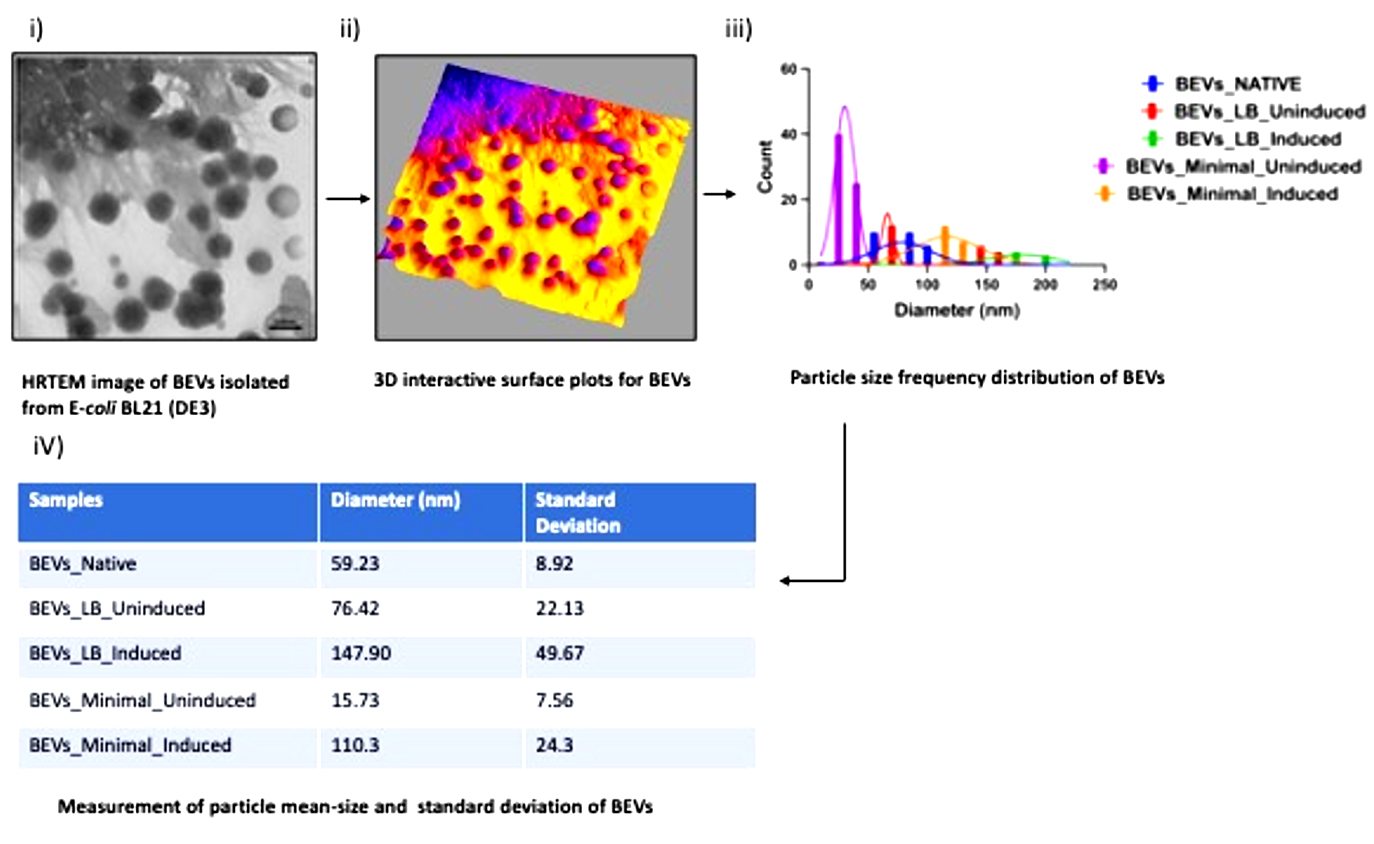
Figure 4(b). Pictorial Representation of Particle Size Distribution Analysis of images obtained from HRTEM. i) HRTEM image of Extracellular vesicles isolated from the bacteria E. coli BL21 (DE3). ii) 3D interactive surface plots (thermal mapping) of BEVs to differentiate between noise and bacterial vesicles. iii) Cumulative particle size-frequency distribution of each bacterial extracellular vesicle. iv) Calculation of Particle-mean size and Standard deviation of BEVs. The standard deviation measures the spread of the area distributed under the curve. An increase in standard deviation shows the increase of particle mean size of BEVs. In our investigation, BEVs formed in LB medium induced with 10 mM ITPG had the highest particle mean size of 147.90 nm with a standard deviation of 49.67. The highest particle mean size may be due to the unique morphology of vesicles released from bacteria with increased surface area and diameter. The study of vesicle morphology using HRTEM was performed in triplicates, and the mean PSD was calculated by averaging the biological triplicates
Particle Size-frequency Distribution and Normal Distribution curves for individual BEV samples
Normal distribution curves for particle size were plotted for native and recombinant bacterial extracellular vesicles grown in two different media. The critical parameters of BEVs were analyzed depending on the SD (standard deviation) of the area beneath the curve. The curves for BEVs were not evenly distributed, with each sample having a different curve range. This uneven distribution is due to the variation of particles distributed in each HRTEM image. Based on the distribution curves for particle size, it was observed that a maximum amount of EVs was secreted between the range of 50-150 nm. The graphical representation of particle size-frequency distribution and normal distribution curves are shown in Figure 4 (c).
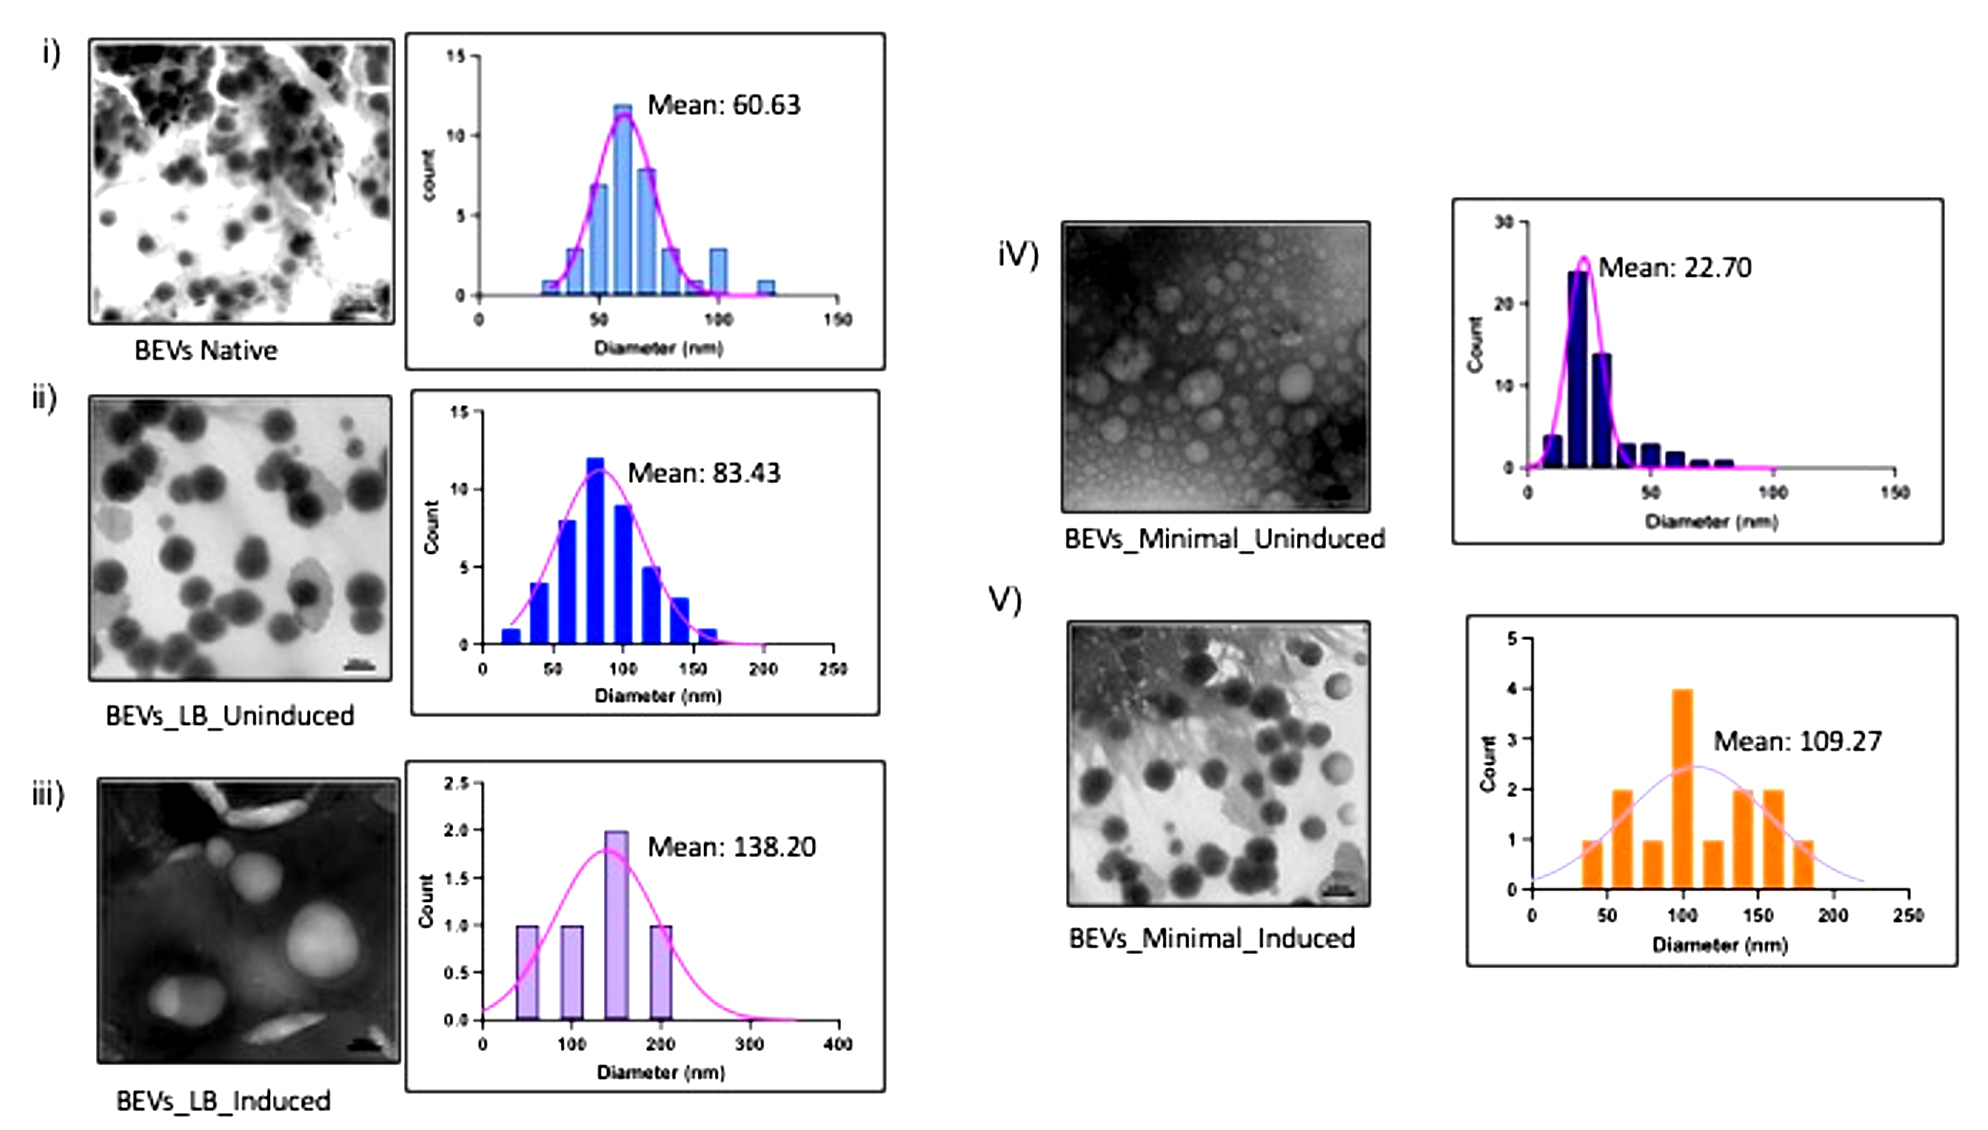
Figure 4(c). Particle Size-frequency distribution and normal distribution curves for a native and recombinant protein expressed BEVs. (i) Native BEVs, (ii) Uninduced recombinant BEVs cultivated in LB medium, (iii) Induced recombinant BEVs cultivated in LB medium (iv) Uninduced recombinant BEVs cultivated in minimal medium, (v) Induced recombinant BEVs cultivated in minimal medium
The frequency distribution of vesicles indicates the percentage of the number of particles existing in the respective particle-size intervals. In our study, sample number (iv) had the highest count of EVs released from bacteria, while sample (v) was the second-highest. The sample (iii) had the lowest particle count and highest particle mean size of 3 and 147.90, respectively. This result suggests that sample (iii) secretes minimal extracellular vesicles with the largest particle size.
SDS-PAGE of total protein in Bacterial Extracellular vesicles
The BEV samples having 60-70 µg of protein concentration in 50 µl NFW suspension were loaded onto the PAGE wells, as shown in Figure 5. Several peptides were detected in the samples induced with IPTG in both minimal and LB media. The recombinant BEVs grown in both media yielded peptides ranging from 27 kDa to 60 kDa, with induced BEVs expressing SAGFP having better intensities in bands when compared with uninduced recombinant BEVs. The EVs isolated from native E. coli strain without recombinant SAGFP protein had peptides ranging from 28 kDa-30 kDa, thus having the most negligible protein concentration.
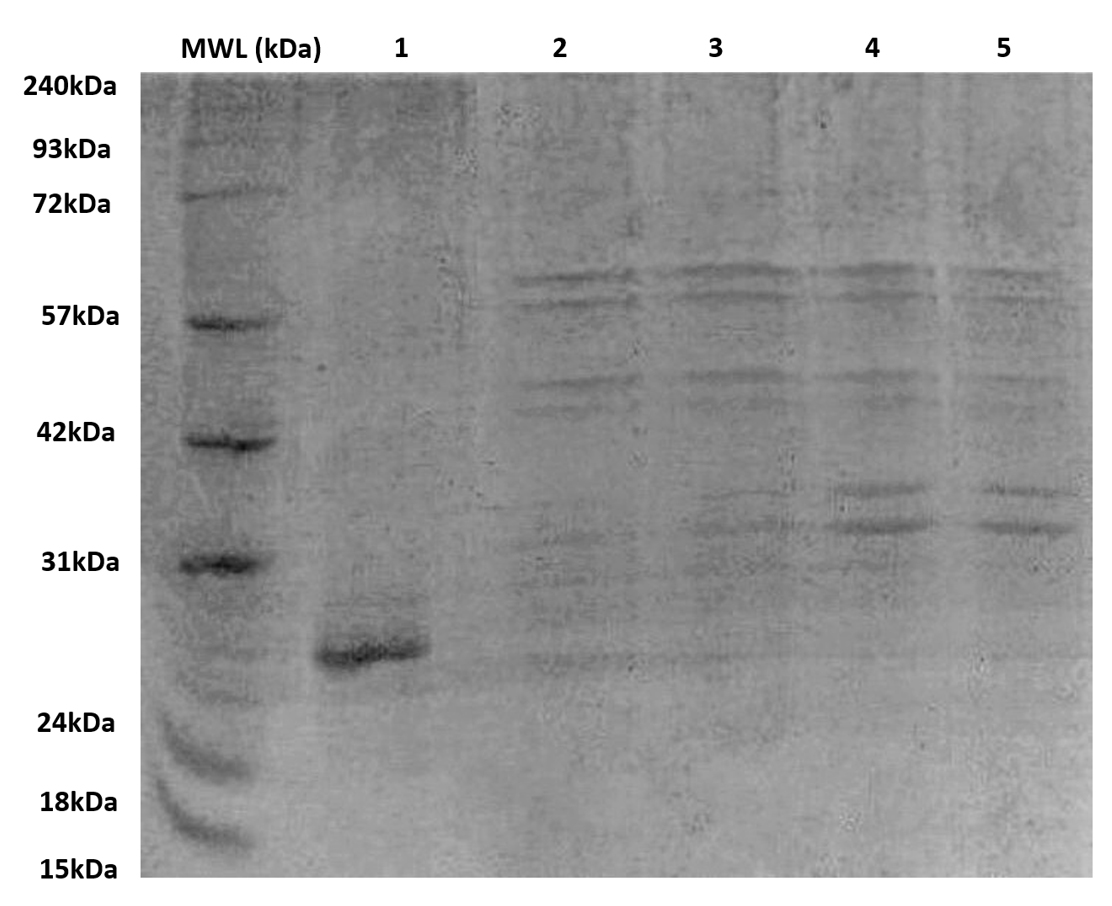
Figure 5. SDS–PAGE analysis of BEV protein profiles
BEV samples (60-70 µg total protein in 50 µL NFW) were loaded into each well to compare peptide expression across conditions. Lanes 1-5 represent BEVs derived from recombinant E. coli cultured in minimal and LB media under induced (+IPTG) and uninduced conditions. Induced recombinant BEVs expressing SAGFP exhibited distinct bands between ~27-60 kDa with markedly higher intensity compared to uninduced BEVs, indicating successful induction and enhanced peptide expression. In contrast, EVs isolated from the native E. coli strain showed only faint bands between ~28-30 kDa, consistent with their minimal inherent protein content. MWL: molecular weight ladder
Measurement of Fluorescence Intensity in Engineered-BEVs
The recombinant protein is a His-tagged Signal anchoring green fluorescent protein expressed in E. coli BL21 (DE3). The measurement of fluorescence and packing of SAGFP into BEVs were analyzed using a fluorescence spectrophotometer. The diluted working stock of both native and engineered BEV samples was measured for fluorescent intensity. The lipid membrane of the BEVs was treated with a non-ionic surfactant like Triton X-100 (without breaking the protein-protein interactions).60-62 Therefore, the measurement of fluorescence in BEVs was carried out using two methods: (i) Measuring the intensity on the membrane surface, and (ii) Measuring the total fluorescence intensity of the bacterial vesicle by lysing them using 0.1% Triton X-100 (pH-7.4). Experimenting with this approach makes it possible to marginally observe whether the SAGFP is anchored onto the membrane or sorted into the vesicle. The measurement of fluorescent intensity in engineered BEVs is shown in Figure 6(a). The research article stated that the change in the pH of the culture medium increases the GFP expression and CD63, an extracellular marker protein. The low pH affects the intracellular localization, increases the fluorescent signals, and influences the release and delivery of the EV contents. The mechanism of membrane internalization during the formation of EVs and endosomes is still not clear. These results suggest that the nature of the growth medium influences the extracellular vesicle release. Therefore, it is evident that the extracellular vesicles and cargo loading are also influenced by the culture medium’s composition.63,64
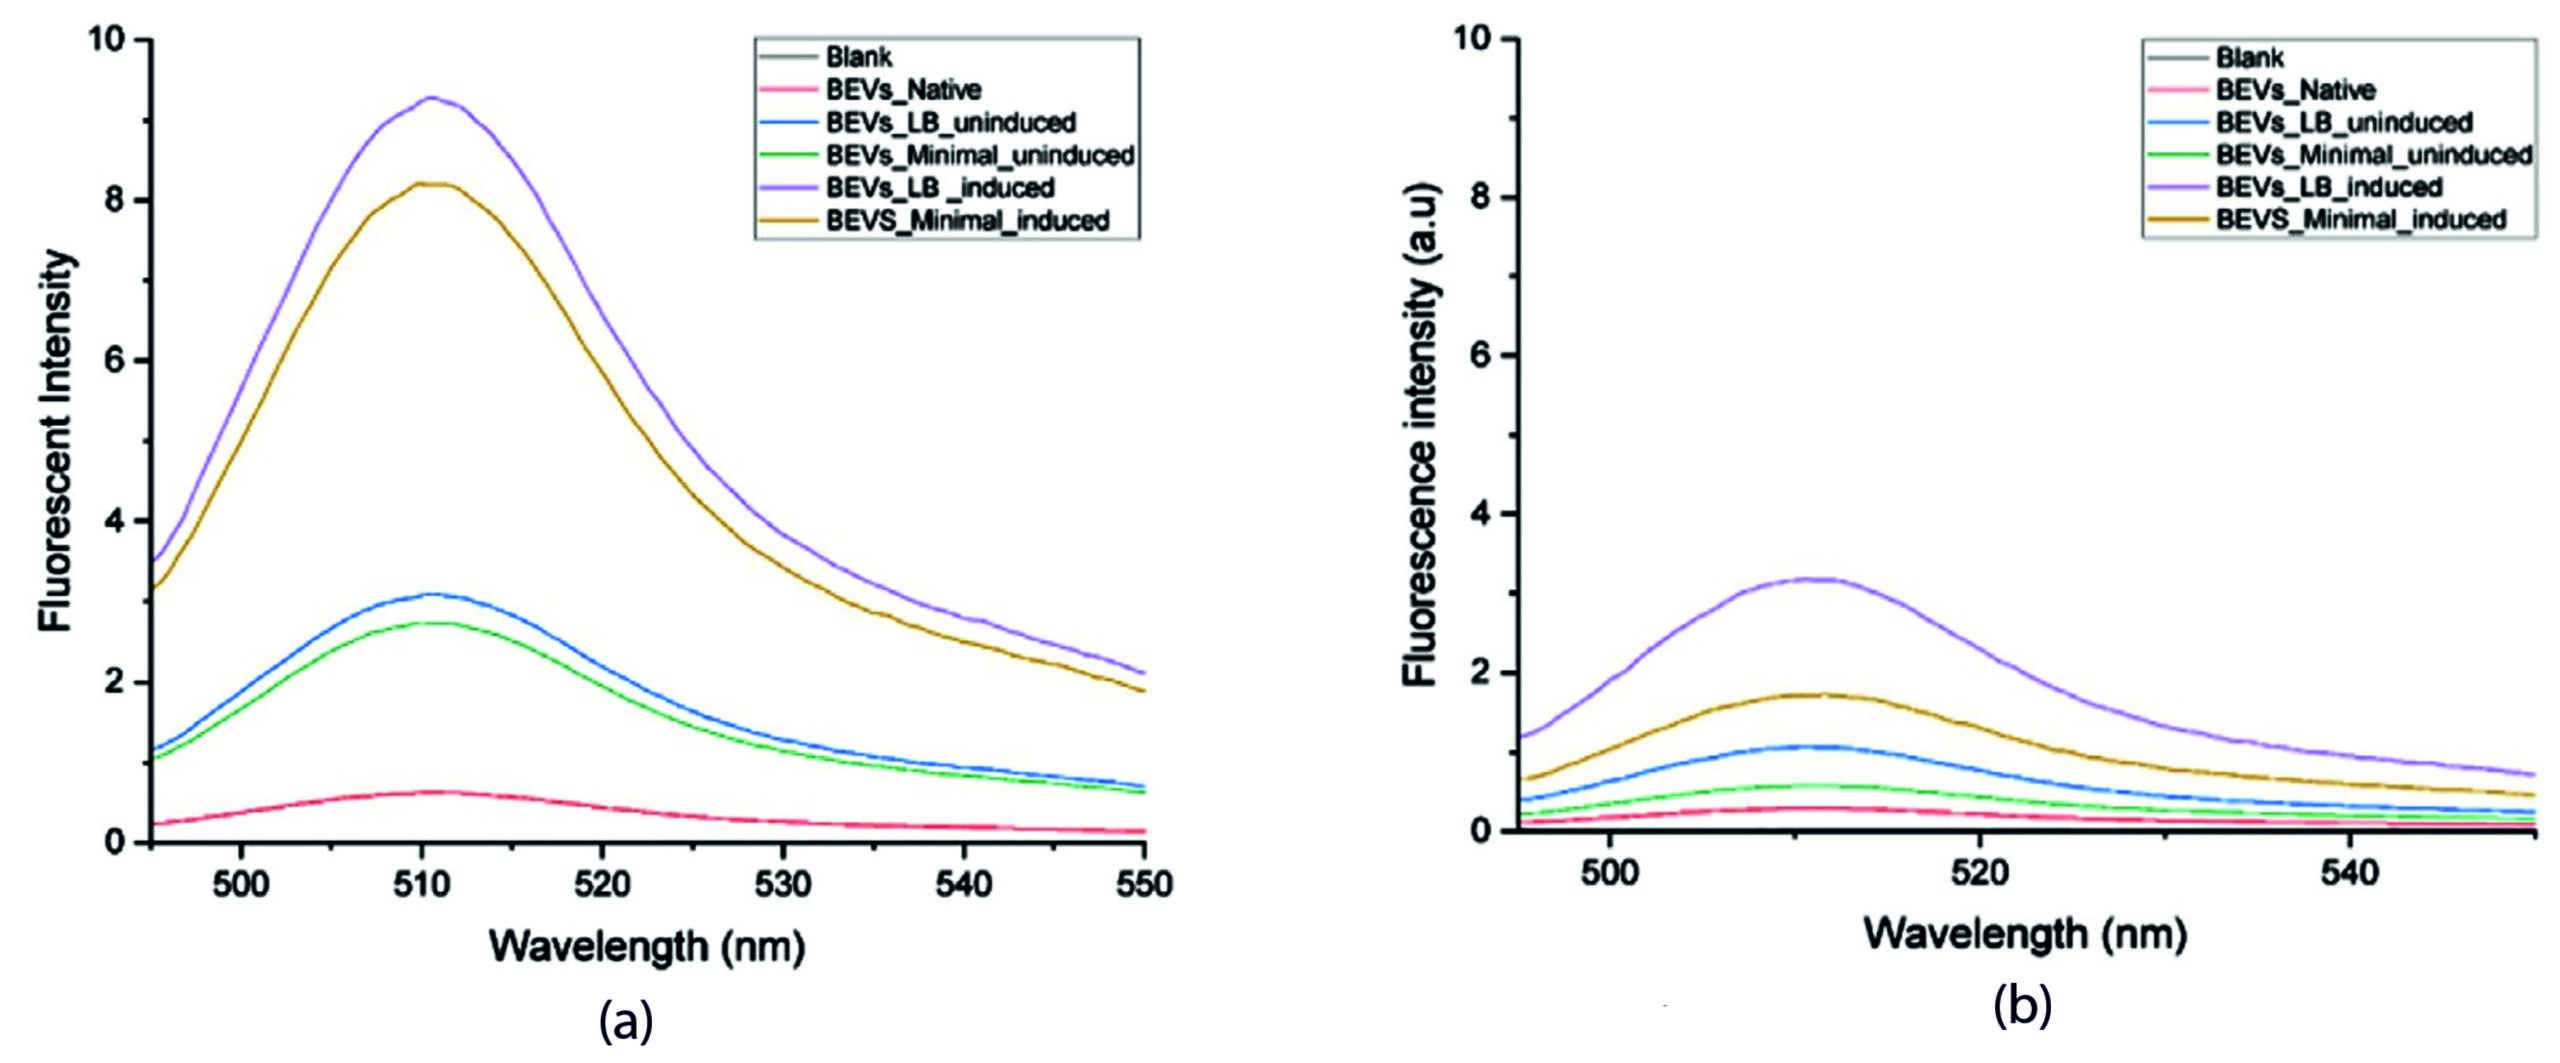
Figure 6. Fluorescence Emission spectra of SAGFP in Bacterial Extracellular Vesicles. (a). Fluorescence intensity of the compact BEVs. (b). Fluorescence intensity of lysed BEV. 1. Black-Blank, 2. Red- Native BEVs, 3. Blue-Uninduced recombinant BEVs cultivated in minimal medium, 4. Green- Uninduced recombinant BEVs cultivated in LB medium, 5. Purple- Induced recombinant BEVs cultivated in minimal medium, 6. Yellow- Induced recombinant BEVs cultivated in LB medium
Both lysed and unlysed BEVs grown in LB medium induced with 10 mM IPTG had a higher fluorescent intensity when compared with other samples. Of note, the fluorescence emission in BEVs lysed with Triton X-100 (sample ii) was higher when compared with unlysed samples. When the BEVs were lysed, the total concentration of recombinant SAGFP sorted into BEVs was measured for fluorescence, thus providing the highest peak value. However, this outcome instigates the sorting of recombinant protein into BEVs. The increased fluorescent intensity of the samples treated with Triton X suggests the fluorophore65 is well protected inside the vesicles. Triton X-100 treatment lyses the vesicle’s lipid membranes, and when SAGFP was released into the aqueous environment, the fluorescence was reduced by collisional quenching.
The bacterial cell-derived exosomes have been characterized to gain insights into the structure and composition using DLS, HRTEM, and polyacrylamide electrophoresis. Significant differences exist in the structure, composition, and cargo of the extracellular vesicles derived from prokaryotic and eukaryotic cells.56,66 Extracellular vesicles have been implicated in several host-pathogen interactions where the pathogen-derived exosome modulates the host cells’ behavior and physiology.67
Yield from IPTG-induced recombinant BEVs cultivated in the minimal medium was higher regarding BEV quantification and total-proteome quantification. At the same time, induced recombinant BEVs produced in the LB medium yielded more vesicles and increased proteome content than native BEVs and uninduced recombinant BEVs. The concentration of proteins on the membrane surface is more or less the same in native and uninduced recombinant BEVs. Since membrane proteins are hydrophobic, isolating and digesting the surface proteins associated with BEVs is difficult. The combined activity of non-ionic and ionic buffers in the RIPA buffer could overcome this difficulty and effectively digest BEV proteins.68 Our investigation substantiates the presence of enhanced recombinant protein sorting into the BEVs as the bacterial culture induced with IPTG had higher protein concentration in both LB and minimal media.
The secretion of round and bulbous-shaped BEVs was reported from the bacterial culture grown in an LB medium.69 In our studies, the BEVs isolated from the native bacterial strain were well dispersed and showed good recovery of particle morphology, indicating better particle stability.
Uninduced recombinant bacterial strain cultivated in LB medium yield round and bulged vesicle with more particle agglomeration and clustering along with minutest background noise. However, the induced recombinant strain produced in the LB medium yielded aggregated globular-shaped bacterial vesicles with complete background noise. In the case of minimal medium, both induced and uninduced recombinant strains cultivated in minimal medium yield copious amounts of small vesicles along with obscuring background noise. The difference we observed may be due to either the specific induction of small vesicles by the minimal medial or the interference of the LB media in the isolation process of BEVs. The presence of protein aggregates and other artifacts around the BEVs might be accountable for the background noise and particle aggregation.70-72 The presence of yeast extract and tryptone in the LB media increases the viscosity and may help properly separate extracellular vesicles. However, a detailed investigation is required to establish the claims.
A reduction in fluorescence emission from proteins or fluorescent dyes is commonly observed with increasing detergent concentration across various biological systems. This phenomenon can be primarily explained by micelle formation, alterations in microenvironment polarity, and dynamic quenching effects. In this study, cell lysis was performed using a fixed concentration of lysis buffer containing sodium deoxycholate, a mild ionic bile salt detergent. This detergent is commonly used for efficient membrane solubilization while preserving protein integrity. Sodium deoxycholate disrupts lipid-lipid and lipid-protein interactions by integrating into cellular membranes, enabling the controlled release of intracellular components. As observed in Figure 6a and 6b, the detergent molecules supposedly quench the fluorescence of the protein or dye. There are several mechanisms proposed under which the quenching of fluorescence may occur. The quenching mechanism is experimentally divided into two types, namely static and collisional quenching which are wholly dependent on the process that begins before or after the absorption of the quantum light by a fluorescent molecule. Packing of the SAGFP inside the vesicle yields increased fluorescent intensity. Reduction in the fluorescence intensity of Triton X-100 treated samples may be due to either of the two types of quenching. The mechanism underlying the reduction in fluorescence intensity upon detergent treatment is schematically illustrated in Figure 7.
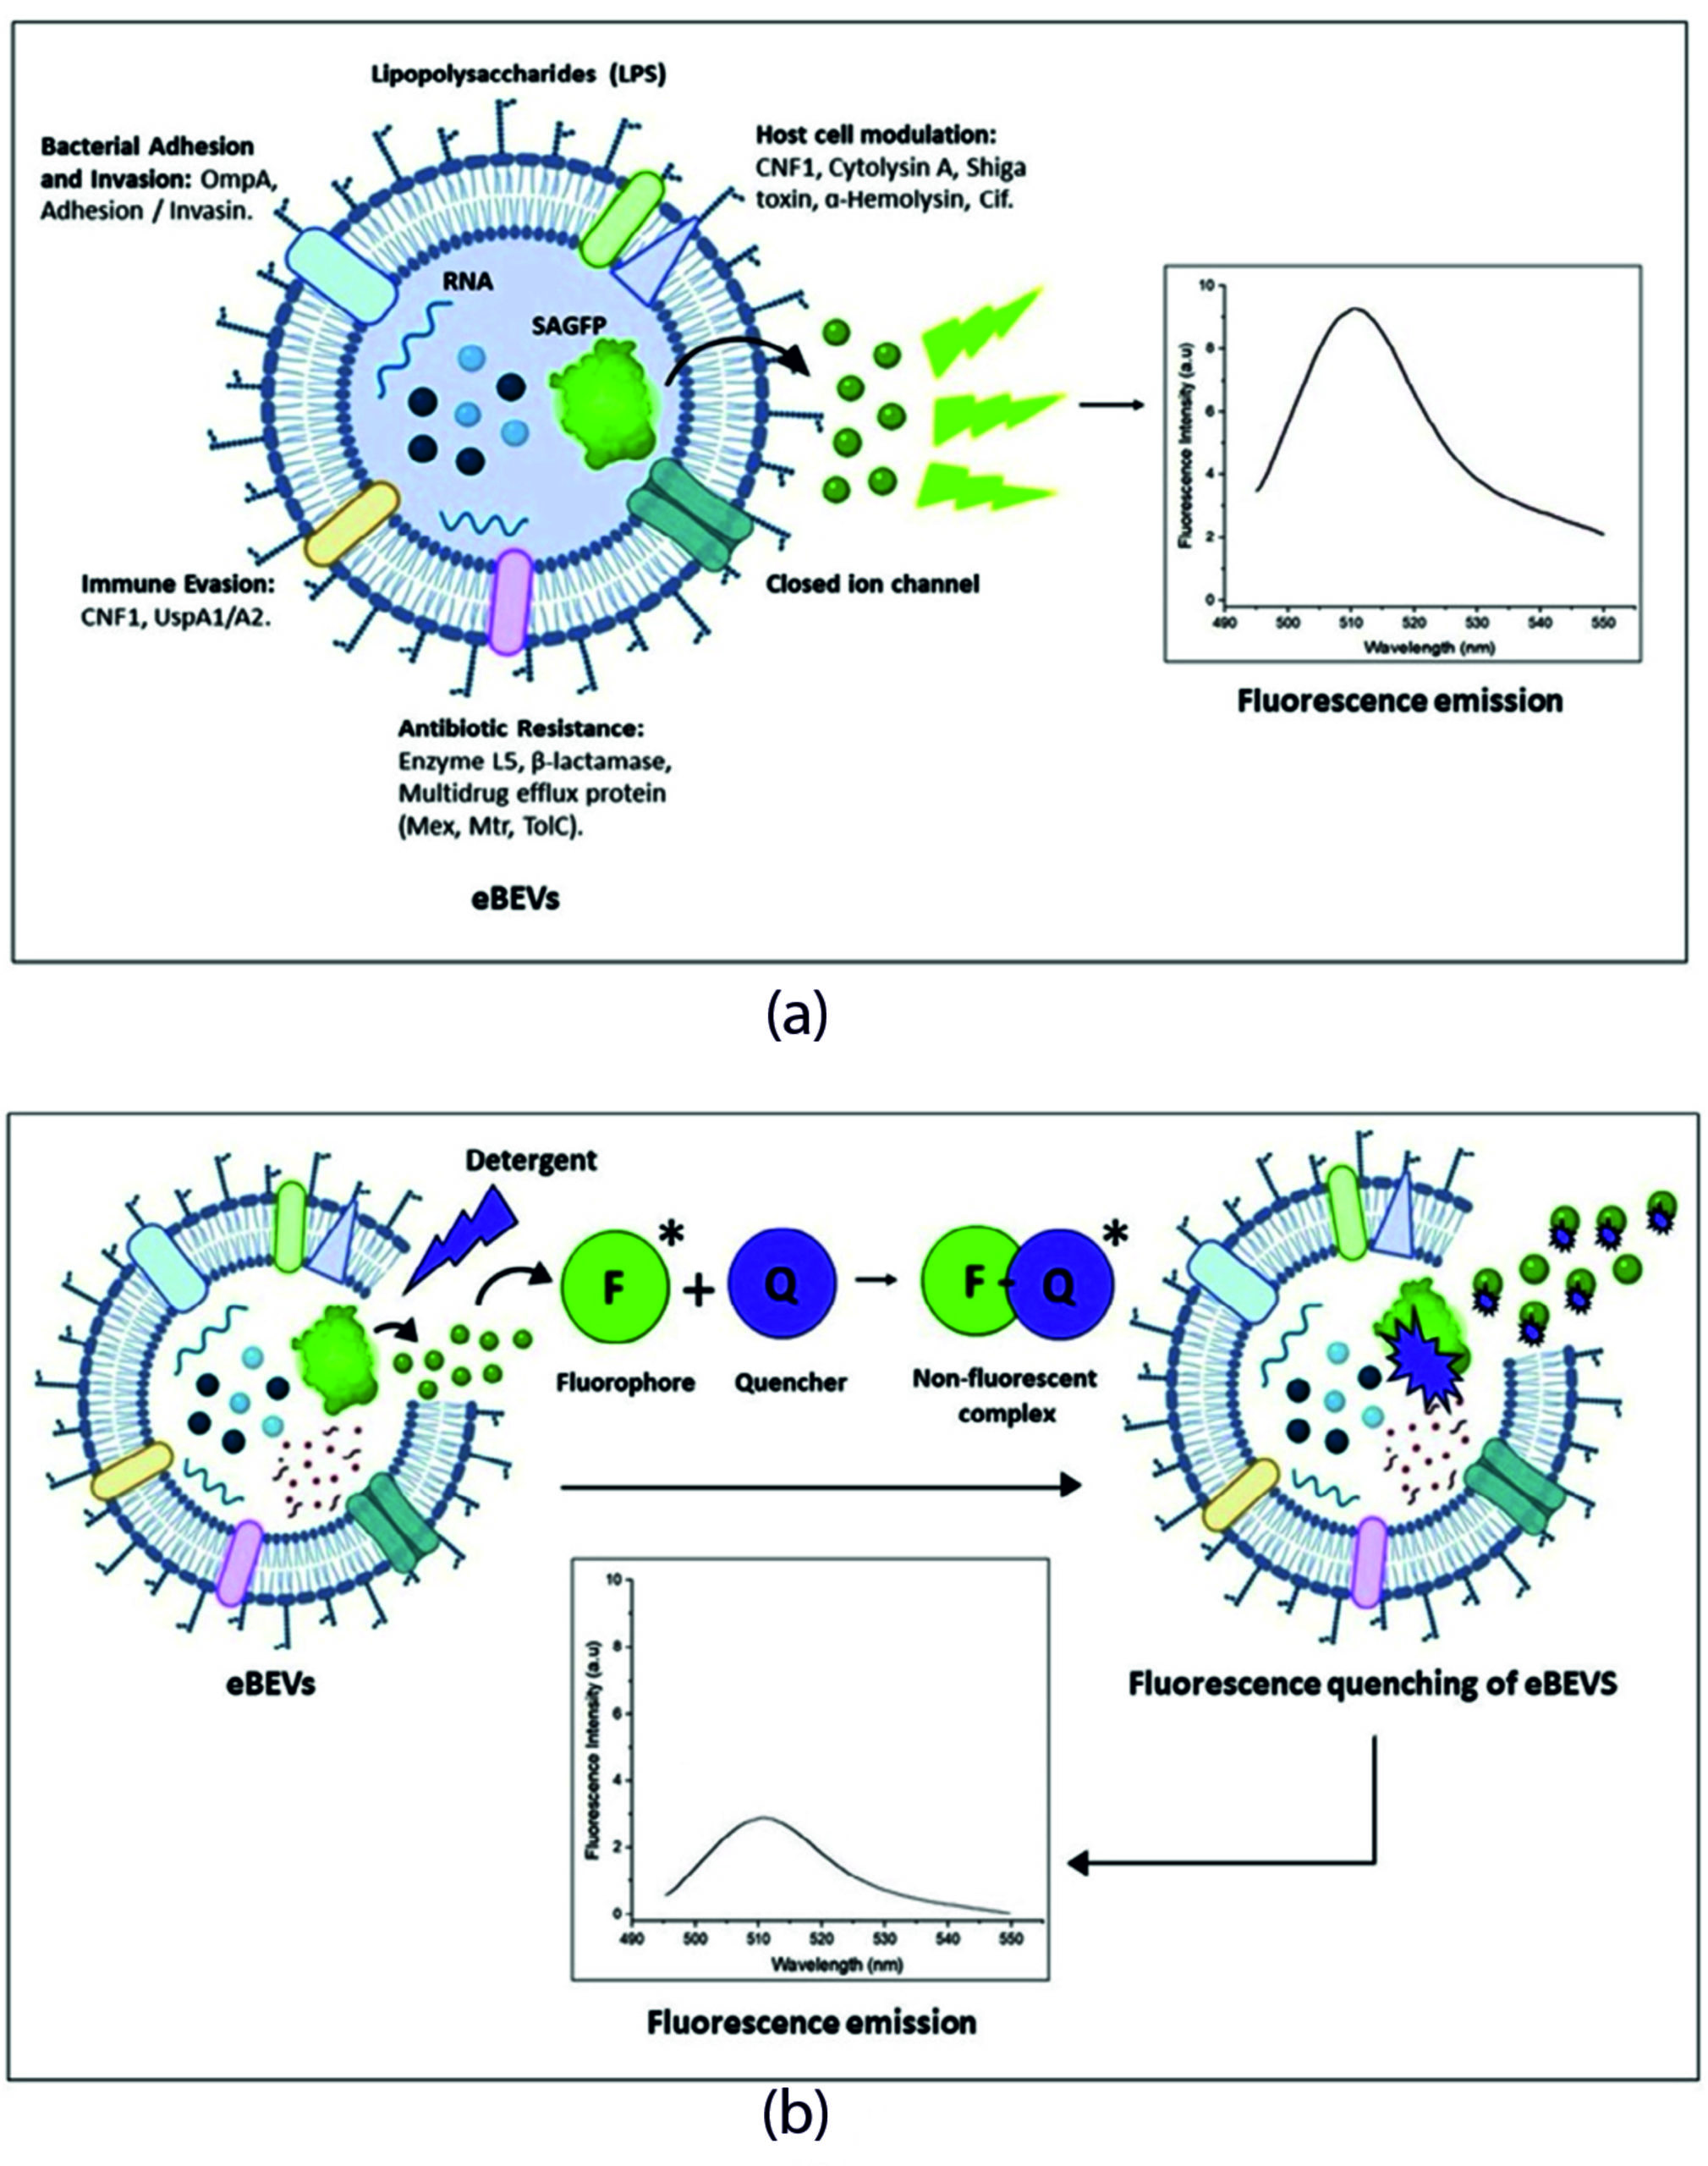
Figure 7. Emission and quenching of fluorescence in engineered bacterial extracellular vesicles. (a) Emission of fluorescence from SAGFP-eBEVs. (b) Static quenching of fluorescence in SAGFP-eBEVs upon treatment with detergent. Figure (a) illustrates the emission of fluorescence from SAGFP-eBEVs without any detergent treatment (therefore, reckoning that the environment of the vesicle has zero effect on the spectral properties of the SAGFP protein). In Figure (b), when treated with detergent, the formation of the non-fluorescent complex between the quencher molecule (Q) and fluorophore (F) decreases the emission of fluorescence from the protein, thereby depicting the static quenching of fluorescence emitted from the vesicles with lower fluorescent intensity
Our investigation compared the extracellular vesicles isolated from recombinant bacterial culture E. coli BL21 (DE3) grown in two different media. We analyzed the eBEVs based on their biophysical, molecular, and morphological characteristics, as these vesicles can be utilized as a drug-delivering vehicle in therapeutics and diagnostics. The BEVs isolated from recombinant E. coli strain grown in LB medium induced with IPTG showed unique morphology compared with other samples. 3D interactive surface plots and particle size-distribution analyses of BEVs obtained from the HR-TEM results depicted slight morphological dissimilarities. When comparing the particle size distribution of each BEV sample, it was observed that the BEVs formed in LB medium induced with 10 mM ITPG had the highest particle mean size of 147.90 nm with a standard deviation of 49.67. Though BEVs from minimal media had good purity of particles with increased protein concentration, the formation of particle aggregates in the samples resulted in poor stability of vesicles as observed in the HRTEM images. The sorting of SAGFP into the BEVs was evident from the results obtained from fluorescent spectroscopy, CLSM, and fluorescent microscopy. These nanosized lipid bilayered vesicles carrying SAGFP in their cargo can be utilized as both a drug-delivering vehicle and a molecular tracker containing fluorescent probes in targeted drug-delivering approaches.
In summary, the engineering of BEVs for targeted therapy is the primary aim of the researchers. The study of bacterial EVs helps improve knowledge in EV engineering and drug delivery. BEVs have the potential to provide cells with important biological compounds, including enzymes, cytokines, and various growth factors, thereby minimizing a deficiency of these compounds to support host cell metabolism. Understanding the influence of medium composition corresponds to EV release, and cargo sorting mechanism is the preliminary step to investigating the characteristics of BEVs.
ACKNOWLEDGMENTS
The authors would like to thank the SRM Genetic Engineering Facility for providing the laboratory space and resources. The authors also like to thank SRM Central Instrumentation Facility for HRTEM and DLS, and SRM Department of Biotechnology for Ultracentrifugation facility.
CONFLICT OF INTEREST
The authors declare that there is no conflict of interest.
AUTHORS’ CONTRIBUTION
NSR conceived and designed the study. HH and YK performed data collection and analysis. HH wrote the manuscript. HH, YK, HSM, NSR, IS reviewed and edited the manuscript. All authors read and approved the final manuscript for publication.
FUNDING
This study was funded by the SERB and SRM Excellency with File Number: EEQ/2017/000707.
DATA AVAILABILITY
All datasets generated or analyzed during this study are included in the manuscript.
ETHICS STATEMENT
This article does not contain any studies on human participants or animals performed by any of the authors.
- Knox KW, Vesk M, Work E. Relation between excreted lipopolysaccharide complexes and surface structures of a lysine-limited culture of Escherichia coli. J Bacteriol. 1966;92(4).
Crossref - Wolf P. The nature and significance of platelet products in human plasma. Br J Haematol. 1967;13(3):269-88.
Crossref - Lee EY, Choi DY, Kim DK, et al. Gram-positive bacteria produce membrane vesicles: Proteomics-based characterization of Staphylococcus aureus-derived membrane vesicles. Proteomics. 2009;9(24):5425-5423.
Crossref - Soler N, Marguet E, Verbavatz JM, Forterre P. Virus-like vesicles and extracellular DNA produced by hyperthermophilic archaea of the order Thermococcales. Res. Microbiol.2008;159(5):390-399.
Crossref - Hughes DT, Sperandio V. Inter-kingdom signalling: Communication between bacteria and their hosts. Nat Rev Microbiol. 2008;6(2):111-120.
Crossref - Tulkens J, De Wever O, Hendrix A. Analyzing bacterial extracellular vesicles in human body fluids by orthogonal biophysical separation and biochemical characterization. Nat Protoc. 2020;15(1):40-67.
Crossref - Toyofuku M, Nomura N, Eberl L. Types and origins of bacterial membrane vesicles. Nat Rev Microbiol. 2019;17(1):13-24.
Crossref - Kaparakis-Liaskos M, Ferrero RL. Immune modulation by bacterial outer membrane vesicles. Nat Rev Immunol. 2015;15(6):375-87.
Crossref - Lee EY, Joo YB, Gun WP, et al. Global proteomic profiling of native outer membrane vesicles derived from Escherichia coli. Proteomics. 2007;7(17):3143-3153.
Crossref - Altindis E, Fu Y, Mekalanos JJ. Proteomic analysis of Vibrio cholerae outer membrane vesicles. Proc Natl Acad Sci USA. 2014;111(15):E1548-56.
Crossref - Brown L, Wolf JM, Prados-Rosales R, Casadevall A. Through the wall: Extracellular vesicles in Gram-positive bacteria, mycobacteria and fungi. Nat Rev Microbiol. 2015;13(10):620-630.
Crossref - Perez-Cruz C, Carrion O, Delgado L, Martinez G, Lopez-Iglesias C, Mercade E. New type of outer membrane vesicle produced by the gram-negative bacterium Shewanella vesiculosa M7T: Implications for DNA content. Appl Environ Microbiol. 2013;79(6):1874-1881.
Crossref - Perez-Cruz C, Delgado L, Lopez-Iglesias C, Mercade E. Outer-inner membrane vesicles naturally secreted by gram-negative pathogenic bacteria. PLoS One. 2015;10(1):e0116896.
Crossref - Li J, Azam F, Zhang S. Outer membrane vesicles containing signalling molecules and active hydrolytic enzymes released by a coral pathogen Vibrio shilonii AK1. Environ Microbiol. 2016;18(11):3850-3866.
Crossref - Turnbull L, Toyofuku M, Hynen AL, et al. Explosive cell lysis as a mechanism for the biogenesis of bacterial membrane vesicles and biofilms. Nat Commun. 2016:7:11220.
Crossref - Kulp A, Kuehn MJ. Biological Functions and biogenesis of secreted bacterial outer membrane vesicles. Annu Rev Microbiol. 2010;64:163-184.
Crossref - Beveridge TJ. Structures of gram-negative cell walls and their derived membrane vesicles. J Bacteriol. 1999;181(16):4725-4733.
Crossref - Mashburn-Warren LM, Whiteley M. Special delivery: Vesicle trafficking in prokaryotes. Mol Microbiol. 2006;61(4):839-846.
Crossref - Chronopoulos A, Kalluri R. Emerging role of bacterial extracellular vesicles in cancer. Oncogene. 2020;39(46):6951-6960.
Crossref - Lee EY, Choi DS, Kim KP, Gho YS. Proteomics in Gram-negative bacterial outer membrane vesicles. Mass Spectrom Rev. 2008;27(6):535-555.
Crossref - Horstman AL, Kuehn MJ. Enterotoxigenic Escherichia coli secretes active heat-labile enterotoxin via outer membrane vesicles. J Biol Chem. 2000;275(17):12489-12496.
Crossref - Ferrari G, Garaguso I, Adu-Bobie J, et al. Outer membrane vesicles from group B Neisseria meningitidis ִDgna33 mutant: Proteomic and immunological comparison with detergent-derived outer membrane vesicles. Proteomics. 2006;6(6):1856-1866.
Crossref - Kuehn MJ, Kesty NC. Bacterial outer membrane vesicles and the host-pathogen interaction. Genes Dev. 2005;19(22):2645-2655.
Crossref - Kesty NC, Kuehn MJ. Incorporation of Heterologous Outer Membrane and Periplasmic Proteins into Escherichia coli Outer Membrane Vesicles. J Biol Chem. 2004;279(3):2069-2076.
Crossref - Kesty NC, Mason KM, Reedy M, Miller SE, Kuehn MJ. Enterotoxigenic Escherichia coli vesicles target toxin delivery into mammalian cells. EMBO J. 2004;23(23):4538-4549.
Crossref - Thery C, Zitvogel L, Amigorena S. Exosomes: Composition, biogenesis and function. Nat Rev Immunol. 2002;2(8):569-579.
Crossref - Bunggulawa EJ, Wang W, Yin T, et al. Recent advancements in the use of exosomes as drug delivery systems. J Nanobiotechnol. 2018;16(1):81.
Crossref - Zhang M, Zang X, Wang M, et al. Exosome-based nanocarriers as bio-inspired and versatile vehicles for drug delivery: recent advances and challenges. J Mater Chem B. 2019;7(15):2421-2433.
Crossref - Ha D, Yang N, Nadithe V. Exosomes as therapeutic drug carriers and delivery vehicles across biological membranes: current perspectives and future challenges. Acta Pharm Sin B. 2016;6(4):287-296.
Crossref - Liu C, Su C. Design strategies and application progress of therapeutic exosomes. Theranostics. 2019;9(4):1015-1028.
Crossref - Antimisiaris SG, Mourtas S, Marazioti A. Exosomes and exosome-inspired vesicles for targeted drug delivery. Pharmaceutics. 2018;10(4):218.
Crossref - Lu M, Xing H, Xun Z, et al. Exosome-based small RNA delivery: Progress and prospects. Asian J Pharm Sci. 2018;13(1):1-11.
Crossref - Li X, Corbett AL, Taatizadeh E, et al. Challenges and opportunities in exosome research-Perspectives from biology, engineering, and cancer therapy. APL Bioeng. 2019;3(1):011503.
Crossref - Oves M, Qari HA, Felemban NM, et al. Exosomes: A Paradigm in Drug Development against Cancer and Infectious Diseases. J Nanomater. 2018;2018(1):689564.
Crossref - Luan X, Sansanaphongpricha K, Myers I, Chen H, Yuan H, Sun D. Engineering exosomes as refined biological nanoplatforms for drug delivery. Acta Pharmacol Sin. 2017;38(6):754-763.
Crossref - de la Torre Gomez C, Goreham R V., Bech Serra JJ, Nann T, Kussmann M. “Exosomics”-A review of biophysics, biology and biochemistry of exosomes with a focus on human breast milk. Front Genet. 2018;9:92.
Crossref - Colao IL, Corteling R, Bracewell D, Wall I. Manufacturing Exosomes: A Promising Therapeutic Platform. Trends Mol Med. 2018;24(3):242-256.
Crossref - Zhang Y, Shi L, Esfandiari L. Biophysical Characterization of Exosomes Based on their Unique Dielectric Properties. Biophys J. 2020;118(3):175a.
Crossref - Lobb RJ, Becker M, Wen SW, et al. Optimized exosome isolation protocol for cell culture supernatant and human plasma. J Extracell Vesicles. 2015;4(1):27031.
Crossref - Rosenblum D, Joshi N, Tao W, Karp JM, Peer D. Progress and challenges towards targeted delivery of cancer therapeutics. Nat Commun. 2018;9(1):1410.
Crossref - Armstrong JPK, Holme MN, Stevens MM. Re-Engineering Extracellular Vesicles as Smart Nanoscale Therapeutics. ACS Nano. 2017;11(1):69-83.
Crossref - Kowal J, Arras G, Colombo M, et al. Proteomic comparison defines novel markers to characterize heterogeneous populations of extracellular vesicle subtypes. Proc Natl Acad Sci USA. 2016;113(8):E968-77.
Crossref - Shao H, Im H, Castro CM, Breakefield X, Weissleder R, Hakho Lee. New Technologies for Analysis of Extracellular Vesicles. Chem Rev. 2018;118(4):1917-1950.
Crossref - Fu S, Wang Y, Xia X, Zheng JC. Exosome engineering: Current progress in cargo loading and targeted delivery. NanoImpact. 2020;20:100261.
Crossref - Meyer C, Losacco J, Stickney Z, Li L, Marriott G, Lu B. Pseudotyping exosomes for enhanced protein delivery in mammalian cells. Int J Nanomed. 2017;12:3153-3170.
Crossref - Haney MJ, Zhao Y, Jin YS, et al. Macrophage-Derived Extracellular Vesicles as Drug Delivery Systems for Triple Negative Breast Cancer (TNBC) Therapy. J Neuroimmune Pharmacol. 2020;15(3):487-500.
Crossref - Kim MS, Haney MJ, Zhao Y, et al. Development of exosome-encapsulated paclitaxel to overcome MDR in cancer cells. Nanomedicine. 2016;12(3):655-664.
Crossref - Kim G, Kim M, Lee Y, Byun JW, Hwang DW, Lee M. Systemic delivery of microRNA-21 antisense oligonucleotides to the brain using T7-peptide decorated exosomes. J Control Release. 2020;317:273-281.
Crossref - Jeyaram A, Lamichhane TN, Wang S, et al. Enhanced Loading of Functional miRNA Cargo via pH Gradient Modification of Extracellular Vesicles. Mol Ther. 2020;28(3):975-985.
Crossref - Masud MK, Na J, Younus M, et al. Superparamagnetic nanoarchitectures for disease-specific biomarker detection. Chem Soc Rev. 2019;48(24):5717-5751.
Crossref - Hung ME, Leonard JN. A platform for actively loading cargo RNA to elucidate limiting steps in EV-mediated delivery. J Extracell vesicles. 2016;5(1):311027.
Crossref - Li YJ, Wu JY, Wang JM, Hu XB, Cai JX, Xiang DX. Gemcitabine loaded autologous exosomes for effective and safe chemotherapy of pancreatic cancer. Acta Biomater. 2020;101:519-530.
Crossref - Jang SC, Kim OY, Yoon CM, et al. Bioinspired exosome-mimetic nanovesicles for targeted delivery of chemotherapeutics to malignant tumors. ACS Nano. 2013;7(9):7698-7710.
Crossref - Haney MJ, Klyachko NL, Zhao Y, et al. Exosomes as drug delivery vehicles for Parkinson’s disease therapy. J Control Release. 2015;207:18-30.
Crossref - Li S, Xu J, Qianc J, Gao X. Engineering extracellular vesicles for cancer therapy: recent advances and challenges in clinical translation. Biomater Sci. 2020;8(24):6978-6991.
Crossref - Dash M, Kanakaraj P, Satish R, Shahabuddin S, Raja SN. Exosomes isolated from two different cell lines using three different isolation techniques show variation in physical and molecular characteristics. Biochim Biophys acta Biomembr. 2021;1863(2).
Crossref - Alcaraz C, De Diego M, Pastor MJ, Escribano JM. Comparison of a radioimmunoprecipitation assay to immunoblotting and ELISA for detection of antibody to African swine fever virus. J Vet Diagn Invest. 1990;2(3):191-196.
Crossref - Thery C, Amigorena S, Raposo G, Clayton A. Isolation and characterization of exosomes from cell culture supernatants and biological fluids. Curr Protoc cell Biol. 2006;30(1).
Crossref - Samaeekia R, Rabiee B, Putra I, et al. Effect of Human Corneal Mesenchymal Stromal Cell-derived Exosomes on Corneal Epithelial Wound Healing. Invest Ophthalmol Vis Sci. 2018;59(12):5194-5200.
Crossref - Knol J, Sjollema K, Poolman B. Detergent-Mediated Reconstitution of Membrane Proteins†. Biochemistry. 1998;37(46):16410-16415.
Crossref - Seddon AM, Curnow P, Booth PJ. Membrane proteins, lipids and detergents: not just a soap opera. Biochim Biophys Acta. 2004;1666(1-2):105-117.
Crossref - Baumgart T, Hunt G, Farkas ER, Webb WW, Feigenson GW. Fluorescence probe partitioning between Lo/Ld phases in lipid membranes. Biochim Biophys Acta. 2007;1768(9):2182-2194.
Crossref - Nakase I, Ueno N, Matsuzawa M, et al. Environmental pH stress influences cellular secretion and uptake of extracellular vesicles. FEBS Open Bio. 2021;11(3):753-767).
Crossref - Bonsergent E, Lavieu G. Content release of extracellular vesicles in a cell-free extract. FEBS Lett. 2019;593(15):1983-1992.
Crossref - Bae W, Yoon TY, Jeong C. Direct evaluation of self-quenching behavior of fluorophores at high concentrations using an evanescent field. PLoS One. 2021;16(2):e0247326.
Crossref - Hariharan H, Kesavan Y, Raja NS. Impact of native and external factors on exosome release: understanding reactive exosome secretion and its biogenesis. Mol Biol Rep. 2021;48(11):7559-7573.
Crossref - Kuipers ME, Hokke CH, Smits HH, Nolte-’t Hoen ENM. Pathogen-Derived Extracellular Vesicle-Associated Molecules That Affect the Host Immune System: An Overview. Front Microbiol. 2018;9:2182.
Crossref - Subedi P, Schneider M, Philipp J, et al. Comparison of methods to isolate proteins from extracellular vesicles for mass spectrometry-based proteomic analyses. Anal Biochem. 2019;584:113390.
Crossref - Jahromi LP, Fuhrmann G. Bacterial extracellular vesicles: Understanding biology promotes applications as nanopharmaceuticals. Adv Drug Deliv Rev. 2021;173:125-140.
Crossref - Linares R, Tan S, Gounou C, Arraud N, Brisson AR. High-speed centrifugation induces aggregation of extracellular vesicles. J Extracell vesicles. 2015;4(1).
Crossref - Fernandez-Llama P, Khositseth S, Gonzales PA, Star RA, Pisitkun T, Knepper MA. Tamm-Horsfall protein and urinary exosome isolation. Kidney Int. 2010;77(8):736-742.
Crossref - Wachalska M, Koppers-Lalic D, van Eijndhoven M, et al. Protein Complexes in Urine Interfere with Extracellular Vesicle Biomarker Studies. J Circ biomark. 2016;5(4).
Crossref
© The Author(s) 2026. Open Access. This article is distributed under the terms of the Creative Commons Attribution 4.0 International License which permits unrestricted use, sharing, distribution, and reproduction in any medium, provided you give appropriate credit to the original author(s) and the source, provide a link to the Creative Commons license, and indicate if changes were made.