


ISSN: 0973-7510
E-ISSN: 2581-690X
Human cytomegalovirus (CMV) is the leading infectious cause of congenital infection in developing countries. However, the pathogenesis of CMV infection is poorly understood. Worldwide, CMV seropositivity varies with age and sex, but data related to these variations are lacking. Here, we examined the variation in CMV seroprevalence in three different age groups of Saudi population in an attempt to understand the variation in the relationship between CMV infection seroprevalence with age and study the risk factor liver dysfunction. Serum samples for 455 patients with elevation of liver profiles (ALT, AST, ALP and GGT) were screened for CMV- IgG and IgM and categorized in different age groups. A correlation between CMV seropositivity measured with IgG and IgMand liver enzymes were tested. Receiver operating characteristics (ROC) analysis and multiple regressions were used for data analysis. Our study shows that young people (18-25 years) had much higher IgG and IgM compared to elderly people (26 -35 and 36-45 years). A significant correlation between both antibodies and liver enzymes (AST, ALT) was recorded. Receiver operating characteristics (ROC) analysis revealed that both IgG and IgM can be used as excellent predictive markers for CMV infection as both recorded 100% specificity and sensitivity together with area under the curve of 1 in the three studied research groups. Multiple regression analysis ascertain the correlation between both antibodies as dependent variables and liver enzymes as independent variables with ALT being the most affected enzyme with CMV seropositivity. This study strongly ascertains that CMV is indeed capable of initiating and accelerating liver dysfunction especially in young people. Serological screening of individuals who are asymptomatic based on a detection of CMV-IgG and IgMmight help in early diagnosis and intervention to avoid liver disorder as cirrhosis and other complications related to CMV infection, which are associated with ALT, AST and GGT elevation.
Cytomegalovirus, Alanine transaminase(ALT), Aspartate transaminase(AST), Alkaline phosphatase(ALP), G-glutamyltranspeptidase(GGT), Liver function
Human cytomegalovirus (CMV) as a member of the herpes virus family is one of the most common infecting viruses in humans. The prevalence of congenital CMV infection varies from 0.2% to 2% (). In developing countries, the reported prevalence of congenital CMV infection varies dramatically within and between populations, with some recorded prevalence ranged from 6.1% to 14.0%2. Cytomegalovirus is human-to-human transmissible through close bodily contact, coughs and sneezes3. Because CMV infection may occur during delivery, through infected breast milk or by blood transfusion perinatal transmission are much more prevalent than other congenital infections4.
Cytomegalovirus (CMV) remains an important etiological factor for morbidity and mortality of many organ transplant recipients, patients who receive chemotherapy or high-dose corticosteroids or persons infected with human immunodeficiency virus type 1 (HIV-1) (5). It is also a major cause of infantile hepatitis6. Based on the World Health Organization (WHO) records, about 40% of all adults worldwide are infected in 2011, indicated by the presence of IgG and IgM in the general population7.
Presence of both IgM and IgG in the same sample necessitates avidity testing which helps in differentiating between a recent and non-recent primary infection8. Clinically concomitant with the remarkable increase of these antibodies, there is a mild-moderate increase of transaminases, markers of liver function and lymphomonocytosis. There is study by Vujacich, et al.,20069 reported a 6 and 3.5 fold increase in alanine transaminase (ALT) and aspartate transaminase (AST) respectively in patients with CMV infection. Here in this study we investigated CMV seroprevalence and liver enzyme profiles in different age groups of Saudi Arabia patients to find the relationship between CMV infection and risk factors for liver dysfunction.
Subjects and Methods
Study Population and Specimens
The focus of our study was tested 455 serum samples of patients with elevation of liver profiles (ALT, AST, ALP and GGT) and controls categorized in different age groups were collected from different general hospitals and polyclinics in KSA from March 2014 to June 2016 in different ages and gender .Serum samples which were tested for CMV seropositive (by detection of CMV- IgG and IgM and non- A to G hepatitis virus (non HAV, HBV, HCV, HDV, HEV and HGV).where molecular technical for Extraction of virus nucleic acid, PCR and real-time PCR were performed according to methods described by Lin and Floros, 2000 (10) for selected the samples non- A to G hepatitis virus . Whole blood samples were collected and centrifuged at 2,000 g for 15 min. Sera were taken and stored at –20 ° C. The samples were coded by date of collection, sample number, gender and age. The IRB in the Faculty of Medicine at KSU (Riyadh, KSA) approved the study. Informed consent for the collection of specimens was obtained from all cases to the collection of specimens.
Serology tests
The CMV IgG and IgM were screened in patients’ sera by using a commercially available capture enzyme-linked immunosorbent assay (ELISA) (CMV IgM and CMV IgG, Dia.Pro; Diagnostic BioprobesSrl, Italy). Samples with concentrations e” 1.10 IU/ml (WHO) were considered to be positive for anti-CMV IgG antibody and samples with concentrations d” 0.9 IU/mlwere interpreted as negative, while samples with concentrations 0.91 – 1.09 IU/ml were considered equivocal. For CMV IgM, samples were considered positive when the ratio of the sample optical density at 450 nm to the cutoff value (signal to cutoff) was >1.1;equivocal, 0.9 – 1.0; and negative, d” 0.8. ELISA assay results were analyzed in all samples included in the study.
Statistical analysis
SPSS software was used for statistical analysis. Results were expressed as mean ± SD and all statistical comparisons were made by means of independent t-test with pd”0.05 considered as significant. Pearson’s correlations between measured parameters were also presented. Receiver Operating Characteristic (ROC) analysis was performed as a comprehensive way to assess the accuracy of the studied markers as previously described (11). The area under the curve (AUC) was used provides a useful metric to compare IgG and IgM as two CMV seropositivity markers. Whereas an AUC value close to 1 indicates an excellent diagnostic and predictive marker, a curve that lies close to the diagonal (AUC = 0.5) has no diagnostic utility. AUC close to 1 is always accompanied by satisfactory values of specificity and sensitivity of the biomarker.
Multiple regression analysis was also used to find the correlation between the IgG, IgM and different liver enzymes. In this analysis R2 described the proportion or percentage of variance in the dependent variable (IgG and IgM) explained by the variance in the independent variables together which sometimes called the predictor variables (AST, ALT, ALP and GGT). An R2 of 1.00 indicates that 100% of the variation in the dependent variable is explained by the independent variables. Conversely, an R2 of 0.0 indicates the absence of variation in the dependent variable due to the independent variables. The ß coefficients values showed the direction either positive or negative and the contribution of the independent variable relative to the other independent variables in explaining the variation of the dependent variable. R2 and (ß) coefficient provide most of what we need to interpret our multiple regression data.
Table 1 and figure 1 demonstrate the high significant elevations of AST, ALT and GGT together with the non-significant change in ALP. It can be easily noticed that both transaminases (ALT and AST) together with GGT were markedly higher in the three studied age groups with the first age group (18-25 years) recording the much higher percentage increase for of ALT (139.21%) and for AST (153.95%)compared to a much lower increase in the other two studied age groups.
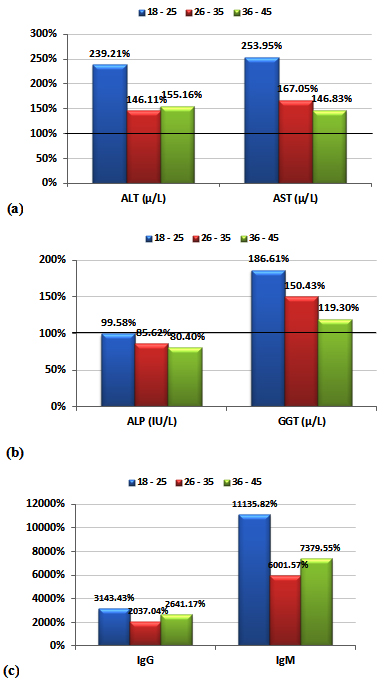
Fig. 1. (a,b,c) Percentage change of IgG and IgM all parameters in each age group
Table (1):
Comparisons of ALT, AST, ALP, GGT, IgG and IgM in the three studied age groups of CMV seropositive patients compared to healthy control participants.
| Parameter | Age Groups | Group | N | Min. | Max. | Mean ± S.D. | Percent Change | P value |
|---|---|---|---|---|---|---|---|---|
| ALT (µ/L) | 18 – 25 | Control | 15 | 17.06 | 35.09 | 25.62 ± 5.37 | 100.00 | 0.001 |
| Patients | 150 | 55.78 | 95.47 | 61.29 ± 7.35 | 239.21 | |||
| 26 – 35 | Control | 10 | 33.01 | 55.80 | 40.94 ± 10.14 | 100.00 | 0.033 | |
| Patients | 165 | 56.20 | 76.22 | 59.81 ± 3.71 | 146.11 | |||
| 36 – 45 | Control | 15 | 35.29 | 45.25 | 40.77 ± 3.33 | 100.00 | 0.001 | |
| Patients | 140 | 56.33 | 76.22 | 63.25 ± 5.35 | 155.16 | |||
| AST (µ/L) | 18 – 25 | Control | 15 | 12.56 | 22.23 | 17.09 ± 2.70 | 100.00 | 0.001 |
| Patients | 150 | 35.08 | 62.71 | 43.39 ± 6.29 | 253.95 | |||
| 26 – 35 | Control | 10 | 22.72 | 27.72 | 25.24 ± 2.05 | 100.00 | 0.001 | |
| Patients | 165 | 35.08 | 62.01 | 42.15 ± 5.58 | 167.05 | |||
| 36 – 45 | Control | 15 | 26.42 | 32.90 | 29.39 ± 1.92 | 100.00 | 0.001 | |
| Patients | 140 | 35.23 | 58.50 | 43.15 ± 5.11 | 146.83 | |||
| ALP (IU/L) | 18 – 25 | Control | 15 | 49.31 | 148.20 | 84.89 ± 31.69 | 100.00 | 0.971 |
| Patients | 150 | 45.34 | 148.20 | 84.54 ± 32.61 | 99.58 | |||
| 26 – 35 | Control | 10 | 78.45 | 120.00 | 96.50 ± 17.86 | 100.00 | 0.397 | |
| Patients | 165 | 45.02 | 148.20 | 82.63 ± 31.58 | 85.62 | |||
| 36 – 45 | Control | 15 | 67.23 | 137.30 | 94.97 ± 21.87 | 100.00 | 0.133 | |
| Patients | 140 | 45.02 | 147.30 | 76.35 ± 30.98 | 80.40 | |||
| GGT (µ/L) | 18 – 25 | Control | 15 | 12.02 | 58.46 | 31.80 ± 12.17 | 100.00 | 0.001 |
| Patients | 150 | 34.23 | 88.32 | 59.34 ± 14.73 | 186.61 | |||
| 26 – 35 | Control | 10 | 27.37 | 48.82 | 39.39 ± 9.07 | 100.00 | 0.008 | |
| Patients | 165 | 34.23 | 88.32 | 59.26 ± 13.68 | 150.43 | |||
| 36 – 45 | Control | 15 | 40.34 | 57.37 | 50.71 ± 6.53 | 100.00 | 0.010 | |
| Patients | 140 | 40.34 | 72.01 | 60.50 ± 11.90 | 119.30 | |||
| IgG | 18 – 25 | Control | 15 | 0.15 | 0.62 | 0.38 ± 0.16 | 100.00 | 0.001 |
| Patients | 150 | 3.81 | 35.05 | 11.85 ± 6.38 | 3143.43 | |||
| 26 – 35 | Control | 10 | 0.24 | 0.72 | 0.48 ± 0.21 | 100.00 | 0.001 | |
| Patients | 165 | 4.05 | 19.06 | 9.78 ± 4.08 | 2037.04 | |||
| 36 – 45 | Control | 15 | 0.14 | 0.82 | 0.40 ± 0.21 | 100.00 | 0.001 | |
| Patients | 140 | 5.22 | 19.06 | 10.60 ± 5.23 | 2641.17 | |||
| IgM | 18 – 25 | Control | 15 | 0.11 | 0.37 | 0.24 ± 0.09 | 100.00 | 0.001 |
| Patients | 150 | 12.34 | 90.29 | 26.89 ± 16.95 | 11135.82 | |||
| 26 – 35 | Control | 10 | 0.10 | 0.52 | 0.34 ± 0.18 | 100.00 | 0.001 | |
| Patients | 165 | 12.04 | 33.56 | 20.26 ± 4.64 | 6001.57 | |||
| 36 – 45 | Control | 15 | 0.11 | 0.42 | 0.27 ± 0.09 | 100.00 | 0.001 | |
| Patients | 140 | 12.34 | 34.74 | 20.21 ± 4.22 | 7379.55 |
Table (2):
Pearson’s correlations between the measured parameters.
| Parameters | Age Groups | R (Person Correlation) | Sig. | |
|---|---|---|---|---|
| IgG ~ IgM | 18 – 25 | 0.791** | 0.001 | Pa |
| 26 – 35 | 0.734** | 0.001 | Pa | |
| 36 – 45 | 0.717** | 0.001 | Pa | |
| IgG ~ ALT (µ/L) | 18 – 25 | 0.695** | 0.001 | Pa |
| 26 – 35 | 0.544** | 0.001 | Pa | |
| 36 – 45 | 0.697** | 0.001 | Pa | |
| IgG ~ AST (µ/L) | 18 – 25 | 0.580** | 0.001 | Pa |
| 26 – 35 | 0.570** | 0.001 | Pa | |
| 36 – 45 | 0.694** | 0.001 | Pa | |
| IgG ~ GGT (µ/L) | 18 – 25 | 0.464** | 0.001 | Pa |
| 26 – 35 | 0.240 | 0.137 | Pa | |
| 36 – 45 | 0.331 | 0.080 | Pa | |
| IgM ~ ALT (µ/L) | 18 – 25 | 0.695** | 0.001 | Pa |
| 26 – 35 | 0.659** | 0.001 | Pa | |
| 36 – 45 | 0.825** | 0.001 | Pa | |
| IgM ~ AST (µ/L) | 18 – 25 | 0.586** | 0.001 | Pa |
| 26 – 35 | 0.707** | 0.001 | Pa | |
| 36 – 45 | 0.800** | 0.001 | Pa | |
| IgM ~ GGT (µ/L) | 18 – 25 | 0.532** | 0.001 | Pa |
| 26 – 35 | 0.383* | 0.015 | Pa | |
| 36 – 45 | 0.548** | 0.002 | Pa |
*Correlation is significant at the 0.05 level
** Correlation is significant at the 0.01 level
aPositive Correlation
While the data in and Table 2 and figure 2 show the significant correlations between both IgG and IgM as measures of CMV seropositivity. In addition, significant correlations were also recorded between these two antibodies and AST, ALT, and GGT as measures of liver injury risk (e.g. liver cirrhosis).
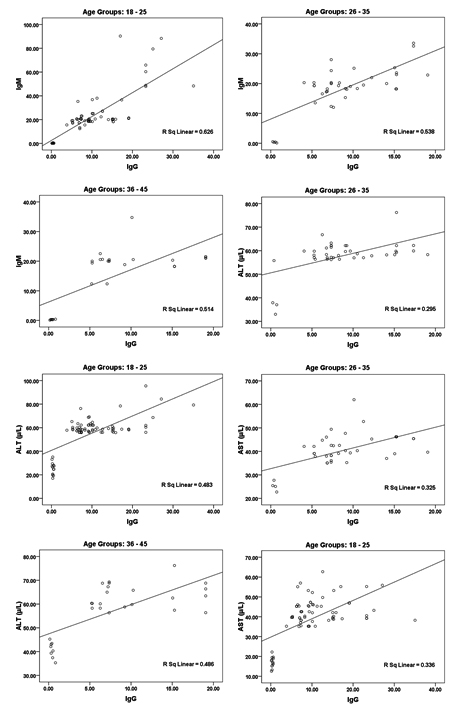
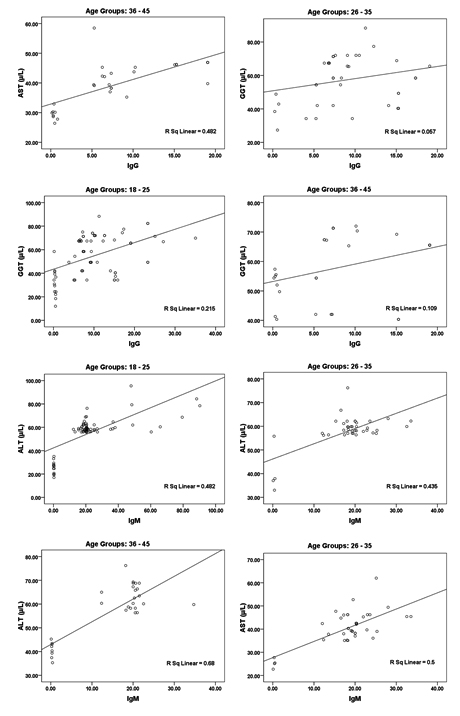
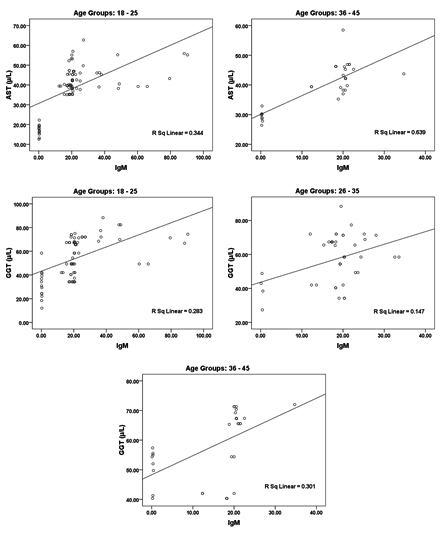
Fig. 2. Correlation between all parameters according in each age group (18 – 25, 26 – 35 and 36 – 45) with best fit line curve (positive correlation)
Table (3):
ROC-Curve of IgG and IgM according the Age groups (18–25, 26–35 and 36–45) in Patients group.
| Group | Area under the curve | Cut-off value | Sensitivity % | Specificity % | |
|---|---|---|---|---|---|
| IgG | 18 – 25 | 1.000 | 2.215 | 100.0 % | 100.0 % |
| 26 – 35 | 1.000 | 2.385 | 100.0 % | 100.0 % | |
| 36 – 45 | 1.000 | 3.020 | 100.0 % | 100.0 % | |
| IgM | 18 – 25 | 1.000 | 6.355 | 100.0 % | 100.0 % |
| 26 – 35 | 1.000 | 6.280 | 100.0 % | 100.0 % | |
| 36 – 45 | 1.000 | 6.380 | 100.0 % | 100.0 % |
Table 3 and figure 3 represent the receiver operating characteristics (ROC) analysis of IgG and IgM in male and females CMV- seropositive patients. An area under the curve equal to 1 together with 100% sensitivity and specificity were recorded for both antibodies in the three age groups of CMV patients.
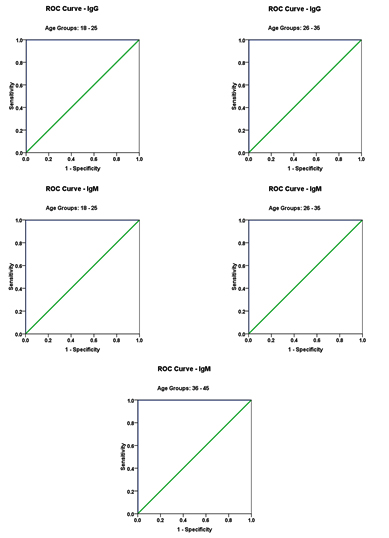
Fig. 3. ROC Curve of IgG according the age (18 – 25 and 26 – 35) and IgM according age group of patients 18 – 25 , 26-35 and 36 – 45
Table (4):
Multiple Regression using stepwise method for IgG as a dependent variable.
| Age Groups | Predictor Variable | Beta | P value | Adjusted R2 | Model | |
|---|---|---|---|---|---|---|
| F value | P value | |||||
| 18 – 25 | ALT (µ/L) | 0.331 | 0.001 | 0.476 | 69.196 | 0.001 |
| 26 – 35 | AST (µ/L) | 0.369 | 0.001 | 0.307 | 18.270 | 0.001 |
| 36 – 45 | ALT (µ/L) | 0.395 | 0.001 | 0.467 | 25.520 | 0.001 |
The results in Table 4 and 5 show the stepwise multiple regression analysis using IgG and IgM as dependent variable respectively and AST, ALT, ALP and GGT as independent variables. Adjusted R2 and ß coefficients of the different variables are listed.
Table (5):
Multiple Regression using stepwise method for IgM as a dependent variable.
| Age Groups | Predictor Variable | Beta | P value | Adjusted R2 | Model | |
|---|---|---|---|---|---|---|
| F value | P value | |||||
| 18 – 25 | ALT (µ/L) | 0.840 | 0.001 | 0.475 | 68.953 | 0.001 |
| 26 – 35 | AST (µ/L) | 0.715 | 0.001 | 0.487 | 37.967 | 0.001 |
| AST (µ/L) | 0.358 | 0.017 | 0.548 | 24.675 | 0.001 | |
| 36 – 45 | ALT (µ/L) | 0.711 | 0.001 | 0.669 | 57.468 | 0.001 |
| GGT (µ/L) | 0.258 | 0.006 | ||||
| ALT (µ/L) | 0.402 | 0.003 | 0.784 | 34.896 | 0.001 | |
| GGT (µ/L) | 0.434 | 0.024 | ||||
| AST (µ/L) | 0.231 | 0.008 | ||||
CMV infection may have important health consequences. Many studies propose that infection with CM reduce the performance of the immune system to respond to further antigenic challenge and increase the risk of developing liver dysfunction12, 13, 14. This work aims to extend these findings by investigating the effect of age on prevalence of CMV as non hepatotropic agent infection in a large number of samples that included different range of ages. The provision of information on hygiene may be an effective and inexpensive method for preventing CMV infection and control its role on liver dysfunction in future.
Patients with liver enzyme deviations are usually divided into two categories either alkaline phosphatase (ALK) or transaminases (ALT and AST) elevation. In case of alkaline phosphatase, patients generally have either cholestasis disease or infiltrative disease. Transaminases elevation is predominant and can be a marker of hepatocellular dysfunction due to viral hepatitis, autoimmune hepatitis or liver toxins.³-Glutamyltranspeptidase (GGT) levels tend to parallel alkaline phosphatase elevations that originate from the liver15,16.
The data in Table 1 demonstrates the high significant increase of both AST and ALT together with the non-significant elevation of ALP. This can ascertain the possibility to develop liver dysfunction in CMV patients. It can be easily noticed that age group 118-25 was at higher risk to develop liver dysfunction compared to the other 2 elder groups (26-35 & 36-45) which recorded much lower increase in both transaminases. Effect of CMV infection in inducing both transaminases as markers of liver dysfunction was confirmed through the elevation of IgG and IgM. as antibodies against CMV infection.
Elevated transaminases were significantly associated with both CMV seropositivity (i.e CMV patients compared to control) and high CMV antibody levels (age group 1 compared to age groups 2 and 3). Comparisons of the 3 specific age groups revealed that this association was detectable early in life (18-25 years of age).
This is in good agreement with the previous study of Lopo et al, 201113 in which they study the prevalence of CMV infection in 8 age groups of Portuguese population range from 2 to 65. They recorded that while the antibody prevalence in children at school age (age groups 5–9 years and 10–14 years) was more or less similar to that at pre-school age, it was increased to reach 71.3% in the age group between 15 and 19 years, which corresponds to a greater sexual exposure. In addition to non- sexual contact11,12, 15.
Studies with similar age groups conducted in other countries, such as the United States, Japan, France, England, Poland and Russia, describe seroprevalences ranging between 51.5% and 78.0% (17, 18, 19) which is still lower than the 136% increase recorded for 18-25 years age group of the present study. As it is well known that sexual transmission is a likely risk factor for exposure to CMV (20) so the remarkable high seropositivity in the 18-25 age group compared to the other 2 groups can be attributed to the more frequent sex intercourse, as a significant predictor of CMV infection. This much higher CMV seropositivity can be connected with the ethnic/ socioeconomic status of Saudi population. This can be supported by the study of Ghazi et al. 2002, which recorded a prevalence of 92.1% CMV total IgG antibodies in pregnant Saudi women20.
In Table 2 and figure 2 the data showing Pearson’s correlations between ALT, AST, ALP and GGT in one hand and IgG and IgM in the other hand. It can be easily noticed that both antibodies were positively correlated with high significant difference. This can suggest the importance of both as markers of CMV seropositivity. In addition both antibodies were independently correlated with the four measured liver enzymes which can ascertain the concomitant liver dysfunction associated with CMV infection. This can find a support in the recent work of21, 22 which prove that CMV infection usually induces autoimmune hepatitis and primary biliary cirrhosis. This can explain the high significant positive correlation between CMV antibodies and AST, ALT and ALP in the three age groups tested.
The receiver operating characteristics (ROC) curve as a fundamental tool for biomarkers evaluation was performed. using the same computer program. In a ROC curve the true positive rate (sensitivity) is plotted as a function of the false positive rate (100-specificity) for different cut-off points of a parameter. Each point on the ROC curve represents a sensitivity/specificity pair corresponding to a particular decision threshold. The area under the ROC curve is a measure of how well a parameter can distinguish between CMV seropositive and control subjects. The area under the curve (AUC) provides a useful measure to compare different biomarkers. Whereas an AUC value close to 1 indicates an excellent diagnostic and predictive marker, a curve that lies close to the diagonal (AUC = 0.5) has no diagnostic utility. AUC close to 1 is always accompanied by satisfactory values of specificity and sensitivity of the biomarker. From 0.9 to1 considered as excellent, 0.8 to 0.9 as good, 0.7-0.8 as fair, 0.6-0.7 as poor and 0.5-0.6 as fail. Based on this information, both antibodies can be used as excellent predictive markers for CMV infection in all three tested age groups.
In the present study, the general purpose of multiple regressions is to learn more about the relationship between several independent or predictor variables (AST, ALT, ALP and GGT), and a dependent or criterion variable(IgG or IgM) through the recorded R2 and ß coefficient values. In this analysis R2 describes the proportion or percentage of variance in the dependent variable explained by the variance in the independent variables together which sometimes called the predictor variables. An R2 of 1.00 indicates that 100% of the variation in the dependent variable is explained by the independent variables. Conversely, an R2 of 0.0 indicates the absence of variation in the dependent variable due to the independent variables. The ß coefficients values show the direction either positive or negative and the contribution of the independent variable relative to the other independent variables in explaining the variation of the dependent variable. R2 and (ß) coefficient provide most of what we need to interpret our multiple regression data. Table 4 and 5demonstrate the linear regression analysis between the measured parameters using IgG and IgM as dependent variables respectively. it can be easily noticed that both IgG and IgM show low R2 values. This suggests was expected as CMV as viral infectious disease never induced in case of liver dysfunction (22).On the other hand, ß coefficients values for AST, ALT and GGT as independent variables point out that ALT is the most important enzyme related to CMV seropositivity measured by high IgG and IgM. ALT recorded ß coefficients values of 0.840 and 0.711 in 18-25 and 26-35 age groups respectively.
In Conclusion, our results indicate a high significant association between CMV seropositivity and increased levels of AST, ALT, and GGT, as markers of liver dysfunction that may lead to liver cirrhosis in patients without hepatotropic viruses suchas HCV and HBV. Based on other studies showing that CMV seroprevalence in patients with hepatocellular carcinoma (HCC) is significantly higher than in patients without HCC and is positively correlated with liver cirrhosis23, 24. Therefore,elimination of CMV infection via the development and administration of treatments or vaccines may reduce HCC mortality rates24,Therefore, elimination of CMV infection whichis a potentially feasible and important task for preventing diseases linked to CMV infection25. Future studies will be needed to further define the role of CMV in liver disorder.
ACKNOWLEDGMENTS
The authors would like to thank King Abdul Aziz City for Science and Technology (KACST) for supporting the present work as part of NTPC funded projects No. AT-34-208.
CONFLICT OF INTEREST
The authors declare that there is no conflict of interest.
- Kenneson A, and Cannon M J. Review and meta-analysis of the epidemiology of congenital cytomegalovirus (CMV) infection. Rev Med Virol, 2007; 17(4):253-76.
- Bello C, and Whittle H. Cytomegalovirus infection in Gambian mothers and their babies. J.Clin.Pathol., 1991; 44: 366–369.
- Zhang XW, Li F, Yu XW, Shi XW, Shi J and Zhang J P. Physical and intellectual development in children with asymptomatic congenital cytomegalovirus infection: a longitudinal cohort study in Qinba mountain area, China. J.Clin.Virol., 2007; 40: 180–185.
- Chang MH, Huang HH, Huang ES, Kao, CL, Hsu HY, and Lee CY. Polymerase chain reaction to detect human cytomegalovirus in livers of infants with neonatal hepatitis. Gastroenterology, 1992; 103: 1022-1025.
- Dollard SC, Staras SA, Amin MM, Schmid, DS, andCannon MJ. National prevalence estimates for cytomegalovirus IgM and IgG avidity and association between high IgM antibody titer and low IgG avidity. Clin Vaccine Immunol. 2011; 18(11): 1895-9.
- Evans, C., Brooks, A., Anumba, D. andRaza, M. Dilemmas regarding the use of CMV-specific immunoglobulin in pregnancy. J Clin Virol. 2013; 57(2):95-7.
- Khan N, Hislop A, Gudgeon N, Cobbold M, Khanna R, Nayak L, Rickinson AB, and Moss PA. Herpesvirus-specific CD8 T cell immunity in old age: cytomegalovirus impairs the response to a coresident EBV infection. J Immunol.; 2004; 173: 7481–7489.
- Alabdali A, Al-Ayadhi L, and El-Ansary A. Association of social and cognitive impairment and biomarkers in autism spectrum disorders. Journal of Neuroinflammation, 2014; 11: 4.
- Vujacich C, Vidiella G, Barcelona L, Sturba E, and Stamboulian D. Cytomegalovirus infection with hepatic involvement in immunocompetent adults.Medicina (B Aires). 2006; 66(3):206-10.
- Lin Z, and Floros J. Protocol for genomic DNA preparation from fresh or frozen serum for PCR amplification. Biotechniques; 2000; 29: 461–466.
- Kim JM, Kim SJ, Joh J, David W, Kwon C H, Song S, Shin M, Moon JI, Kim GS, Hong SH, and Lee SK. Is Cytomegalovirus Infection Dangerous in Cytomegalovirus-Seropositive Recipients After Liver Transplantation? Liver Transplantation 2011; 17: 446–455.
- Lepiller Q, Tripathy MK, Martino VD, Kantelip B, and Herbein G. Increased HCMV seroprevalence in patients with hepatocellular carcinoma. Virol J.; 2011; 8: 485.
- Lopo S, Vinagre E, Palminha P, Paixao M T, Nogueira P, and Freitas MG. Seroprevalence to cytomegalovirus in the Portuguese population, 2002-2003. EuroSurveill. 2011; 16(25)
- Verma S, Jensen D, Hart J, and Mohanty SR. Predictive value of ALT levels for non-alcoholic steatohepatitis (NASH) and advanced fibrosis in non-alcoholic fatty liver disease (NAFLD). Liver Int. J.; 2013; 33(9):1398-405.
- Görzer I, Kerschner H, Redlberger-Fritz M, and Puchhammer-Stöckl E. Human cytomegalovirus (HCMV) genotype populations in immunocompetent individuals during primary HCMV infection. J Clin Virol, 2010; 48(2):100-103.
- Staras SAS, Dollard SC, Radford KW, Dana –Flanders W, Pass RF, and Cannon MJ. Seroprevalence of Cytomegalovirus Infection in the United States, 1988–1994. Clin Infect Dis.; 2006; 43(9):1143–51.
- Gratacap-Cavallier B, Bosson J, Morand P, Dutertre N, Chanzy B, and Seigneurin J. et. al. Cytomegalovirus seroprevalence in French pregnant women: parity and place of birth as major predictive factors. Eur J Epidemiol.; 1998; 14(2):147-52.
- Odland J, Sergejeva I, Ivaneev M, Jensen I, and Stray-Pedersen B. Seropositivity of cytomegalovirus, parvovirus and rubella in pregnant women and recurrent a borters in Leningrad County, Russia. ActaObstet Gynecol Scand.; 2001; 80(11):1025-9.
- Schillinger JA, Xu F, and Sternberg MR. et. al. National seroprevalence and trends in herpes simplexvirus type 1 in the United States, 1976–1994. Sex Transm Dis.; 2004; 31(12):753
- Ghazi HO, Telmesani AM, and Mahomed MF. TORCH agents in pregnant Saudi women. Med PrincPract.; 2002; 4:180-2..
- Gredmark S, Jonasson L, Van Gosliga D, Ernerudh J, and Sderberg-Naucler C. Active cytomegalovirus replication in patients with coronary disease. ScandCardiovasc J, 2007; 41:230-234.
- Korndewal MJ, Mollema L, Tcherniaeva I, van der Klis F, Kroes AC, Oudesluys-Murphy AM, Vossen AC, and de Melker HE. Cytomegalovirus infection in the Netherlands: seroprevalence, risk factors, and implications. J ClinVirol.; 2015; 63:53-8.
- Serghini M, Labidi A, Khsiba A, Boubaker J, and Filali A. Cytomegalovirus infection simulating an overlap syndrome: autoimmune hepatitis -primary biliary cirrhosis. Tunis Med.; 2014; 92(10):652-3.
- Cheng KS, Tang HL, Chou FT, Chou JW, Hsu CH, Yu CJ, Kao ST, and Li TC. Cytokine evaluation in liver cirrhosis and hepatocellular carcinoma. Hepatogastroenterology. 2009; 56:1105–1110.
- Kokudo N, and Makuuchi M. Evidence-based clinical practice guidelines for hepatocellular carcinoma in Japan: the JHCC guidelines. J Gastroenterol.; 2009; 44 :119-21.
© The Author(s) 2018. Open Access. This article is distributed under the terms of the Creative Commons Attribution 4.0 International License which permits unrestricted use, sharing, distribution, and reproduction in any medium, provided you give appropriate credit to the original author(s) and the source, provide a link to the Creative Commons license, and indicate if changes were made.