


ISSN: 0973-7510
E-ISSN: 2581-690X
The genetic analysis of the Single Nucleotide Polymorphisms, for miR- 196a2 gene by using PCR-SSCP technique that there were non-significant difference in the genotype polymorphisms between patients and control. On the other hand, the statistical analysis for the role of microRNAs genes in the hormones and physiological parameters found that the genotype pattern (A) of miR-196a2 show more effects in changes of the parameters (cortisol, testosterone, estradiol, insulin, glucagon, Fasting Blood Glucose (FBG), insulin resistance, insulin sensitivity, microalbuminuria systolic and diastolic pressure). The variation in the genotype of miR-196a2 and its effect on the physiological parameters increase the risk of CVD in type 2 diabetes patients.
Type 2 diabetes, microRNA, miR-196a2, Polymorphism, SSCP technique
The type 2 diabetes represent complex disease which results from the combination between behavioral, genetic and environmental factors (Chen et al., 2011). It is distinguished by insulin resistance represented by inability of the body to use insulin effectively and inadequate insulin secretion from pancreas resulting in high blood glucose levels) hyperglycaemia). (ADA, 2013).
Type 2 diabetes is heritable disease in approximately 26-69% of states (Almegren et al.,2011). The researches in genetic factors have been found the presence of genetic loci are susceptible for type 2 diabetes and there are genetic variation in other regulatory regions could give a contribution to the phenotype (Franks et al.,2013).
MicroRNAs recently received great attention as important genomic regulators in different pathways such as differentiation of hemopoietic cells, proliferation of cells, developments of organs and apoptosis (Muhonen and Holthofer, 2009). Moreover, several researches indicating that microRNAs have a great role in the homeostasis of glucose and it is believed to be participated in the pathogenesis of diabetes and it can be used for distinguishing its complication as biomarker (Rottiers and Näär ,2012). so this study aimed to identify polymorphisms in miR-196a2 in patients with type 2 diabetes and evaluate its role in some hormones and physiological parameters.
The study subjects comprised from 80 patients suffer from type 2 diabetes without any complications selected from AL-Sader Teaching Hospital ( male and female ) with different duration of disease range from ( 1-20 years ), the control group study included 40 people apparently healthy and this group matched with patient group. All subjects in this study were taken consent before participation in this study. Venous blood samples were drawn from patient and control subjects by using disposable syringes (5mL) in the sitting position. Five ml of blood were obtained from each subject by vein puncture pushed slowly into disposable tubes containing separating gel was allowed to clot at room temperature for 10-15 minutes and then centrifuged at 2000 × g for approximately 10-15 minutes then the sera were obtained and stored at -20°C until analysis ( hormonal assayed ).
Urine samples are collected in the first morning from patients and control groups in special container for this purpose and the test was conducted as soon as possible. The COMBINA 13 Strips kit was used to determine microalbuminuria levels in urine. It is based on the “protein error” principle of the indicator, which is caused by the presence of albumin. Sulfonephthalein has a high sensitivity for albumin ( Thomas, 2008).
Measurement of arterial blood pressure for each patient in the sitting position by using Mercury sphygmomanometer two additional times, waiting a five minutes between measurements and then take the reading rates.
Determination of fasting blood glucose ( FBG)
The RanDox kit was used to determine serum Glucose levels. It is based on the PAP enzymatic determination of glucose ( Barham and Trindoer method,1972).
Hormonal assay
Hormones ( Cortisol, Testosterone, Estradiol, Glucagon and Insulin) are assayed by using the Monobind ELISA Kit which was based on standard sandwich enzyme-linked immune-sorbent assay technology (Mohsen et al., 2016).
Determination of insulin resistance and insulin sensitivity
Insulin resistance is evaluated by determination of homeostasis model assessment of insulin resistance ( HOMA-IR) ( Mathews et al., 1985; Stumvoll and Gerich, 2001) and calculate by using the following equation
IRHOMA = ( I0 × G0) / 22.5
Where: IRHOMA: insulin resistance according to homeostasis model assessment.
I0: Fasting insulin level.
G0: Fasting glucose level.
The quantitative insulin sensitivity check index (QUICKI) is derived using the inverse of the sum of the logarithms of the fasting insulin and fasting glucose ( Katz et al., 2000).
1 / (log(fasting insulin µU/mL) + log(fasting glucose mg/dL)
DNA Extraction and genotyping
Genomic DNA was extracted from white blood cells ( WBCs ) for both diabetes and control group using ( Geneaid ) DNA extraction kit. The selected miRNA gene (miR-196a2 (rs11614913 C-T)) F:5′- TCCTCCAGATAGATGCAAAGC-3′; R: 5′-GAGGGTAGGAGTGGGAGAGG-3′ was amplified by PCR with annealing temperature 57.8 and analyzed by Single Strand Conformation Polymorphism ( SSCP) technique preparation ( Sambrook and Rushell, 2001, Al-Terehi et al., 2016).
Statistical analysis
All statistical analysis were performed by using SPSS 17 version. Data were expressed as (mean ± SD) by using T-test. The normality of the distribution of all variables was assessed by the students ANOVA test and Pearson correlation analyses that have been used to determine the significant difference between the groups ( Al-Mashhadni and Al-Mashhadni ,1989).
The association of study groups ( Patient Vs Controls )
This study showed that the majority of patients with diabetic are female (67.5%) , (87.5%) of them are not employed and (81.25%) from urban area. There are significant association between patients and control regarding the occupation, CVD, Nephropathy ,hypertension, meanwhile there is no significant association between patients and control with regarding gender ,residence and family history as shown in table (1).
Table (1):
The association of study groups by study variables.
| Variable | Case No.(%) |
Control No.(%) | Odds ratio | 95%CI | P-value | |
|---|---|---|---|---|---|---|
| gender | ||||||
| Male | 26 (32.5%) | 16 (40%) | 0.705 | 0.39-1.26 | 0.23 | |
| Female | 54 ( 67.5%) | 24 ( 60%) | ||||
| Residence | ||||||
| Urban | 65(81.25%) | 29(72.5%) | 1.65 | 0.85 – 3.21 | 0.135 | |
| Rural | 15 (18.75%) | 11 (27.5%) | ||||
| Occupation | ||||||
| Employee | 10 ( 12.5%) | 23(57.5%) | 0.108 | 0.053 -0.219 | < 0.0001* | |
| Not employed | 70 ( 87.5%) | 17(42.5%) | ||||
| Family history | ||||||
| Present | 67 ( 83.75%) | 30 (75%) | 0.175 | 0.86 – 3.52 | 0.117 | |
| Absent | 13( 16.25%) | 10(25%) | ||||
| CVD | ||||||
| Yes | 19 ( 23.75%) | 0 (0%) | 0.023* | |||
| No | 61 ( 76.25%) | 40 (100%) | ||||
| Nephropathy | ||||||
| Yes | 16 (20%) | 0 (0%) | 0.036* | |||
| No | 64 (80%) | 40 (100%) | ||||
| Hypertension | ||||||
| Yes | 22 (27.5%) | 0 (0%) | 0.016* | |||
| No | 58 (72.5%) | 40 (100%) | ||||
DNA extraction
The results of present study show that the DNA has (50-200)ng and purity (1.7-2.2) as show in figure (1).
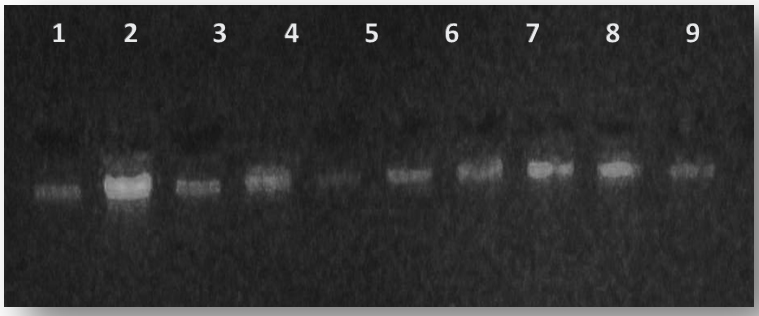
Fig. 1. The electrophoresis pattern ofDNA extracted from blood for patients with type 2 diabetes and con-trol,1% agarose ,75V,20Am for 1h.(10µl in each well).lane 1-5 DNA from patient, lane 6-10 DNA from control
MIR-196a2 genotyping
Figure (2) : The electrophoresis pattern of PCR product for MIR-196a2 gene ,this amplification product one band 174 bp for both patients and control ,1% agarose ,75V,20Am for 1h.Lane DNA marker, lane 1-10 PCR product of patient, lane 11-17 PCR products of control.
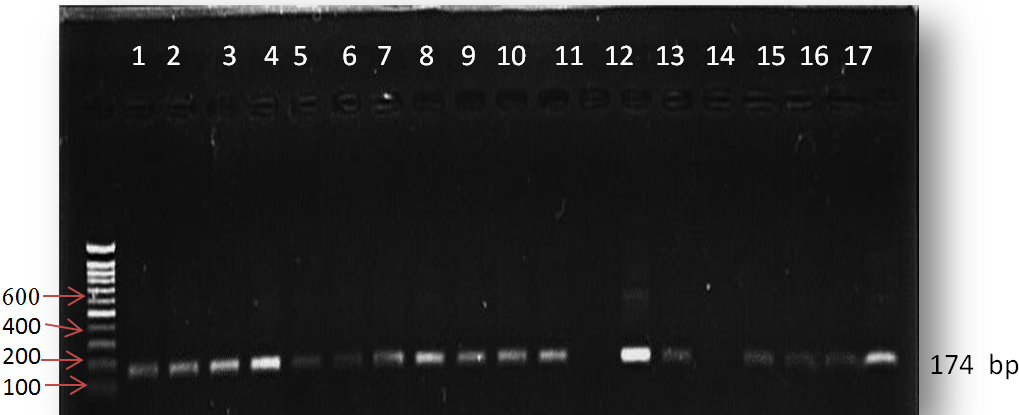
Fig. 2. The electrophoresis pattern of PCR product for MIR-196a2 gene ,this amplification product one band 174 bp for both patients and control ,1% agarose ,75V,20Am for 1h.Lane DNA marker, lane 1-10 PCR product of patient, lane 11-17 PCR products of control
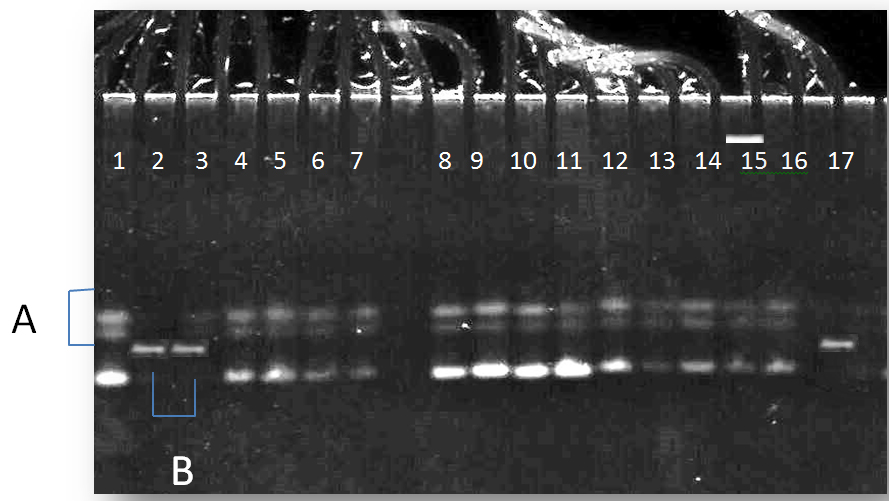
Fig. 3. The electrophoresis pattern of PCR-SSCP technique for MIR-196a2 gene, ( Pattern A:3 bands) and (Pattern B:one band)for both patients and control
PCR-SSCP MIR-196a2 gene
The genotype distribution of MIR-196a2 gene polymorphism in patients and control
The pattern A were more frequent in the patients with type 2 diabetes (83%) than control group with odd ratio (0.7059) but there were non-significant differences between the two groups as shown in table (2).
Table (2):
The genotype distribution and of MIR-196a2 gene polymorphism in patients and control.
P-value |
CI 95% |
OD ratio |
Control% |
Patients% |
Pattern name |
|---|---|---|---|---|---|
0.351 |
0.03391 -1.4696 |
0.7059 |
76 |
83 |
A |
0.222 |
0.3237 – 1.2995 |
0.6486 |
24 |
17 |
B |
Role of MIR-196a2 in some hormonal and physiological parameters levels rate in type 2 diabetic patients and control subjects
The statistical analysis of this study shows the presence of significant differences ( p £ 0.05 ) between patients and control groups in all parameters. According to pattern of MIR-196a2 genotype, the statistical analysis show the presence of significant differences in testosterone, estradiol, insulin, glucagon FBG, insulin resistance, insulin sensitivity, microalbuminuria, systolic and diastolic pressure in patients with type 2 diabetes who have pattern A when compared with patients who have pattern B. On the other hand, according to genders, there were significant differences in testosterone levels rate in males and females when compared with each other.
In the control group, the statistical analysis indicate significant differences in estradiol, glucagon, insulin resistance and systolic pressure levels rate in control subjects who have pattern A when compared with subjects who have patternB. According to genders in control group, there were significant differences in testosterone and estradiol levels rate in males and females when compared with each other, as shown in table (3).
Table (3):
Role of MIR-196a2 in some hormonal and physiological parameters levels rate in type 2 diabetic patients and control subjects.
| Group parameters |
Control Mean ± SD |
Diabetes Mean ± SD |
P value of gender | P value of group |
||
|---|---|---|---|---|---|---|
| male | female | male | female | |||
| Cortisol (µg/dl) (A ) | 10.41± 1.47 |
12.89± 3.6 |
19.98± 5.62 |
21.51± 1.99 |
0.11 | 0.005 |
| (B) | 11.27± 3.54 |
12.64± 2.77 |
19.16± 3.99 |
19.01± 2.49 | 0.37 | 0.01 |
| P value Of group | 0.25 | 0.16 | ||||
| P value of gender | 0.34 | 0.20 | ||||
| Testosterone (ng/ml) (A ) | 4.08± 1.04 |
0.48± 0.07 |
2.14± 0.55 |
0.89± 0.042 |
0.04 | 0.008 |
| (B) | 5.21± 0.64 |
0.39± 0.04 |
3.30± 1.35 |
0.78± 0.049 |
0.05 | 0.02 |
| P value Of group | 0.07 | 0.04 | ||||
| P value of gender | 0.01 | 0.05 | ||||
| Estradiol (Pg /ml) (A ) | 52.15± 7.23 |
102.78± 16.51 | 83.65± 18.13 |
53.12± 11.64 |
0.02 | 0.01 |
| (B) | 44.30± 10.3 |
108.65± 4.62 | 78.78± 10.82 |
67.93± 13.57 |
0.03 | 0.04 |
| P value Of group | 0.05 | 0.03 | ||||
| P value of gender | 0.01 | 0.32 | ||||
| Insulin (µIU/ml)(A ) | 10.83± 2.11 |
9.95± 1.26 |
14.21± 2.31 |
15.01± 3.65 |
0.27 | 0.05 |
| (B) | 9.77± 1.60 |
7.45± 2.33 |
12.6± 0.24 |
13.59± 1.15 |
0.18 | 0.04 |
| P value Of group | 0.10 | 0.05 | ||||
| P value of gender | 0.23 | 0.16 | ||||
| Glucagon (Pg/ml)(A ) | 89.78± 13.41 |
92.02± 21.04 |
106.53± 17.0 |
104.11± 10.66 |
0.14 | 0.05 |
| (B) | 76.12± 12.7 |
85.43± 9.51 |
102.40± 2.20 |
101.89± 2.11 |
0.25 | 0.03 |
| P value Of group | 0.05 | 0.05 | ||||
| P value of gender | 0.12 | 0.22 | ||||
| FBG(mg/dl) (A ) | 96.28± 6.77 |
101.72± 8.34 |
230.33± 10.3 |
215.32± 9.65 |
0.18 | 0.002 |
| (B) | 87.17± 3.89 |
95.32± 8.46 |
218± 2.86 |
200.76± 4.42 |
0.22 | 0.02 |
| P value Of group | 0.06 | 0.05 | ||||
| P value of gender | 0.44 | 0.18 | ||||
| Insulin resistance(A ) | 3.49± 0.21 |
2.22± 0.8 |
8.15± 2.05 |
7.97± 0.85 |
0.23 | 0.009 |
| (B) | 1.79± 0.03 |
2.05± 0.17 |
7.4± 1.49 |
6.19± 1.45 |
0.09 | 0.007 |
| P value Of group | 0.05 | 0.05 | ||||
| P value of gender | 0.23 | 0.09 | ||||
| Insulin sensitivity(A ) | 0.33± 0.06 |
0.32± 0.01 |
0.05± 0.004 |
0.07± 0.002 |
0.14 | 0.01 |
| (B) | 0.43± 0.1 |
0.35± 0.09 |
0.10± 0.06 |
0.16± 0.026 |
0.36 | 0.03 |
| P value Of group | 0.28 | 0.04 | ||||
| P value of gender | 0.16 | 0.30 | ||||
| Microalbuminuria(mg/l) (A ) | 14.86± 0.72 |
15.63± 0.65 |
69.32± 2.11 |
71.34± 2.47 |
0.42 | 0.009 |
| (B) | 11.42± 0.21 |
12.36± 0.53 |
60.52± 4.88 |
59.03± 8.90 |
0.17 | 0.004 |
| P value of group | 0.06 | 0.02 | ||||
| P value of gender | 0.31 | 0.29 | ||||
| Systolic pressure(mm Hg)(A ) | 127.95± 9.54 |
123.25± 11.74 |
143.85± 16.7 |
141.16± 11.35 |
0.16 | 0.004 |
| (B) | 120.17± 17.52 |
117.13± 10.33 |
137.06± 7.16 |
136.42± 10.51 |
0.25 | 0.01 |
| P value of group | 0.05 | 0.04 | ||||
| P value of gender | 0.34 | 0.25 | ||||
| Diastolic pressure(mm Hg)(A ) | 77.54± 9.31 |
73.11± 21.26 |
91.38± 9.06 |
86.53± 8.57 |
0.26 | 0.01 |
| (B) | 70.43± 8.26 |
67.39± 7.55 |
84.29± 14.09 |
79.32± 5.62 |
0.15 | 0.02 |
| P value of group | 0.10 | 0.03 | ||||
| P value of gender | 0.22 | 0.11 | ||||
t-test at P ≤ 0.05
(Mean ± SD): Mean± Standard Deviation
The results of present study show that the DNA has (50-200)ng and purity (1.7-2.2) as show in figure (1).
The role of microRNA was studied in cancer in more researchers, there is a few studies about its genotyping and genotyping role in physiological parameters, as a results of these reasons the present study was suggested to study genotyping of microRNA and its role in some physiological parameters in common disease, T2D. The amplification of miR-196a2 gene was 174 bp as shown in figure (2).
The results of gene polymorphism show that the pattern A in the miR-196a2 gene was more frequent in patients with type 2 diabetes than control group but there were non-significant differences between the patients and control groups as shown in table (3). Saunders, et al., (2007) identified 65 SNPs (including indel polymorphisms) in 49 pre-miRNAs, thus exhibiting a SNP density of 1.3 SNPs per kb, they also queried dbSNP for the flanking regions around the pre-miRNAs. As the regions flanking miRNAs are most often intergenic regions, likely with weak or no functional constraint, these regions exhibit a higher SNP density of 3 SNPs per kb and this may explain the polymorphisms that found in miR-196a2 in the current study .
MicroRNAs have important role in gene expression regulation where miRNAs can inhibit translation at some stage after initiation(Ambros et al.,1993). Evidence that miRNA scan inhibit initiation dependent on eIF4E, The idea that miRNAs regulate mRNA translation at some stage after the initiation explained by Pillai et al., studied repression by endogenous let-7a miRNA in HeLa cells, using luciferase reporters with three bulged target sites in the 32 -UTR, with sequestration of let-7a using an antisense 22 -O-methyl oligonucleotide serving as a control, by these mechanisms miR-196a2 working and exert their regulating effects (Pillaiet al.,2005; Jeonet al.,2013).
Other study found that when performed of genotyping to mir-196a2 in patient with type 2 diabetes found that the T allele and TT genotype were significantly more frequent in patients with CVD and type 2 diabetes compared to those without CVD and the highest risk of development of CVD was observed in the additive model for TT homozygotes and this suggest that miRNA-196a2 T/C polymorphism (rs11614913) is associated with an increased risk of CVD in type 2 diabetes patients (Buraczynska et al.,2014) and this explain the polymorphisms that occur in miR-196a2 as shown in figure (4-71.6).
ACKNOWLEDGMENTS
None.
CONFLICT OF INTEREST
The authors declare that there is no conflict of interest.
- Jeon,Y.J.; Kim, O.J.; Kim, S.Y.; Oh, S.H.; Oh,D.; Kim, O.J.; Shin, B.S.; and Kim,N.K. Association of the miR-146a, miR-149, miR-196a2, and miR-499 Polymorphisms With Ischemic Stroke and Silent Brain Infarction Risk. Arteriosclerosis, Thrombosis, and Vascular Biology.; 2013; 33: 420-430
- Mathews, D., Hosker, J. and Naylor, B. Insulin resistance and beta-cell functioning from fasting plasma glucose and insulin concentration in man. Diabetologia ., 1985; 28: 412-419
- Katz A, Nambi SS, Mather K, Baron AD, Follmann DA, Sullivan G, Quon MJ. Quantitative insulin sensitivity check index: a simple, accurate method for assessing insulin sensitivity in humans. J Clin Endocrinol Metab., 2000; 85(7): 2402-10
- Stumvoll, M and Gerich, J. Clinical features of insulin resistance and beta cell dysfunction and the relationship to type 2 diabetes. Clin Lab Med, 2001; 21: 31–51.
- Al-Mashhadni,M. and Al-Mashhadni ,K. Experimental design and analysis. Baghdad university. 1989; p:63
- Sambrook,J. and Russell ,D.W. Molecular cloning. A laboratory manual. 3rd edition ,Cold Spring Harbor, 2001; NewYork
- Saunders,M.A.; Liang,H. and Li,W.H. Human polymorphism at microRNAs and microRNA target sites. Proc Natl Acad Sci U S A, 2007; 27; 104(9): 3300–3305.
- Ambros, V ;Lee, R.C.and Feinbaum, R.L. The C. elegans heterochronic gene lin-4 encodes small rnas with antisense complementarity to lin-14. Cell., 1993; 75: 843-854.
- Pillai, R. S.; Bhattacharyya, S. N. ; Artus, C. G.; Zoller, T. ; Cougot, N. ; Basyuk, E.; Bertrand, E. and Filipowicz, W. Inhibition of translational initiation by let-7 microRNA in human cells. Science, 2005; 309: 1573–1576.
- Buraczynska, M; Zukowski ,P; Wacinski, P; Ksiazek, K, and Zaluska, W. Polymorphism in microRNA-196a2 contributes to the risk of cardiovascular disease in type 2 diabetes patients. J Diabetes Complications.; 2014; 28(5):617-20.
- Thomas,L.(2008).Labor and Diagnose,17th ed.,TH-Books.
- Barham,D. and Trinder,P.(1972).Analyst;97-142.
- American Diabetes Association (ADA )Statement. Diagnosis and classification of diabetes mellitus. Diabetes Care., 2013; 36: 67-74.
- Chen, L., Magliano, D.J., and Zimmet, P.Z. The worldwide epidemiology of type 2 diabetes mellitus: present and future perspectives. Nature reviews endocrinology 2011. Available at: www.nature.com/uidfinder.
- Franks, P.W.; Pearson, E.; and Florez, J.C. Gene-environment and gene-treatment interactions in type2 diabetes: Progress, pitfalls, and prospects. Diabetes Care., 2013; 36: 1413–1421.
- Almgren, P.; Lehtovirta, M.; Isomaa, B.; Sarelin, L.; Taskinen, M.R.; Lyssenko, V.; Tuomi, T.;and Groop, L. Heritability and familiality of type 2 diabetes and related quantitative traits in the Botnia Study. Diabetologia., 2011; 54: 2811–2819.
- Muhonen,P. and Holthofer,H. Epigenetic and microRNA-mediated regulation in diabetes. Nephrol Dial Transplant. 2009; 24(4): 1088–1096.
- Rottiers V,and Näär AM. MicroRNAs in metabolism and metabolic disorders. Nat Rev Mol Cell Biol.; 2012; 13(4):239-50.
- Mohsen.I.H,Zaidan H.k and al-saadi A.H. Estimation of sex hormones in type 2 diabetes patients. IJPT, 2016; 9,06,476-487.
- Mohsen.I.H,Zaidan H.k and al-saadi A.H. Interaction of insulin hormone with microalbuminuria and blood pressure in type 2 diabetic patients.journal of babylon university /pure and applied sciences, 2016; 24(5).
- Al-Terehi M. , Hasan A. , AL-Jboory M Al-Saadi A. , Zaidan H. , Obiad S. Haplotype Polymorphisms in Cytokines Genes Using Pcr-Sscp Technique in Iraqi Breast Cancer Patients, Der Pharma Chemica, 2016, 8(22):27-31
© The Author(s) 2018. Open Access. This article is distributed under the terms of the Creative Commons Attribution 4.0 International License which permits unrestricted use, sharing, distribution, and reproduction in any medium, provided you give appropriate credit to the original author(s) and the source, provide a link to the Creative Commons license, and indicate if changes were made.