

ISSN: 0973-7510
E-ISSN: 2581-690X
Bacteria are capable of evolving high doses of the drug in various infections by forming biofilms. Perhaps, biofilm regulator genes have different frequencies in β-lactam producing non-fermentative Gram-negative Bacilli (NFGNB). In this study, we investigated the role of biofilm operons of Pseudomonas aeruginosa and Acinetobacter baumannii on the prevalence of different β-lactamase enzymes. One-hundred twenty (120) nosocomial NFGNB isolates were collected from different clinical samples of patients. PCR method was used for the amplification of resistance genes. Isolates were collected, including 50 isolates (41.66%) of P. aeruginosa and 70 isolates (58.33%) of A. baumannii. The distribution of ESBL, AmpC, KPC, and MBL β-lactamase enzymes in P. aeruginosa and A. baumannii isolates were 64%, 58%, 38%,44%, and 57.14%, 60%, 32.85%, 34.28%, respectively. The frequency of csuABC, pgaABC operon in A. baumannii were as follows: pgaA (45.71%), pgaB (32.85%), pgaC (42.85%), csuA (34.28%), csuB (32.85%), csuC (41.42%), and ompA (38.57%). Further, the prevalence of pslABC and pelABC operons in P. aeruginosa isolates were as follows: pslA (58%), pslB (58%), pslD (60%), pelA (64%), pelB (38%), pelC (44%), and algD (68%). This study revealed that the abundance of biofilm regulator genes in NFGNB strains is affected by different β-lactamase enzymes.
β-lactamase enzymes, Biofilm formation, Antibiotic resistance, Virulence factors, non-fermentative Gram-negative Bacilli
Non-fermenting Gram-negative bacilli (NFGNB) pose a particular difficulty for the healthcare community. They are resistant to three or more drugs, and essential members of this group are Pseudomonas aeruginosa and Acinetobacter baumannii1. The recently extended spectrum of β-lactamases and carbapenemase resistance is reported in nosocomial infections2-4. Multidrug-resistant (MDR) strains carrying extended-spectrum β-lactamases (ESBLs) have become a growing problem worldwide5.
The major challenge of biofilm removal is addressing their increased resistance to disinfection6. Induction of antimicrobial-degrading enzymes and biofilm operons have been found in biofilm-grown P. aeruginosa. In NFGNBs, there are many genes involved in controlling and producing biofilms, then each of these genes is specific to the genus and bacterial species7,8. The gene clusters of P. aeruginosa involved in biofilm formation have been studied, and two biofilm-forming operons, pel, and the psl have been identified in P. aeruginosa5. The pel operon affects biofilm maturation, and the psl operon affects biofilm initiation8. The expression of biofilms by A. baumannii clinical isolates, accompanied with changes in genetic expression, has been reported by several studies5. Nevertheless, several genes have been associated with biofilm formation in A. baumannii. CsuABC, bap, OmpA, and pgaABCD are some of these6.
Some studies have reported that there is a relationship between biofilm formation and antibiotic resistance. However, some environmental factors may indicate the activity of biofilm formation and β-lactamase enzymes9,10. In other words, the presence of the ESBL, AmpC, MBL, and KPC enzymes may alter the biological activity of the organism and increase the pathogenicity and spread of the infection11.
Therefore, the aim of this study was to investigate the frequency of biofilm regulating genes in different strains of A. baumannii and P. aeruginosa. We also intend to determine the relationship between different beta-lactamase enzymes and the abundance of biofilm-forming genes.
Study design
A cross sectional study design utilizing a systematic random sampling technique was adopted. Admitted patients who had stayed for over 48 hours with catheters; tubing’s, surgical wounds, burn wounds and whose consent wassought and given were eligible. Those patients whodid not meet these criteria were excluded from this study. One-Hundred twenty (120) isolates of nosocomial gram-negative were obtained from the Hamadan’s Hospitals between Jun 2018 and Oct 2019.
Isolation, and identification of gram-negative bacteria
All collected samples were inoculated onto Nutrient Agar (Merck, Germany) and MacConkey Agar (Merck, Germany) and incubated aerobically at 37°C for 24 hr. Also, biochemical reactions (such as indole production, MR/VP test, Urea hydrolysis, Aesculin hydrolysis) were done. Finally, the 16sRNA gene was used for molecular confirmation of P. aeruginosa and A. baumannii isolates. The Ethical Council approved (Ethical NO:17130507962001) the present study of Research of the Faculty of Basic Sciences, Hamadan Branch, Islamic Azad University, Hamadan, Iran.
Determination of Antibiotic Resistance Pattern
The isolates were subjected to antibiotic susceptibility testing by employing Kirby Bauer disc diffusion techniques according to Clinical and Laboratory Standards Institute (CLSI) 2018 guidelines12. In the present study, susceptibility was tested against piperacillin(30µg), ticarcillin(75µg), cefepime(30µg), ceftazidime(30µg), meropenem(10µg), imipenem(10µg), amikacin(30µg), gentamicin(30µg), tetracycline(30µg), ciprofloxacin(5µg), and trimethoprim/sulfamethoxazole (1.25/23.75µg) (STX) antibiotics procured commercially from Hi-media laboratories Ltd, Mumbai. The diameter of the zone was measured and interpreted according to the guidelines of CLSI. For quality control, Klebsiella pneumoniae ATCC 70063 and Enterobacter Creole NCBT 13406 were used in the study.
Screening and confirmation of ESBLs and AmpC producer strains
ESBL and AmpC producing strains were identified using the MAST AmpC + ESBL detection set (UK, MAST, code: D68C) based on manufacturer instruction. Klebsiella pneumoniae ATCC 70063, Escherichia coli ATCC 25922, and Enterobacter Creole NCBT 13406 were used as a positive control.
Screening and confirmation of MBL and KPC producer strains
For the detection of MBL producing strains, EDTA-imipenem microbiological (EIM) was used. For the detection of carbapenemase-producing strains, the Modified Hodge test (MHT) was used13.
Screening of biofilm producer strains
Biofilm production was assessed using a crystal violet microtiter plate assay according to the method of Ghadaksaz et al study11. The OD of each well was measured at 550nm and 595nm using the microplate reader (Omega Fluostar, Germany). Bacterial biofilms were classified based on an OD cut-off ODc as described. In this case, P. aeruginosa PAO1 and A. baumannii ATCC 19606 was used as the positive control, and the culture medium used as negative controls.
DNA Extraction
DNA was prepared for PCR according to the method described previously with some modifications13. Briefly, the organisms were grown overnight, and from that young culture of P. aeruginosa were taken in a 2 ml microcentrifuge tube and centrifuged it at 3000 rpm for 10 minutes. Then the supernatant was discarded, and 100µl of 1X Tris-EDTA buffer (10 mM Tris-HCl, 1mMEDTA [pH 8]) was added to the pellet. The microcentrifuge tubes were placed in a water bath at 100°C for 10 minutes and immediately cooled on Ice. Following centrifugation, the supernatant was used as a template for PCR.
Biofilm operons Genes Detection
Primer sets used were obtained from Macrogen, Korea (Table 1). Template DNA in a volume of 2μL was added to the 12.5μL master mix (Ready Mix TMTaq PCR Reaction Mix, Sigma) with 0.4μM of each primer for a final volume of 25μL in each PCR. DNA templates were subjected to one regime of amplification. After initial denaturation at 95°C for 5min. The PCR cycling consisted of initial denaturation at 94°C for 5 min, followed by 35 cycles of 94°C for 1min annealing at 55 to 61°C (according to Table 1), 72°C for 90 sec and a final extension at 72°C for 5 min. The PCR products (10μL) were analyzed by electrophoresis on 1%agarose gel. Finally, the amplified bands in the gel were visualized by a trans-illuminator (UV light) to confirm the PCR products.
Table (1):
Oligonucleotide sequences used in this study.
| Target | Gene | Sequence of Primers | Product size(bp) | Ref |
|---|---|---|---|---|
|
csuABC operon |
csuA | F: TGGTACAGCAGTAGCTTGGC R: GACGGTGGTGAACGTACAGA |
156 | 6 |
| csuB | F: GGCAAACTTTCCGTACAACGA R: ATGCAGCAGATCCTCAGCTC |
187 | 6 | |
| csuC | F: GAAGCATCTTGCTCGTTGCC R: TTCGCTTAACCAAAAGCGCC |
109 | 6 | |
|
pgaABC operon |
pgaA | F: CCCGCTTCAAAATGCTGCTT R: AAGGCTATTCGACGCACCTC |
186 | 6 |
| pgaB | F: ATGCATCTGGGCTTGCATCT R: GTGACAGAGCAGGCAAAAGC |
190 | 6 | |
| pgaC | F: ACGAATCGTTTGTCGGACCT R: ATGGTAGGAGGCCTCTGGTT |
132 | 6 | |
| Adhesion | ompA | F: ATTTACCAGGATGGGCCGTG R: GCGCCACAACCAAGCAATTA |
182 | 6 |
| Acinetobacter baumannii | 16srRNA | F: TTTAAGCGAGGAGGAGG R: ATTCTACCATCCTCTCCC |
240 | 3 |
|
pelABC operon |
pelA | F: CCTTCAGCCATCCGTTCTTCT R: TCGCGTACGAAGTCGACCTT |
118 | 5 |
| pelB | F: CGGCTACGTGCAGCGTTAT R: CACTGCATGCGTTCCTTGAC |
150 | 1 | |
| pelC | F: TGCTCCAGCTTCACCAG R: CAGTTGCAGGTCGCCTT |
192 | 8 | |
|
pslABD operon |
pslA | F: TGGGTCTTCAAGTTCCGCTC R: ATGCTGGTCTTGCGGATGAA |
119 | 5 |
| pslB | F: ACACCAACGAATCCACCTTCA R: CGCTCTGTACCTCGATCATCAC |
93 | 8 | |
| pslD | F: CTCATGAAACGCACCCTCCT R: TGCGACCGATGAACGGATAG |
295 | 5 | |
| alginate | algD | F: ACGAAGTGGTGGCGAGTTC R: TGGTGTGCGGCATGAAGC |
126 | 31 |
| Pseudomonas aeruginosa | 16srRNA | F: TGGAGCATGTGGTTTAATTCGA R: TGCGGGACTTAACCCAACA |
105 | 4 |
Statistical analysis
The WHONET software version 2018 (World Health Organization, Geneva, Switzerland) was used for entry and preliminary analysis of microbiology data. Also, the data were analyzed using SPSS software version 16 (SPSS, Com, Chicago, IL), and descriptive statistics such as means, standard deviations, frequencies, and percentages were generated; biofilm production was compared using the Mann–Whitney U test. Also, different criteria were used to analyze data in this research. These tests were Mann-Whitney U-Test (Two-tailed), Fisher exact test, and Chi-square (χ2) test. P< 0.05 values were considered statistically significant.
Phenotypic characteristics
One-hundred twenty isolates were collected, including 50(41.66%) of P. aeruginosa isolates and 70(58.33%) of A. baumannii strains. Of these 50 isolates, 19 were isolated from wounds (38%), ten from the blood (20%), nine from urine (18%), and 12 from catheters (24%). Also, out of 70 isolates of A. baumannii, 23 isolates from wounds (32.85%), 17 isolates from blood (24.28%), 19 isolates from urine (27.14%) and 11 isolates from catheters (15.71) were isolated (Table 2).
Table (2):
Phenotypic characteristics of biofilm formation and antibiotic resistance in clinical isolates of Pseudomonas aeruginosa and Acinetobacter baumannii.
| Phenotypic test |
Number (%) of clinical isolates of Pseudomonas aeruginosa | pa |
Number (%) of clinical isolates of Acinetobacter baumannii | p |
||||||||||
|---|---|---|---|---|---|---|---|---|---|---|---|---|---|---|
| Total | wounds | blood | urine | catheters | Total | wounds | blood | urine | catheters | |||||
| n=50 | n=19 | n=10 | n=9 | n=12 | n=70 | n=23 | n=17 | n=19 | n=11 | |||||
| Biofilm production b | ||||||||||||||
| Low | 3 (6) | 3 (1oo) | 0 (0) | 0 (0) | 0 (0) | 0.685 | 10 (14.2) | 6 (60) | 0 (0) | 4 (40) | 0 (0) | 0.072 | ||
| Moderate | 14 (28) | 5 (35.7) | 0 (0) | 1 (7.1) | 8 (57.1) | 0.012 | 19 (27.4) | 7 (36.9) | 1 (5.2) | 1 (5.2) | 10 (52.6) | <0.001 | ||
| Strong | 16 (32) | 9 (56.2) | 1 (6.2) | 2 (12.5) | 4 (25) | <0.001 | 20 (28.5) | 11 (55) | 1 (5) | 3 (15) | 5 (25) | <0.001 | ||
| Antibiotic Resistance | ||||||||||||||
| Gentamicin | 33 (66) | 7 (21.1) | 10 (30) | 9 (27.7) | 7 (21.1) | <0.001 | 54 (19.3) | 22 (40.7) | 16 (29.6) | 13 (24) | 3 (5.5) | <0.001 | ||
| Amikacin | 13 (26) | 2 (15.3) | 7 (53.8) | 3 (23) | 1 (7.6) | 0.085 | 10 (19.3) | 3 (30) | 5 (50) | 2 (20) | 0 (0) | <0.001 | ||
| Imipenem | 17 (34) | 9 (52.9) | 5 (29.4) | 1 (5.8) | 2 (15.3) | 0.039 | 19 (19.3) | 11 (57.8) | 7 (36.8) | 1 (5.2) | 0 (0) | 0.043 | ||
| Meropenem | 19 (38) | 4 (21) | 9 (47.3) | 5 (26.3) | 1 (5.2) | <0.001 | 25 (19.3) | 9 (36) | 5 (20) | 4 (16) | 1 (4) | 0.051 | ||
| Ceftazidime | 6 (12) | 1 (16.6) | 5 (83.3) | 0 (0) | 0 (0) | 0.016 | 15 (19.3) | 4 (26.6) | 7 (46.6) | 4 (26.6) | 0 (0) | 0.033 | ||
| Cefepime | 19 (38) | 4 (21) | 7 (36.8) | 5 (26.3) | 3 (15.7) | <0.001 | 28 (19.3) | 9 (32.1) | 11 (39.2) | 7 (19.3) | 2 (19.3) | <0.001 | ||
| Ticarcillin | 19 (38) | 9 (47.3) | 4 (21) | 5 (26.3) | 2 (10.5) | 0.119 | 11 (19.3) | 2 (19.3) | 1 (19.3) | 7 (25) | 1 (4) | 0.053 | ||
| Piperacillin | 12 (24) | 3 (25) | 5 (41.6) | 2 (16.6) | 2 (16.6) | 0.093 | 30 (19.3) | 11 (36.6) | 6 (20) | 10 (33.3) | 3 (1) | 0.013 | ||
| Ciprofloxacin | 36 (72) | 11 (30.5) | 6 (20) | 9 (30) | 10 (33.3) | 0.004 | 61 (19.3) | 23 (37.7) | 11 (18) | 18 (29.5) | 9 (14.7) | <0.001 | ||
| Trimethoprim/sulfamethoxazole | 20 (40) | 7 (35) | 9 (40) | 4 (20) | 0 (0) | 0.072 | 39 (19.3) | 11 (28.2) | 17 (43.5) | 9 (23) | 1 (2.5) | <0.001 | ||
| Tetracycline | 29 (58) | 13 (44.8) | 8 (27.5) | 8 (27.5) | 1 (3.4) | 0.112 | 49 (19.3) | 15 (30.6) | 10 (20.4) | 17 (34.6) | 7 (14.2) | 0.109 | ||
| Norfloxacin | 31 (62) | 11 (35.4) | 7 (22.5) | 8 (25.8) | 5 (16.1) | <0.001 | 47 (19.3) | 12 (25.5) | 11 (23.4) | 18 (36.7) | 6 (12.7) | <0.001 | ||
| Ampicillin | 17 (34) | 9 (52.9) | 2 (11.7) | 3 (17.6) | 2(11.7) | <0.001 | 18 (19.3) | 6 (33.3) | 6 (33.3) | 5 (27.7) | 1 (5.5) | <0.001 | ||
| Cefotaxime | 25 (50) | 10 (40) | 6 (24) | 7 (28) | 2 (8) | 0.097 | 23 (19.3) | 9 (39.1) | 3 (13) | 11 (47.8) | 0 (0) | 0.025 | ||
| MDR | 11 (22) | 6 (54.5) | 2 (18.1) | 2 (18.1) | 1 (9) | <0.001 | 22 (31.4) | 11 (50) | 5 (27.7) | 4 (18.8) | 2 (9) | <0.001 | ||
| XDR | 7 (14) | 4 (57.1) | 2 (28.5) | 1 (14.2) | 0 (0) | 0.024 | 11 (15.7) | 7 (63.6) | 1 (9) | 3 (27.7) | 0 (0) | 0.041 | ||
| β-lactamase producer isolates | ||||||||||||||
| AmpC enzymes | 29 (58) | 16 (55.1) | 4 (13.79) | 7 (24.1) | 2 (6.8) | <0.001 | 42 (60) | 19 (45.2) | 10 (23.8) | 8 (19) | 5 (11.9) | <0.001 | ||
| ESBL enzymes | 32 (64) | 10 (31.2) | 6 (18.7) | 9 (28.1) | 7 (21.8) | <0.001 | 40 (57.1) | 17 (42.5) | 7 (17.5) | 11 (27.5) | 5 (12.5) | <0.001 | ||
| KPC enzymes | 19 (38) | 4 (21) | 6 (31.5) | 7 (36.8) | 2 (10.5) | <0.001 | 23 (32.8) | 20 (86.9) | 1 (4.3) | 2 (8.6) | 0 (0) | 0.011 | ||
| MBL enzymes | 22 (44) | 13 (59) | 5 (22.7) | 2 (9) | 2 (9) | <0.001 | 24 (34.2) | 19 (79.1) | 1 (4.6) | 3 (12.5) | 0 (0) | 0.049 | ||
a: χ2 test.
b: Mann–Whitney U test.
Antibiotic resistance pattern
The prevalence of antimicrobial susceptibility testing of P. aeruginosa and A. baumannii is shown in Fig. 1. Ciprofloxacin and gentamicin was found to be the least active antimicrobial agent as 72% (n=36) and 66% (n=33) of the P. aeruginosa isolates were resistant to it, respectively. Also, 11 MDR strains (22%) and 7 XDR strains (14%) were reported. Moreover, In A. baumannii isolates, resistance to gentamicin (77.14%, n=54) and ciprofloxacin (87.14%, n=61) was the most frequent; and 22 MDR isolates (31.42%) and 11 XDR isolates (15.71%) were detected.
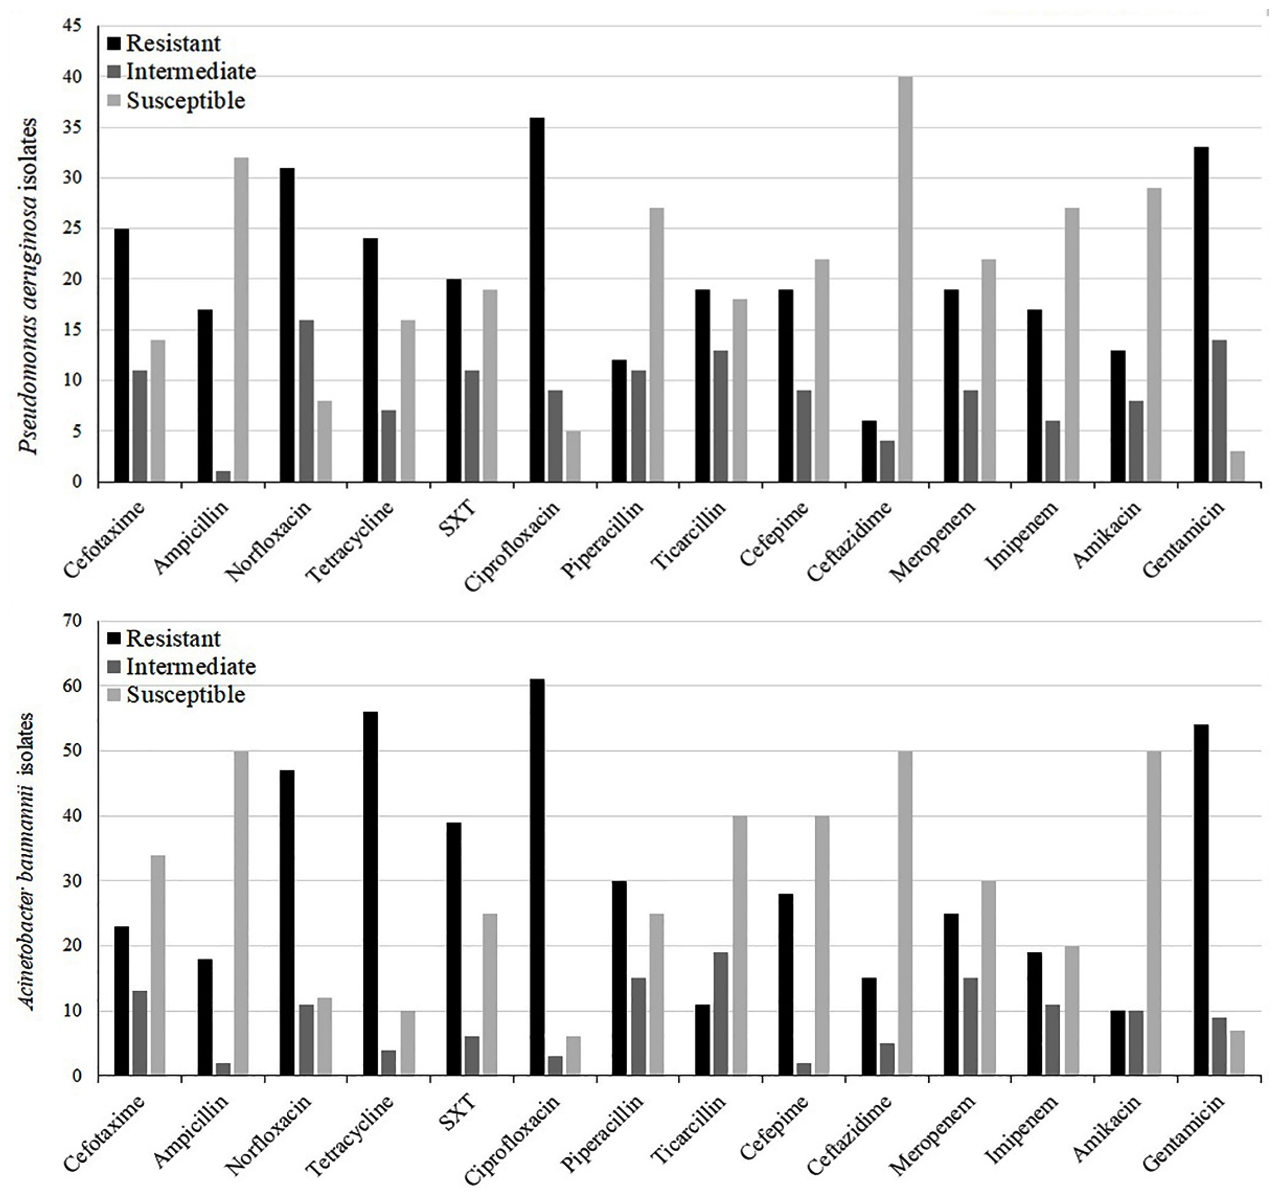
Fig. 1. Antibiotic resistance pattern in clinical isolates of P. aeruginosa and A. baumannii
Frequency of ESBL and AmpC β-lactamases strains
Results of ESBL and AmpC producing strains are shown in Fig. 2A and Table 2. Among 50 isolates of P. aeruginosa, 29 isolates (58%) were AmpC producers, and 32 isolates (64%) were ESBL producers. In 70 isolates of A. baumannii, 40 isolates (57.14%) were ESBL-producer, and 42 isolates (60%) were AmpC producer.
Frequency of MBL and KPC β-lactamases strains
Results of MBL and KPC-producing strains are shown in Fig. 2B, Fig. 2C, and Table 2. Out of 50 isolates of P. aeruginosa, 19 isolates (38%) were KPC producers, and 22 isolates (44%) were MBL producers. In 70 isolates of A. baumannii, 24 isolates (34.28%) were MBL producers, and 23 isolates (32.85%) were KPC producers.
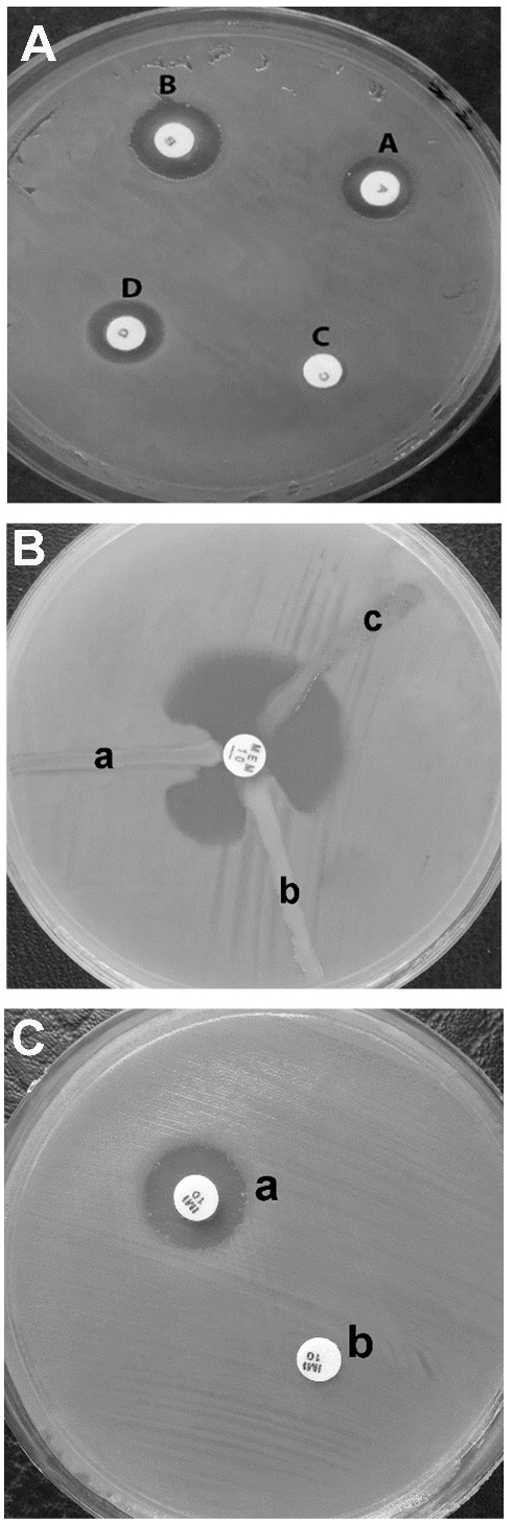
Fig. 2. The result of phenotypic detection of AmpC, ESBL (A) KPC (B) and MBL (C) strains of clinical isolates of P. aeruginosa and A. baumannii. A: For ESBL positive: B – A and D – C ≥5mm, D – B and C – A < 5mm. For AmpC positive: B – A and D – C <5mm, D – B and C – ZA ≥ 5mm. For AmpC and ESBL positive: D – C ≥ 5mm, ZB – ZA < 5mm. For AmpC and ESBL negative: Difference of the zones ≤ 2mm. B: The Modified Hodge test performed on a Muller Hinton Agar plate. a: MHT positive result; b: a clinical isolate; and c: negative result. A 10μg meropenem (MEM 10μg) or ertapenem susceptibility disk is placed in the center of the test area. C: Combined EDTA disk diffusion test: In the combined disc test, if the increase in inhibition zone with the Imipenem+EDTA disc (a) was ≥ 7 mm than the Imipenem disc (b) alone, it was considered as MBL positive.
Biofilm production
Overall, 33 strains (66%) of P. aeruginosa were detected as biofilm producers, and 17 (34%) isolates were a non-biofilm producer. Also, 49 strains (70%) of A. baumannii were identified as biofilm producers, and 21 (30%) strains were a non-biofilm producer. The details of the biofilm-forming strains are shown in Tables 2 and 3.
Table (3):
Molecular and phenotypic characteristics of biofilm formation regulatory genes and antibiotic resistance in clinical isolates of Pseudomonas aeruginosa and Acinetobacter baumannii.
| Phenotypic test |
Number (%) of biofilm formation regulatory genes in Pseudomonas aeruginosa isolates | Number (%) of biofilm formation regulatory genes in Acinetobacter baumannii isolates | ||||||||||||||
|---|---|---|---|---|---|---|---|---|---|---|---|---|---|---|---|---|
| Total | pslA | pslB | pslD | pelA | pelB | pelC | algD | Total | pgaA | pgaB | pgaC | csuA | csuB | csuC | ompA | |
| n=50 | n=29 | n=29 | n=30 | n=33 | n=19 | n=22 | n=34 | n=70 | n=32 | n=23 | n=30 | n=24 | n=20 | n=29 | n=27 | |
| Biofilm production | ||||||||||||||||
| Low | 3 (6) | 0 (0) | 3 (100) | 1 (30.3) | 3 (100) | 3 (100) | 0 (0) | 2 (66.6) | 10 (14.2) | 3 (30) | 7 70) | 3 (30) | 1 (10) | 0 (0) | 1 (10) | 4 (40) |
| Moderate | 14 (28) | 14 (100) | 10 (71.4) | 13 (63.3) | 14 (92.8) | 6 (42.8) | 9 (64.2) | 14 (100) | 19 (27.4) | 12 (63.5) | 11 (57.8) | 11 (57.8) | 9 (47.3) | 3 (15.7) | 11 (57.8) | 7 (36.8) |
| Strong | 16 (32) | 15 (93.7) | 16 (100) | 16 (100) | 16 (100) | 10 (62.5) | 13 (81.2) | 16 (100) | 20 (28.5) | 17 (85) | 5 (25) | 16 (80) | 14 (70) | 17 (85) | 17 (85) | 16 (80) |
| Antibiotic Resistance | ||||||||||||||||
| Gentamicin | 33 (66) | 19 (57.7) | 22 (66.6) | 26 (78.8) | 20 (60.6) | 14 (42.4) | 19 (57.7) | 29 (87.7) | 54 (19.3) | 32 (32.2) | 19 (42.2) | 26 (48.1) | 13 (24.1) | 13 (24.1) | 27 (50) | 24 (44.4) |
| Amikacin | 13 (26) | 5 (38.4) | 7 (53.8) | 11 (84.6) | 9 (69.2) | 7 (53.8) | 11 (84.6) | 11 (84.6) | 10 (19.3) | 6 (60) | 4 (40) | 9 (90) | 7 (70) | 7 (70) | 10 (100) | 10 (100) |
| Imipenem | 17 (34) | 9 (52.9) | 11 (64.7) | 11 (64.7) | 14 (84.3) | 7 (41.1) | 13 (76.4) | 16 (94.1) | 19 (19.3) | 11 (57.8) | 11 (57.8) | 17 (19.3) | 10 (89.4) | 13 (76.4) | 14 (73.6) | 18 (94.7) |
| Meropenem | 19 (38) | 12 (63.1) | 12 (63.1) | 9 (47.3) | 15 (78.9) | 17 (89.4) | 17 (89.4) | 14 (73.6) | 25 (19.3) | 19 (76) | 21 (84) | 15 (60) | 19 (76) | 11 (44) | 16 (64) | 22 (88) |
| Ceftazidime | 6 (12) | 1 (16.6) | 5 (83.3) | 4 (66.6) | 1 (16.6) | 4 (66.6) | 5 (83.3) | 5 (83.3) | 15 (19.3) | 9 (60) | 11 (73.3) | 7 (46.6) | 11 (73.3) | 9 (60) | 14 (93.3) | 14 (93.3) |
| Cefepime | 19 (38) | 17 (89.4) | 11 (57.8) | 11 (57.8) | 14 (83.4) | 16 (84.2) | 10 (52.6) | 18 (94.7) | 28 (19.3) | 19 (67.8) | 24 (85.7) | 17 (69.7) | 20 (71.4) | 12 (42.8) | 10 (35.7) | 25 (89.2) |
| Ticarcillin | 19 (38) | 13 (68.4) | 17 (89.4) | 14 (83.4) | 11 (57.8) | 16 (84.2) | 12 (63.1) | 7 (36.8) | 11 (19.3) | 6 (54.5) | 2 (18.1) | 7 (63.6) | 7 (63.6) | 9 (81.8) | 6 (54.5) | 10 (90) |
| Piperacillin | 12 (24) | 9 (75) | 11 (91.6) | 9 (75) | 7 (58.3) | 3 (25) | 9 (75) | 11 (91.6) | 30 (19.3) | 23 (76.6) | 21 (70) | 26 (86.6) | 20 (66.6) | 13 (43.3) | 24 (80) | 26 (86.6) |
| Ciprofloxacin | 36 (72) | 27 (75) | 29 (80.5) | 29 (8.05) | 31 (86.1) | 11 (30.5) | 20 (55.5) | 33 (91.6) | 61 (19.3) | 23 (37.7) | 20 (32.7) | 29 (47.5) | 23 (37.7) | 19 (31.1) | 24 (39.3) | 26 (47.5) |
| Trimethoprim/ sulfamethoxazole | 20 (40) | 11 (55) | 19 (95) | 14 (70) | 19 (75) | 15 (75) | 11 (55) | 18 (90) | 39 (19.3) | 17 (43.5) | 19 (48.7) | 26 (66.6) | 16 (41) | 11 (28.2) | 27 (69.2) | 24 (61.5) |
| Tetracycline | 29 (58) | 23 (79.3) | 28 (96.5) | 25 (86.2) | 12 (41.3) | 14 (48.2) | 19 (65.5) | 29 (100) | 49 (19.3) | 12 (24.4) | 19(38.7) | 10 (20.4) | 17 (34.6) | 17 (34.6) | 19 (38.7) | 13 (26.5) |
| Norfloxacin | 31 (62) | 22 (70.9) | 27 (87) | 28 (90.3) | 29 (93.5) | 19 (61.2) | 31 (100) | 29 (93.5) | 47 (19.3) | 10 (21.2) | 6 (14.2) | 11 (23.4) | 18 (38.2) | 16 (34) | 14 (34) | 11 (23.4) |
| Ampicillin | 17 (34) | 13 (76.4) | 12 (70.5) | 11 (19.3) | 9(52.9) | 9 (52.9) | 15 (88.2) | 15 (88.2) | 18 (19.3) | 6 (19.3) | 6 (19.3) | 11 (19.3) | 9 (19.3) | 7 (19.3) | 14 (19.3) | 16 (19.3) |
| Cefotaxime | 25 (50) | 19 (76) | 21 (84) | 20 (80) | 19 (76) | 17 (68) | 19 (76) | 23 (92) | 23 (19.3) | 16 (69.5) | 20 (86.9) | 20 (86.9) | 19 (82.6) | 13 (56.5) | 15 (65.2) | 17 (73.9) |
| MDR | 11 (22) | 4 (36.3) | 9 (81.1) | 3 (27.7) | 9 (81.1) | 9 (81.1) | 3 (27.7) | 11 (100) | 22 (31.4) | 19 (47.8) | 17 (47.8) | 20 (29.4) | 17 (21) | 19 (18.1) | 21 (19.3) | 22 (19.3) |
| XDR | 7 (14) | 6 (85.7) | 6 (85.7) | 3 (42.8) | 6 (85.7) | 5 (71.4) | 4 (57.1) | 6 (85.1) | 11 (15.7) | 9 (81.1) | 11 (100) | 10 (90) | 6 (54.5) | 6(54.5) | 11 (100) | 11 (100) |
| β-lactamase producer isolates | ||||||||||||||||
| AmpC enzymes | 29 (58) | 27 (93.1) | 4 (13.7) | 7 (24.1) | 2 (6.8) | 14 (48.2) | 14 (48.2) | 24 (82.7) | 42 (60) | 29 (69) | 20 (47.6) | 29 (69) | 24 (57.1) | 12 (28.5) | 27 (64.2) | 25 (59.5) |
| ESBL enzymes | 32 (64) | 29 (90.6) | 16 (50) | 19 (59.3) | 7 (21.8) | 17 (54.8) | 21 (65.6) | 29 (90.6) | 40 (57.1) | 27 (67.5) | 17 (42.5) | 27 (67.5) | 21 (52.5) | 15 (37.5) | 24 (60) | 23 (57.5) |
| KPC enzymes | 19 (38) | 15 (78.9) | 16 (84.2) | 17 (89.4) | 10 (52.6) | 13 (68.4) | 19 (100) | 18 (94.7) | 23 (32.8) | 20 (86.9) | 20 (86.9) | 21 (91.3) | 12 (52.1) | 19 (82.6) | 23 (100) | 17 (73.9) |
| MBL enzymes | 22 (44) | 20 (90) | 15 (68.1) | 12 (54.5) | 12 (54.5) | 19 (86.3) | 20 (90) | 22 (100) | 24 (34.2) | 18 (75) | 21 (87.5) | 21 (87.5) | 23 (95.8) | 21 (87.5) | 24 (100) | 24 (100) |
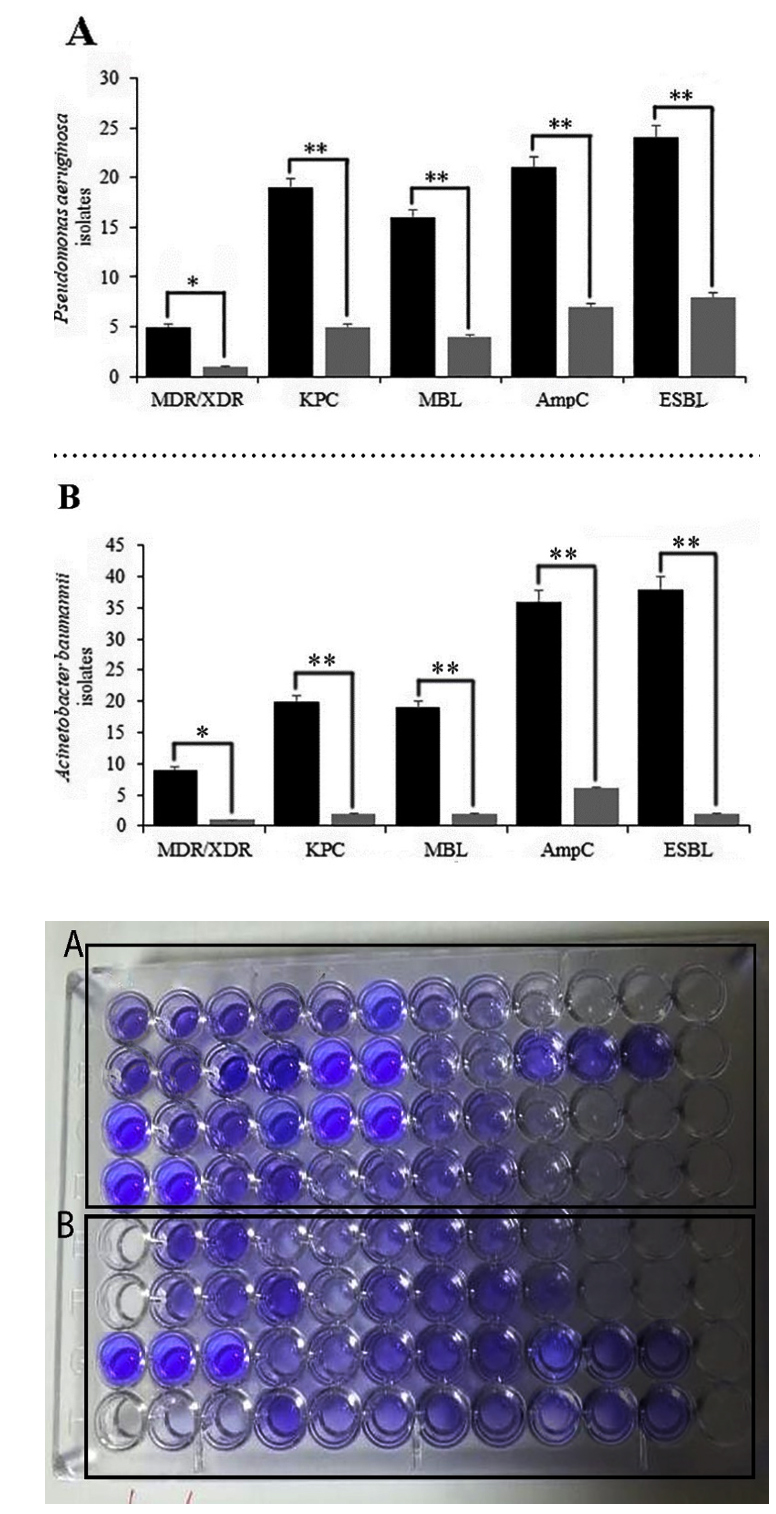
Fig. 3. Biofilm biomass stained with crystal violet and association of biofilm formation and β-lactamase enzymes in P. aeruginosa (A) and A. baumannii (B). Biofilm biomass is measured in absorbance at 570nm; Black well: Biofilm forming strains; Clear well: Strains without biofilm. Error bars indicate standard errors of the means from a representative triplicate time. Mann–Whitney U test and χ2 test was performed for testing differences between groups. *: p < 0.05, **: p < 0.001, ***
Frequency of Biofilm Operon genes
The result of the amplification and frequency of biofilm regulatory genes in P. aeruginosa and A. baumannii is shown in Fig. 4 and Table 3. Out of the 50 P. aeruginosa isolates, 29 isolates (58%) were pslA gene, 29 strains (58%) were pslB gene, 30 isolates (60%) were pslD gene, 33 isolates (64%) were pelA gene, 19 isolates (38%) were pelB gene, 22 isolates (44%) were pelC gene, and 34 isolates (68%) were algD gene. Also, out of 70 A. baumannii, 24 isolates (34.28%) were csuA gene, 23 isolates (32.85%) were the csuB gene, 29 isolates (41.42%) were csuC gene, 32 isolates (45.71%) were pgaA gene, 23 isolates (32.85%) were pgaB gene, 30 isolates (42.85%) were pgaC gene, and 27 isolates (38.57%) were ompA gene.
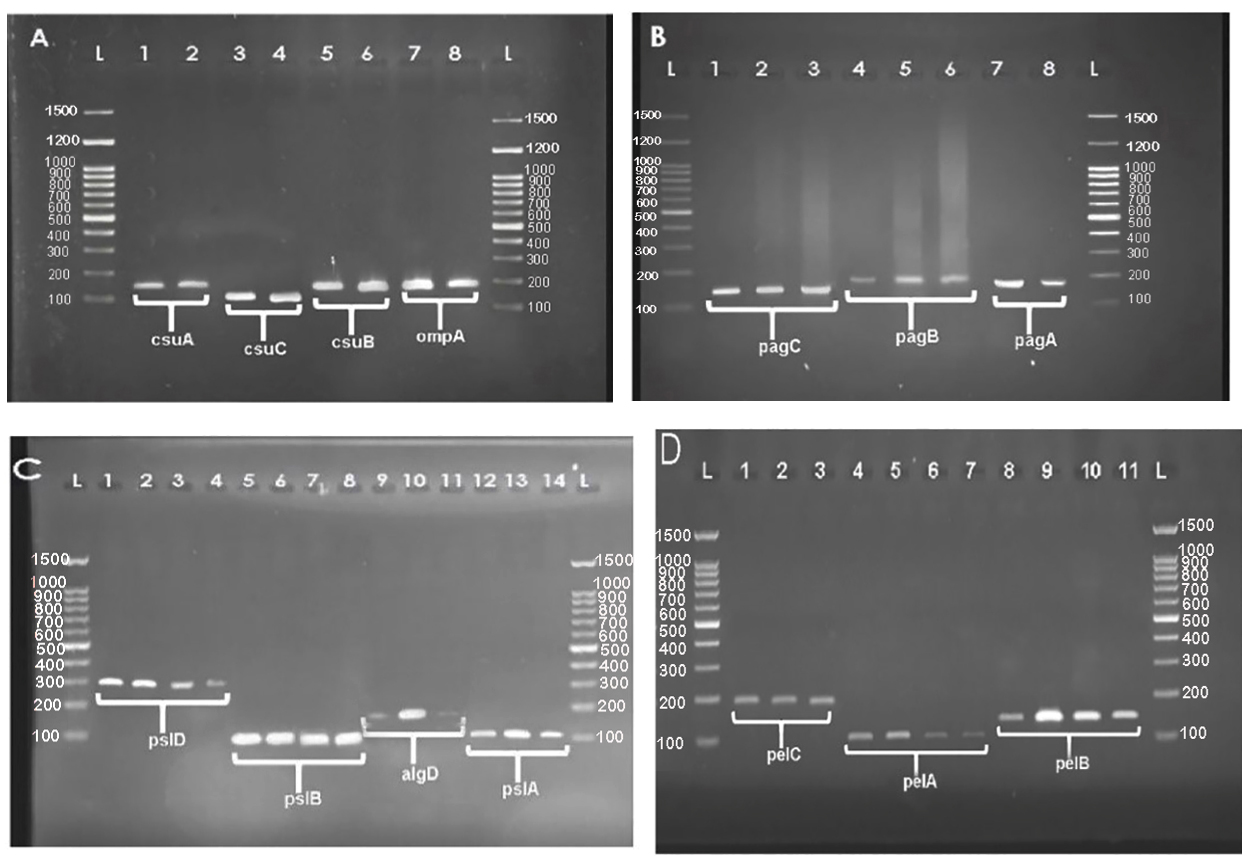
Fig. 4. The amplification and gel electrophoresis agarose 1.5% of biofilm operons of A. baumannii (A and B) and P. aeruginosa (C and D). A: csuA with 156bp (well 1 and 2), csuB with 187bp (well 5, 6), csuC with 109bp (well 3 and 4) and ompA with 182 (well 7 and 8) genes in clinical isolates of A. baumannii, B: pgaA with 186bp (well 7 and 8), pgaB with 190bp (well 4 to 6), and pgaC with 132bp (well 1 to 3) genes in A. baumannii. C: pslD with 295bp (well 1 to 4), pslB with 93bp (well 5 to 8), algD with 126bp and (well 9 to 11), and pslA with 119bp (well 12 to 14) genes in of P. aeruginosa isolates. D: pelC with 192bp (well 1 and 3), pelA with 113bp (well 4 to 7), and pelB with 150bp (well 8 to 11) genes.L: Ladder 100bp.
Statistical analysis
Based on Fig. 3A and 3B, there was a significant relationship between the biofilm formation and β-lactamase enzymes in P. aeruginosa and A. baumannii (p≤0.001). Besides, there was a significant association between biofilms regulatory genes and β-lactamase enzymes (p≤0.05). No statistical association was detected when the virulence factors were compared to some antibiotic. Moreover, we found no significant difference in antibiotic susceptibility between the fluoroquinolones, aminoglycosides (except for amikacin), and biofilm regulatory genes, a very similar distribution of disinfectant resistance genes than others (p≤0.05).
Besides, a high abundance of biofilm regulator genes was observed in strains resistant to carbapenems, monobactams, and amikacin (Table 2 and Table 4). However, in some isolates, harboring carbapenemase enzymes and biofilm operon genes was negatively associated with biofilm formation (p<0.05). In some MBL and AmpC producer isolates, harboring β-lactamase enzymes was negatively associated with biofilm production (p<0.05).
Table (4):
Relationship between biofilm formation regulatory genes and antimicrobial resistance.
|
Antibiotics
|
virulence factors of Acinetobacter baumannii a |
Biofilm b |
virulence factors of Pseudomonas aeruginosa a |
Biofilm b |
||||||||||||
|---|---|---|---|---|---|---|---|---|---|---|---|---|---|---|---|---|
| pgaA | pgaB | pgaC | csuA | csuB | csuC | ompA | pslA | pslB | pslD | pelA | pelB | pelC | algC | |||
| Ampicillin | 0.047 | 0.o52 | 0.025 | 0.029 | 0.097 | 0.097 | 0.001 | 0.009 | 0.059 | 0.014 | 0.029 | 0.068 | 0.050 | 0.067 | 0.024 | 0.019 |
| Gentamicin | 0.041 | 0.065 | 0.003 | 0.001 | 0.004 | 0.033 | 0.006 | 0.595 | 0.017 | 0.048 | 0.033 | 0.091 | 0.170 | 0.023 | 0.079 | 0.074 |
| Amikacin | 0.003 | 0.080 | 0.033 | 0.033 | 0.029 | 0.074 | 0.039 | 0.174 | 0.039 | 0.004 | 0.019 | 0.036 | 0.041 | 0.052 | 0.035 | 0.035 |
| Imipenem | 0.069 | 0.071 | 0.040 | 0.032 | 0.021 | 0.097 | 0.045 | 0.597 | 0.004 | 0.017 | 0.051 | 0.039 | 0.047 | 0.023 | 0.088 | 0.050 |
| Meropenem | 0.046 | 0.007 | 0.020 | 0.065 | 0.001 | 0.064 | 0.011 | 0.009 | 0.031 | 0.011 | 0.055 | 0.071 | 0.018 | 0.033 | 0.049 | 0.040 |
| Ceftazidime | 0.017 | 0.005 | 0.083 | 0.095 | 0.047 | 0.001 | 0.019 | 0.004 | 0.064 | 0.059 | 0.044 | 0.083 | 0.074 | 0.049 | 0.038 | 0.054 |
| Cefepime | 0.046 | 0.097 | 0.020 | 0.065 | 0.051 | 0.064 | 0.022 | 0.009 | 0.073 | 0.049 | 0.036 | 0.093 | 0.069 | 0.057 | 0.034 | 0.063 |
| Ticarcillin | 0.218 | 0.824 | 0.343 | 0.083 | 0.647 | 0.420 | 0.061 | 0.682 | 0.093 | 0.061 | 0.081 | 0.047 | 0.084 | 0.058 | 0.077 | 0.074 |
| Piperacillin | 0.072 | 0.599 | 0.042 | 0.062 | 0.024 | 0.272 | 0.074 | 0.260 | 0.037 | 0.029 | 0.063 | 0.058 | 0.099 | 0.011 | 0.084 | 0.070 |
| Ciprofloxacin | 0.622 | 0.416 | 0.106 | 0.574 | 0.705 | 0.261 | 0.560 | 0.902 | 0.366 | 0.564 | 0.156 | 0.857 | 0.706 | 0.101 | 0.101 | 0.101 |
|
Trimethoprim/ sulfamethoxazole |
0.016 | 0.214 | 0.091 | 0.041 | 0.033 | 0.086 | 0.101 | 0.083 | 0.218 | 0.824 | 0.343 | 0.383 | 0.647 | 0.420 | 0.682 | 0.081 |
| Tetracycline | 0.758 | 0.429 | 0.004 | 0.055 | 0.572 | 0.190 | 0.091 | 0.088 | 0.068 | 0.488 | 0.073 | 0.066 | 0.782 | 0.309 | 0.060 | 0.087 |
| Norfloxacin | 0.627 | 0.801 | 0.080 | 0.603 | 0.079 | 0.900 | 0.075 | 0.858 | 0.080 | 0.062 | 0.021 | 0.097 | 0.065 | 0.597 | 0.040 | 0.072 |
| Ampicillin | 0.627 | 0.801 | 0.180 | 0.603 | 0.879 | 0.900 | 0.101 | 0.058 | 0.034 | 0.017 | 0.011 | 0.019 | 0.047 | 0.013 | 0.088 | 0.014 |
| Cefotaxime | 0.688 | 0.488 | 0.073 | 0.667 | 0.782 | 0.309 | 0.101 | 0.008 | 0.041 | 0.013 | 0.049 | 0.061 | 0.023 | 0.064 | 0.047 | 0.049 |
| MDR | 0.066 | 0.064 | 0.056 | 0.057 | 0.006 | 0.040 | 0.003 | 0.039 | 0.053 | 0.050 | 0.045 | 0.033 | 0.013 | 0.041 | 0.039 | 0.024 |
| XDR | 0.021 | 0.045 | 0.007 | 0.078 | 0.020 | 0.045 | 0.025 | 0.055 | 0.047 | 0.040 | 0.033 | 0.026 | 0.015 | 0.024 | 0.047 | 0.042 |
| β-lactamase producer isolates | ||||||||||||||||
| AmpC enzymes | 0.022 | 0.016 | 0.323 | 0.074 | 0.005 | 0.061 | 0.030 | 0.042 | 0.069 | 0.074 | 0.056 | 0.027 | 0.006 | 0.091 | 0.028 | 0.022 |
|
ESBL enzymes |
0.047 | 0.019 | 0.051 | 0.011 | 0.027 | 0.056 | 0.041 | 0.066 | 0.051 | 0.024 | 0.038 | 0.091 | 0.071 | 0.038 | 0.082 | 0.016 |
|
KPC enzymes |
0.077 | 0.059 | 0.024 | 0.049 | 0.085 | 0.028 | 0.056 | 0.097 | 0.041 | 0.035 | 0.013 | 0.021 | 0.034 | 0.053 | 0.050 | 0.015 |
| MBL enzymes | 0.013 | 0.028 | 0.041 | 0.017 | 0.044 | 0.050 | 0.069 | 0.079 | 0.023 | 0.038 | 0.051 | 0.033 | 0.019 | 0.034 | 0.059 | 0.044 |
a: χ2 test.
b: Mann–Whitney U test.
Alterations of chromosomal genes are still by far the most critical mechanisms of β-lactam resistance in NFGNBs, although transferable carbapenem resistance is becoming increasingly important1.
As shown in Fig. 1, this paper reported that high resistance rate to ciprofloxacin (72% and 87.4%), gentamycin (66% and 77.1%), and trimethoprim/sulfadiazine (40% and 55.7%) in Iranian isolates of P. aeruginosa and A. baumannii, respectively. Some researcher demonstrated that ciprofloxacin and trimethoprim/sulfadiazine are the two most frequently co-transferred resistance phenotypes among P. aeruginosa and A. baumannii isolates14. The significantly high level of resistance to these antimicrobials was probably an indication of their extensive usage in the clinic for therapeutic and prophylactic purposes both for NFGNBs other infections.
Moreover, based on Table 1, MDR and XDR strains were detected in 22%, and 14% of P. aeruginosa and 31.4% and 15.7% of A. baumannii isolates, respectively. A similar pattern of results were obtained in many studies, who reported a high frequency of MDR and XDR strains in NFGNBs15,16. In contrast to our findings, some studies in Egypt17 indicate the different prevalence of MDR and XDR strains in NFGNBs. In Table 2, we reported that the frequency of AmpC-producing, ESBL-producing, KPC-producing, and MBL-producing P. aeruginosa isolates were 56%, 64%, 48%, and 38%, respectively; which was in line with Tohamy et al.17.
Furthermore, AmpC-producing, ESBL-producing, KPC-producing, and MBL-producing A. baumannii isolates were 57.1%, 60%, 34.2%, and 32.8%, respectively. This result ties well with Goel et al.18 study and shows that the distribution of β-lactamase enzymes in A. baumannii is higher than P. aeruginosa. However, the rates of ESBL and AmpC producer strains were higher when compared to the rates reported from India19 and Lebanon20. Our study found that more than 50% of the strains from the west of Iran were β-lactam-resistant is undoubtedly a cause for concern as β-lactam has been the drug of choice for A. baumannii and P. aeruginosa infections for over a decade.
Biofilm formation and regulatory genes have been investigated as controversial and critical issues in healthcare settings. However, in some studies, no apparent relationship between β-lactamase enzymes and biofilm formation has been detected21,22. Further, as shown in Fig. 3, the current study confirmed the strong association between biofilm formation and β-lactamase enzymes (p< 0.001), which was reported similar results in several studies23,24. Also, based on Table 2 and Table 4, our finding showed that resistance to meropenem, ceftazidime, and amikacin, was associated with a higher prevalence of the biofilm formation and regulatory genes. Nonetheless, many studies showed that antibiotic resistance was associated with the production of the biofilm phenotype, such as cellular appendages and adhesions9.
In this study, a high prevalence of pgaA, pgaC, and csuC genes (45.7%, 42.8%, and 41.4%, respectively; p< 0.05) in resistant A. baumannii was observed. These results go beyond Liu et al.25 reports how demonstrated the frequency of pathogenic genes (ompA) and biofilm regulators in the β-lactamase producer strains of A. baumannii was higher. Additionally, in Table 3 and Table 4, we confirmed that algD, pelA, and pslD (68%, 66%, and 60%, respectively; p< 0.05), which was also more prevalent in resistant strains. Another studies shown a significant relationship between virulence factors and antibiotic resistance in P. aeruginosa13,26. This evidence highlights that the possibility of acquisition of both resistance and virulence traits via horizontal gene transfer could be responsible for the appearance of strains simultaneously virulent and resistant13.
In the current study, based on Table 3 and Table 4, statistically significant differences were observed for resistance to the various class of antibiotics and biofilm regulating genes in A. baumannii and P. aeruginosa. Table 4 also showed that a strong relationship between pgaABC and csuABC operons with β-lactamase enzymes (~50% in resistant vs. ~19% in susceptible, p< 0.001). By comparing the results of various studies we determine a significant relationship between β-lactamase enzymes and biofilm operons in A. baumannii24,27. However, some researcher showed that there is no significant relationship between biofilm formation and β-lactamase enzymes in P. aeruginosa22. This is in contrast to our results, which confirm that the biofilm regulatory gene in P. aeruginosa is most abundant in the β-lactamase producing strains (~35% in resistant vs. ~11% in susceptible, p< 0.001). This contrast in results may be due to differences in the number and type of clinical specimen. In other words, the statistical analysis with these explanations may not be the same in various studies. Therefore, Wang et al.28 found that there was no significant relationship between antibiotic resistance and biofilm formation in A. baumannii bacteraemic pneumonia.
So far, the knowledge of the relationship between resistance and virulence traits in NFGNBs compared to other bacteria is limited. Environmental factors are one of the most critical factors that can clarify the relationship between biofilm formation (the activity of biofilm operons) and β-lactamase enzymes. Antimicrobial resistance could also be stress-dependent; for example, some studies found that antibiotic resistance increased when subjected to pH (5.0 and 4.0) and salt stresses, although antimicrobial susceptibility returned to previously tested levels after removing the stressors, bacterial sustained antimicrobial resistance29,30. This suggests that the pressures of stressors could permanently alter antimicrobial resistance in bacteria; Likewise, these variables can affect biofilm formation. By studying different variables on the activity of biofilm operons and increasing antibiotic resistance, we can determine the effect of environmental factors on the pathogenicity and antibiotic resistance of NFGNBs.
The limitations of the present studies include the academic budget deficit to evaluate the expression level of biofilm regulatory genes in β-lactamase producing strains. Because the expression of biofilm regulatory genes in MDR/XDR strains may be different with β-lactamase producing strains.
Our results demonstrated that biofilm operons play an essential role in the antibiotic resistance of P. aeruginosa and A. baumannii. In other words, our data show an association between biofilm operons and the abundance of β-lactamase producing strains. Some associations were detected that could help in predicting the degree of virulence of a certain isolate. Nevertheless,this association could be useful for clinicians in terms of adjusting treatment regimens based on the expected degree of virulence and the severity of the illness of the patient. Moreover, this association could be exploited by infection control specialists through the adaptation of eradication protocols to specific isolates. Although the interplay between resistance and biofilm operons seems to be a highly complex one, this observation could suggest that its lack of resistance could be attributing to its increased virulence. Performing a similar study on more sporadic isolates, and isolates from different origins could reveal further clinically important associations and help better understand the interaction between antimicrobial resistance and biofilm operons. Therefore, the identification of biofilm operons in different strains of P. aeruginosa and A. baumannii helps to control antibiotic resistance.
ACKNOWLEDGMENTS
The authors gratefully thank Islamic Azad University, Hamedan, Iran, for providing facilities to conduct the research. The current research was financially supported by the Islamic Azad University, Hamedan Branch, Hamedan (grant number 17130507962001).
CONFLICT OF INTEREST
The authors declare that there is no conflict of interest.
AUTHORS’ CONTRIBUTION
MHP and MP carried out the molecular genetic studies, participated in the primers sequence alignment, and drafted the manuscript. MHP carried out the sampling and culture method, participated in the design of the study, and performed the statistical analysis and writing the manuscript. All authors read and approved the final manuscript.
FUNDING
The current research was financially supported by the Islamic Azad University, Hamedan Branch, Hamedan (grant number 17130507962001).
ETHICS STATEMENT
This article does not contain any studies with human participants or animals performed by any of the authors.
AVAILABILITY OF DATA
All datasets generated or analyzed during this study are included in the manuscript.
- Argenta AR, Fuentefria DB, Sobottka AM. Prevalence and antimicrobial susceptibility of non-fermenting Gram-negative bacilli isolated from clinical samples at a tertiary care hospital. Rev Soc Bras Med Trop. 2017;50(2):243-247.
Crossref - Helmy OM, Kashef MT. Different phenotypic and molecular mechanisms associated with multidrug resistance in Gram-negative clinical isolates from Egypt. Infect Drug Resist. 2017;10:479-498.
Crossref - Anane AY, Apalata T, Vasaikar S, Okuthe GE, Songca S. Prevalence and molecular analysis of multidrug-resistant Acinetobacter baumannii in the extra-hospital environment in Mthatha, South Africa. Braz J Infect Dis. 2019;23(6):371-380.
Crossref - Tahmasebi H, Dehbashi S, Arabestani MR. High resolution melting curve analysis method for detecting of carbapenemases producing pseudomonas aeruginosa. JKIMSU. 2018;7(4):70-77.
- Maita P, Boonbumrung K. Association between biofilm formation of Pseudomonas aeruginosa clinical isolates versus antibiotic resistance and genes involved with biofilm. J Chem Pharm Res. 2014;6:1022-1028.
- Lannan FM, O’conor DK, Broderick JC, et al. Evaluation of Virulence Gene Expression Patterns in Acinetobacter baumannii Using Quantitative Real-Time Polymerase Chain Reaction Array. Mil Med. 2016;181(9):1108-1113.
Crossref - Solomon FB, Wadilo F, Tufa EG, Mitiku M. Extended spectrum and metalo beta-lactamase producing airborne Pseudomonas aeruginosa and Acinetobacter baumanii in restricted settings of a referral hospital: a neglected condition. Antimicrob Resist Infect Control. 2017;6:106.
Crossref - Zahreddine L, Khairallah M-T, Sabra AH, Baroud M, Hadi U, Matar G. Expression levels of virulence factors with up-regulation of hemolytic phospholipase C in biofilm-forming pseudomonas aeruginosa at a tertiary care center. J Appl Res. 2012;12:87-97.
- Dehbashi S, Tahmasebi H, Arabestani MR. Association between Beta-lactam Antibiotic Resistance and Virulence Factors in AmpC Producing Clinical Strains of P. aeruginosa. Osong Public Health Res Perspect. 2018;9(6):325-333.
Crossref - Tahmasebi H, Dehbashi S, Arabestani MR. New approach to identify colistin-resistant Pseudomonas aeruginosa by high-resolution melting curve analysis assay. Lett Appl Microbiol. 2020;70(4):290-299.
Crossref - Ghadaksaz A, Imani Fooladi AA, Hosseini HM, Amin M. The prevalence of some Pseudomonas virulence genes related to biofilm formation and alginate production among clinical isolates. J Appl Biomed. 2015;13(1):61-68.
Crossref - Clinical and Laboratory Standards Institute. Methods for dilution antimicrobial susceptibility tests for bacteria that grow aerobically; approved standard-10th ed. M07-A11. Clinical and Laboratory Standards Institute, Wayne, PA. 2018.
- Tahmasebi H, Maleki F, Dehbashi S, Arabestani MR. Role and function of KPC and MBL enzymes in increasing the pathogenicity of pseudomonas aeruginosa isolated from burn wounds. J Babol Univ Med Sci. 2019;21(1):127-34.
- Tahmasebi H, Dehbashi S, Arabestani MR. Prevalence and Molecular Typing of Colistin-Resistant Pseudomonas aeruginosa (CRPA) Among β-Lactamase-Producing Isolates: A Study Based on High-Resolution Melting Curve Analysis Method. Infect Drug Resist. 2020;13:2943-2955.
Crossref - Bitew A. High Prevalence of Multi-Drug Resistance and Extended Spectrum Beta Lactamase Production in Non-Fermenting Gram-Negative Bacilli in Ethiopia. Infectious Diseases: Research and Treatment. 2019;12:1178633719884951.
Crossref - Grewal US, Bakshi R, Walia G, Shah PR. Antibiotic susceptibility profiles of non-fermenting gram-negative Bacilli at a Tertiary Care Hospital in Patiala, India. Niger Postgrad Med J. 2017;24(2):121-125.
Crossref - Tohamy ST, Aboshanab KM, El-Mahallawy HA, El-Ansary MR, Afifi SS. Prevalence of multidrug-resistant Gram-negative pathogens isolated from febrile neutropenic cancer patients with bloodstream infections in Egypt and new synergistic antibiotic combinations. Infect Drug Resist. 2018;11:791-803.
Crossref - Goel V, Hogade S, Karadesai S. Prevalence of extended-spectrum beta-lactamases, AmpC beta-lactamase, and metallo-beta-lactamase producing Pseudomonas aeruginosa and Acinetobacter baumannii in an intensive care unit in a tertiary care hospital. Journal of the Scientific Society. 2013;40(1):28-31.
Crossref - Kaur A, Singh S. Prevalence of Extended Spectrum Betalactamase (ESBL) and Metallobetalactamase (MBL) Producing Pseudomonas aeruginosa and Acinetobacter baumannii Isolated from Various Clinical Samples. J Pathog. 2018;2018::7.
Crossref - Dandachi I, Sokhn ES, Dahdouh EA, et al. Prevalence and Characterization of Multi-Drug-Resistant Gram-Negative Bacilli Isolated From Lebanese Poultry: A Nationwide Study. Front Microbiol. 2018;9:550.
Crossref - Turkel I, Yildirim T, Yazgan B, Bilgin M, Basbulut E. Relationship between antibiotic resistance, efflux pumps, and biofilm formation in extended-spectrum β-lactamase producing Klebsiella pneumoniae. J Chemother. 2018;30(6-8):354-63.
Crossref - Ridha DJ, Ali MR, Jassim KA. Occurrence of Metallo-β-lactamase Genes among Acinetobacter baumannii Isolated from Different Clinical samples. J Pure Appl Microbiol. 2019;13(2):1111-1119.
Crossref - Zeighami H, Valadkhani F, Shapouri R, Samadi E, Haghi F. Virulence characteristics of multidrug resistant biofilm forming Acinetobacter baumannii isolated from intensive care unit patients. BMC Infect Dis. 2019;19(1):629.
Crossref - Yang C-H, Su P-W, Moi S-H, Chuang L-Y. Biofilm Formation in Acinetobacter Baumannii: Genotype-Phenotype Correlation. Molecules (Basel, Switzerland). 2019;24(10):1849.
Crossref - Liu C, Chang Y, Xu Y, et al. Distribution of virulence-associated genes and antimicrobial susceptibility in clinical Acinetobacter baumannii isolates. Oncotarget. 2018;9(31):21663-21673.
Crossref - Tahmasebi H, Dehbashi S, Jahantigh M, Arabestani MR. Relationship between biofilm gene expression with antimicrobial resistance pattern and clinical specimen type based on sequence types (STs) of methicillin-resistant S. aureus. Mol Biol Rep. 2020;47(2):1309-1320.
Crossref - Eze EC, Chenia HY, El-Zowalaty ME. Acinetobacter baumannii biofilms: effects of physicochemical factors, virulence, antibiotic resistance determinants, gene regulation, and future antimicrobial treatments. Infect Drug Resist. 2018;11:2277-2299.
Crossref - Wang Y-C, Huang T-W, Yang Y-S, et al. Biofilm formation is not associated with worse outcome in Acinetobacter baumannii bacteraemic pneumonia. Sci Rep. 2018;8(1):7289.
Crossref - Mueller EA, Levin PA. Plasticity in Escherichia coli cell wall metabolism promotes fitness and mediates intrinsic antibiotic resistance across environmental conditions. bioRxiv. 2018:379271.
Crossref - Ye Q, Wu Q, Zhang S, et al. Antibiotic-Resistant Extended Spectrum ß-Lactamase- and Plasmid-Mediated AmpC-Producing Enterobacteriaceae Isolated from Retail Food Products and the Pearl River in Guangzhou, China. Front Microbiol. 2017;8(96).
Crossref - Taee SR, Khansarinejad B, Abtahi H, Najafimosleh M, Ghaznavi-Rad E. Detection of algD, oprL and exoA Genes by New Specific Primers as an Efficient, Rapid and Accurate Procedure for Direct Diagnosis of Pseudomonas aeruginosa Strains in Clinical Samples. Jundishapur J Microbiol. 2014;7(10):e13583.
Crossref
© The Author(s) 2020. Open Access. This article is distributed under the terms of the Creative Commons Attribution 4.0 International License which permits unrestricted use, sharing, distribution, and reproduction in any medium, provided you give appropriate credit to the original author(s) and the source, provide a link to the Creative Commons license, and indicate if changes were made.