

ISSN: 0973-7510
E-ISSN: 2581-690X
Genetic diversity in safflower blight pathogen (Alternaria carthami) was analyzed using 20 isolates collected from major safflower growing regions of Maharashtra state in India. Experiment was conducted at Department of Agricultural Bioatechnology, College of Agriculture, Latur, VNMKV, Parbhani (M.S.). Genomic DNA extracted from each isolates of Alternaria carthami was subjected to polymerase chain reaction using 20 random decamer primers from OPA series. Only 08 of the 20 RAPD primers were selected based on repeatability. Result revealed that 100 per cent polymorphism were found. The dendrogram analysis revealed two clusters, Cluster I comprised twelve isolates viz., Ac-1, Ac-8, Ac-4, Ac-5, Ac-7, Ac-11, Ac-18, Ac-15, Ac-17, Ac-9, Ac-20 and Ac-19 with similarity coefficient of 77 per cent. Cluster II comprised of eight isolates viz., Ac-2, Ac-3, Ac-6, Ac-13, Ac-12, Ac-14, Ac-10 and Ac-16 with similarity coefficient of 76 per cent.
Safflower, Alternaria blight, Alternaria carthami, RAPD, molecular variability.
Safflower (Carthamus tinctorious) is an important oilseed crop, belonging to the family Composite and believes to be native of Afganistan. In India it is most commonly known as Kardai in Marathi and Kusum in Hindi. Its cultivation is spread over various parts of the world both in tropical and temperate countries. Safflower, a multipurpose crop has been grown for the orange red dye (carthamin) extracted from it is brilliant coloured flowers and for its quality oil (30%) rich in polyunsaturated fatty acids Linoleic acid, 78 per cent (Nimbkar, 2002).
Like other agronomical crops, safflower is also affected by many biotic and abiotic stresses/agents. Of the biotic agents, fungi cause major diseases, followed by bacteria, viruses and nematodes (Bhale et al, 1998). Among these diseases, under present situation leaf spot/blight caused by Alternaria carthami (Chowdhury) has become one of the major constraints in the production and productivity of safflower in the country in general as well as in the state of Maharashtra particularly. The disease (A. carthami) has been reported to cause 25 to 60 per cent yield losses in safflower. The disease has been also reported to reduce drastically the seed size, seed volume test as well as per cent oil content.
Typical symptoms of the disease
(A. carthami) are appeared as irregular necrotic lesions on leaves and stem. Dark necrotic lesions 2-5 mm in diameter are firstly found on hypocotyls and cotyledons. In mature plant, small brown to dark brown concentric spot of 1-2 mm appear on leaves and brown discoloration appear on the stem, dark brown spot with concentric ring up to 1 cm in diameter appear on leaves which later developed in to large lesion (Mortensen, 1983).
The Alternaria spp. are one of the widely distributed phytopathogens infecting a wide range of agronomical and horticulture crop plant species, cultivated worldwide. In Alternaria spp., the existence of a high level of molecular variability have earlier been reported by several workers (Ramjegathesh and Ebenzar, 2012; Rajender et al., 2013; Giri et al., 2014; Nikam et al., 2015). The variants within population of the phytopathogen may certainly affect the rate of disease development and can induce infections even in disease tolerant or resistant host plant species. To develop an effective programme of breeding for disease resistance comprehensive understandings of molecular variability are essential. Therefore, in present studies, molecular variability of A. carthami isolates collected from various agro-climatic zones and geographical regions of state of Maharashtra was attempted.
Molecular variability among A. carthami isolates
Molecular variability among 20 isolates of A. carthami was analyzed by RAPD molecular markers. The study was conducted at Vilasrao Deshmukh College of Agricultural Biotechnology (constituent to VNMKV, Parbhani), Latur, applying following standard procedures and protocols.
Isolation genomic DNA
The genomic DNA of 20 test isolates of A. carthami was isolated, separately by using standard 2% Cetyl trimethyl ammonium bromide (CTAB) extraction method (Doyle and Doyle, 1990). For the purpose, liquid cultures of the test isolates were raised separately in the glass conical flasks (250ml capacity) filled with Potato dextrose broth (100ml / flask) to generate mycelium. Mycelial mat of the test isolate was ground (0.5g mycelium) with white glass wool, using sterile mortar and pestle.
About 500 mg of lyophilized fungal material was ground in liquid nitrogen, dispersed in 800 µl of 2% CTAB extraction buffer at 65°C in water bath for 45 min. An equal volume of Phenol : Chloroform : Iso-amyl alcohol (25:24:1 v/v) was added, mixed well and centrifuged (7000 rpm, 10 min). The upper aqueous phase was transferred to a fresh tube and added equal volume of Chloroform : Iso-amyl alcohol (24 : 1), mixed well and centrifuged (1000rpm, 10 min.). Further, nucleic acids were precipitated by adding 0.6 volume of ice cold isopropanol and collected by centrifugation (12000rpm for 30 min.). Pellet was washed twice with 70 % ethanol, air dried and solubilised in 200 µl TE buffer (10 mM Tris-HCL, 1mM EDTA, pH 8.0). Further RNA contamination was removed by RNase treatment (Fermentas U.K.) for one hour at 37°C. The extracted DNA was resolved on 0.8% agarose gel, quantified by spectrophotometer and stored at -20°C for further use.
| Sr. No. | Steps | Temperature | Time | |
|---|---|---|---|---|
| 1 | Initial Denaturation | 940C | 4 min | |
| 2 | Denaturation | 940C | 40 cycles | 1 min |
| 3 | Annealing | 370C | 1 min | |
| 4 | Primer Extension | 720C | 2 min | |
| 5 | Final Extension | 720C | 10 min | |
| 6 | Final hold | 40C | Forever | |
Quantification of DNA
Spectrophotometer was used for quantitative and qualitative analysis of the DNA of the test isolates. Five µl of DNA sample was added in Cuvette carrying 0.995µl of sterile H2O and absorbance was measured at 280 nm wavelength. Similarly, the purity of DNA was checked by measuring the ratio of OD at A260/A280 nm. The quantification of DNA was calculated by using following formula.
DNA (µg/µl) = OD at 260 nm X dilution factor X 50/1000
RAPD analysis of A. carthami isolates
The PCR protocol for RAPD reaction was optimized with various PCR components and thermal cycler programme as detailed below.
PCR Components used for molecular characterization study of A. carthami isolates.
Sr. No. |
PCR Components |
Required Concentration |
Volume / reaction |
|---|---|---|---|
1 |
PCR Buffer |
1X |
2.5 µl |
2 |
Mgcl2 |
1.5 mM |
1.5µl |
3 |
dNTP mix |
200 µm |
0.2 µl |
4 |
Random Primers (Kit- A operon tech) |
0.4 pm |
1 ml |
5 |
Taq DNA Polymerase |
1.5 U |
0.3µl |
6 |
Template DNA |
30 ng |
1 µl |
7 |
Nuclease free water |
– |
18 µl |
– |
Total |
– |
25.0 µl |
Master mix (24 µl) containing all of the above reactants, except template DNA was dispensed in autoclaved PCR tubes (0.2 ml). Genomic DNA of each isolate of A. carthami was added to the individual tubes containing the master mix. The content of each tube were mixed by tapping with fingers, followed by a brief spun to collect the content at bottom of the tube. These tubes were placed in Thermocycler (Bio Rad, USA) and subjected to PCR according to the standardized protocol given below.
Standardized PCR protocols for amplification of DNA
A PCR master mix in sterile distilled water with all of the above mentioned compounds in required quantities were prepared and amplifications were done through Thermal Cycler, using following PCR conditions.
The amplified RAPD product was separated by electrophoresis in 1.5% agarose gel with 1 X TAE buffer, stained with ethidium bromide (0.5 µg/ml) at 90V for 1.0 to 1.5 hrs. and photographed using gel documentation system (Alpha Innotech, USA). The sizes of the amplification product were estimated using 100bp to 1kb ladder (Fermentas, UK). The polymorphism was detected by comparing RAPD product of the test isolates of A. carthami.
Data scoring and analysis
The amplified products generated from RAPD-PCR reaction were resolved on 1.5% agarose gel. The RAPD amplicons showing monomorphic and polymorphic pattern were scored and amplicon size was determined by comparison with 1 kb DNA ladder (Fermentas, U.K.).
RAPD fingerprint data was scored in present (1) or absent (0) forms, data matrices were generated and used to plot dendrogram exploited for phylogenetic analysis, by using Jacquards’ similarity coefficient, using the software NTSYS pc2.02i.
Molecular variability of A. carthami isolates
DNA fingerprinting profile
The RAPD-PCR protocol described by Chavan, (2004) was used with some modifications to produce DNA fingerprinting profile of 20 fungal isolates of A. carthami species (Table 1 and Fig. 1).
Table (1):
List of RAPD primers and polymorphism generated during fingerprint analysis of 20 isolates of A. carthami.
Sr. No. |
Primer |
Sequence (5′-3′) |
Total no. of band |
Total no. of polymorphic band |
Total No. of monomorphic band |
Polymorphic (%) |
|---|---|---|---|---|---|---|
1 |
OPA-01 |
CAGGCCCTTC |
41 |
41 |
00 |
100 |
2 |
OPA-03 |
AGTCAGCCAC |
40 |
40 |
00 |
100 |
3 |
OPA-04 |
AATCGGGCTG |
114 |
114 |
00 |
100 |
4 |
OPA-05 |
AGGGGTCTTG |
65 |
65 |
00 |
100 |
5 |
OPA-10 |
GTGATCGCAG |
84 |
84 |
00 |
100 |
6 |
OPA-13 |
CAGCACCAC |
97 |
97 |
00 |
100 |
7 |
OPA-18 |
AGGTGACCGT |
93 |
93 |
00 |
100 |
8 |
OPA-19 |
CAAACGTCGG |
75 |
75 |
00 |
100 |
— |
Total |
— |
609 |
609 |
00 |
800 |
— |
Mean |
— |
76.12 |
76.12 |
00 |
100 |
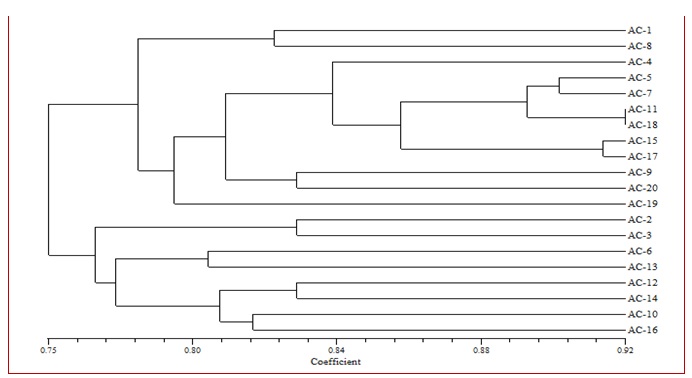
Fig. 1. Dendrogram based on RAPD analysis depicting relationship between 20 isolates of A. carthami
The PCR amplification reaction was optimized by varying concentration of PCR components. Amplification reaction was carried out in 25µl reaction mixtures containing 30ng of fungal genomic DNA, 1X PCR buffer, 1.5 mM MgCl2, 0.25 mM dNTPs, 10 pmol primers and 1.50 U of Taq DNA polymerase. PCR amplification was performed in master cycler gradient, Eppendorf PCR thermocycler, and the program consisted of an initial denaturing at 940C for 4 min, followed by 39 cycles comprising denaturation at 940C, 1 min, annealing at 370C and extension of 2 min. at 720C. The final extension was set at 720C for 10 min. PCR amplified product was separated by electrophoresis on 1.5% agarose gel in 1X TAE buffer, stained with Ethidium bromide and visualized under gel documentation system.
Diversity analysis using RAPD marker
The genomic DNA of 20 isolates of A. carthami isolated from leaf blight diseased specimens of safflower was subjected for PCR amplification by using RAPD primers (Table 1). Initially 20 random primer viz., OPA-01 to OPA-20 were screened (random primer kit A, Operon Tech., USA). Among these, 08 primers produced large number of reproducible amplicons, which were employed for molecular characterization of the 20 test isolates.
Twenty isolates of A. carthami obtained from the districts viz., Parbhani (AcPb), Nanded (AcNd), Hingoli (AcHl), Satara (AcSt), Osmanabad (AcOb), Beed (Bd), Aurangabad (AcAb), Jalna (AcJl), Yavatmal (AcYt), Washim (AcWs), Akola (AcAk), Latur (AcLt), Ahamadnagar (AcAn), Dhule (AcDl), Buldana (AcBl), Amravati (AcAm), Nandurbar (AcNb), Nasik (AcNs), Solapur (AcSl) and Jalgaon (AcJg) characterized at molecular level by using 20 random primers from OPA series i.e. OPA 1 – 20. Results indicated that among the primers tested, viz., OPA-01, OPA-03, OPA-04, OPA-05, OPA-10, OPA-13, OPA-18 and OPA19 were found more polymorphic and generated significant data for discrimination of the test isolates.
The average size of amplicons generated by the test primers was ranged between 100 bp to 10 kb. The RAPD-PCR amplification result showed that about 08 RAPD primers generated a total of 609 bands, which were found polymorphic with an average of 76.12 bands per primer. The primer OPA-04, OPA-13 and OPA-18 were found more informative, as they could generate total number of 114, 97 and 93 bands, respectively, followed by the primers, OPA-10 (84), OPA-19 (75) and OPA-05 (65). Primer OPA-03 and OPA-01 generated lowest number of bands i.e. 40 and 41, respectively (Table 1). All amplicons were found polymorphic with 100 % polymorphism.
Cluster analysis of RAPD DNA fingerprint
The data obtained by RAPD markers was analyzed by NTSYS pc2.02i and dendrogram was dipicted by using Jaccard’s Similarity Coefficient and genetic similarity matrix was obtained.
Dendrogram generated based on UPGMA analysis of RAPD data grouped all the test isolates of A. carthami into two major clusters (Fig. 1). These clusters were formed on the basis of genus as well as regional level. In the Cluster I, there were twelve isolates of A. carthami from Nanded (Ac-1), Washim (Ac-8), Yavatmal (Ac-4), Jalna (Ac-5), Solapur (Ac-7), Nandurbar (Ac-11), Dhule (Ac-18), Nasik (Ac-15), Amravati (Ac-17), Osmanabad (Ac-9), Latur (Ac-20) and Hingoli (Ac-19) districts of Maharashtra state and similarity coefficient of this group was 77 percent. Cluster II comprised of eight isolates from Akola (Ac-2), Beed (Ac-3), Buldana (Ac-6), Ahamadnagar (Ac-13), Satara (Ac-12), Aurangabad (Ac-14), Jalgaon (Ac-10) and Parbhani (Ac-16) districts of Maharashtra state and similarity coefficient of this group was 76 per cent.
Minimum coefficient of similarity of 78 per cent was observed in Hingoli isolate (Ac-19) in cluster I. This was followed by the isolate from Buldana (Ac-6) and Ahamadnagar (Ac-13) with 80 per cent; Jalgaon (Ac-10) and Parbhani (Ac-16) with 82 per cent, coefficient of similarity in cluster II; Nanded (Ac-1) and Washim (Ac-8) with 82 per cent, Osmanabad (Ac-9) and Latur (Ac-20) with 83 per cent, coefficient of similarity in cluster I; Akola (Ac-2), Beed (Ac-3), Satara (Ac-12) and Aurangabad (Ac-14) with 83 per cent, coefficient of similarity in cluster II. Whereas, maximum coefficient of similarity was recorded in Dhule (Ac-18) and Nandurbar (Ac-11) isolates with 92 per cent in cluster I. This was followed by the Amravati (Ac-17) and Nasik (Ac-15) isolates with 92 per cent of coefficient similarity; Solapur (Ac-7) and Jalna (Ac-5) isolates with 91 per cent of coefficient similarity and Yavatmal isolate (Ac-5) with 84 per cent of coefficient similarity in cluster I.
Genetic / molecular diversity among Alternaria spp. was demonstrated earlier by many workers. Prasad et al. (2003) reported significant molecular variability amongst the five isolates of A. solani from the districts of Northern Karnatka (Raichur Dharwad, Gulberga and Benglore). Pandey et al. (2005) reported that though the A. solani isolates showed close similarity at molecular level, but there existed variability amongst the isolates of A. solani at pathogenic and cultural level. Kumar et al. (2008) reported molecular variability 11 isolates of A. solani and group the isolates into two clusters. Cluster 1 comprised So, Dh, Sh and Va-5 as closely related with more than 80 per cent similarity coefficient. Naik et al. (2010) studied molecular variability of A. solani isolates, applying RAPD-PCR analysis and reported that isolates AsR5, AsD4 and AsG3 were closely related; whereas the isolates AsB2 showed distinct polymorphism with hyper virulence and pathogenic variability. Naresh et al. (2012) studied molecular variability among five A. carthami isolates and reported about 0.89 genetic similarities between Ac-3 and Ac-4 isolates; while it was minimum 0.42 with Ac-1. The isolates Ac-1 showed maximum diversity. On the basis ISSR markers the isolates in group 1 included Ac-2 and Ac-4 and group 2 included Ac-1, Ac-3 and Ac-5. Giri et al. (2014) reported a high degree of genetic variability among A. brassicae isolates and grouped the test isolates in two major groups viz., group 1 comprises seven isolates (VR, DV, P-7, P-10, LM, KR and ND) with 18 per cent similarity; while group 2 comprise three isolates (GD, KA and AS) with 24 per cent similarity. Nikam et al. (2015) studied molecular variability of among the isolates of A. solani and reported that the isolates AsBd and AsHl as closely related with 85 per cent genetic similarity; while the isolates AsHl and AsJl showed only 501 per cent genetic similarity.
Thus, in present study pathological, cultural, morphological and molecular variability observed among the isolates of A. carthami may be attributed to their geographic distribution in the Maharashtra state, long tern influence of weather parameters at a particular location, ability of the pathogen to adopt the safflower varieties grown etc.
ACKNOWLEDGMENTS
I greatly acknowledge to my Research Guide, Dr. A. P. Suryawanshi Professor, Department of Plant Pathology, College of Agriculture, Latur and Head, Dr. K. T. Apet, Department of Plant Pathology, Vasantrao Naik Marathwada Krishi Vidyapeeth, Parbhani for their support during research work for the completion of my Ph.D. degree programme.
- Bhale, M. S., Bhale, U. and Khare, M. N. Disease of important oilseed crops and their management. In pathological problems of economic crop plants and their management. (Eds. S.M. Paul Khurana), Scientific Publishers, Jodhpur. 1998; PP : 251-279.
- Chavan, R. L. Study of genetic variability among isolates of Alternaria species infecting sunflower: cultural, morphological, pathological, biochemical and molecular investigations. M. Sc. (Agri.) Thesis, M.A.U. Parbhani. 2004; PP: 1-72.
- Giri, P. P., Tasleem, M., Taj, G., Mal, R. and Kumar, A. Morphological, cultural, pathogenic and molecular variability amongst mustard isolates of Alternaria brassicae in Uttarakhand. African J. Biotech. 2014; 13 (3) : 441-448.
- Giri, P. P., Tasleem, M., Taj, G., Mal, R. and Kumar, A. Morphological, cultural, pathogenic and molecular variability amongst mustard isolates of Alternaria brassicae in Uttarakhand. African J. Biotech. 2014; 13 (3) : 441-448.
- Kumar, V., Haldar, S., Pandey, K., Singh, R., Singh, A. and Singh, P. C. Cultural, morphological, pathogenic and molecular variability amongst tomato isolates of Alternaria solani in India. World J. Microbio. Biotech. 2008; 24 (7) : 1003-1009.
- Mortensen, K. Cultural variation of Alternaria carthami isolates and their virulence on safflower. Pl. Dis. 1983; 67 (11) : 1191-1194.
- Naik, M. K., Prasad, Y., Bhat, K. V. and Devika Rani Morphological, physiological, pathogenic and molecular variability among isolates of Alternaria solani from tomato. Indian Phytopath. 2010; 63 (2) : 168-173.
- Naresh, N., Prasad, M.S.L. and Sujatha, K. Molecular characterization of Alternaria carthami of safflower using RAPD and ISSR markers. J. Oilseeds Res. 2012; 29 (Spl. Issue) : 336-338.
- Nikam, P. S., Suryawanshi, A. P. and Chavan A. A. Pathogenic, cultural, morphological and molecular variability among eight isolates of Alternaria solani, causing early blight of tomato. African J. Biotech. 2015; 14 (10) : 872-877.
- Nimbkar, N. Safflower Rediscovered Times. Agric. J. 2002; 2 : 32-36.
- Pandey, K. K., Pandey, P. K. and Mathura, R. Molecular characterization, cultural and pathogenic variability of Alternaria solani isolates. J. Mycol. Pl. Pathol. 2005; 35 (3): 483.
- Prasad, Y., Naik M. K., Naik D., Reddy M. K., Vidya R., Fernandez L. and Rawal, R. D. Morphological, physiological, pathogenic and molecular variability amongst isolates of Alternaria solani, the incitant of early blight of tomato. Indian Phytopath. 2003; 56 (3) : 338.
- Rajender, J., Pushpavathi, B., Prasad, M. S. L. and Naresh, N. Cultural, morphological and pathogenic characterization of isolate of Alternaria helianthi causing sunflower blight. Indian J. Pl. Prot. 2013; 41 (1) : 76-84
- Ramjegathesh, R. and Ebenezar, E. G. Morphological and physiological characters of A. alternata causing leaf blight disease of onion. Intern. J. Pl. Pathol. 2012; 3 : 34-44.
© The Author(s) 2017. Open Access. This article is distributed under the terms of the Creative Commons Attribution 4.0 International License which permits unrestricted use, sharing, distribution, and reproduction in any medium, provided you give appropriate credit to the original author(s) and the source, provide a link to the Creative Commons license, and indicate if changes were made.