

ISSN: 0973-7510
E-ISSN: 2581-690X
The study design correlates the potential of microbial strains isolated from okra and eggplant phyllosphere to degrade the commonly used organo-pesticides, chlorpyrifos (CP) and cypermethrin (CY). Phyllosphere microbes are the first to interact with sprayed pesticides and initiate key metabolic processes that may be involved in biodegradation, helping identify important intermediates and possible degradation pathways. Six isolates belonging to Bacillus sp., Pseudomonas sp., and Azotobacter sp. were tested for pesticide degradation in a mineral salt medium supplemented with 50 ppm of the individual pesticides. Samples were collected at different time intervals for Gas Chromatography-Mass Spectrometry (GC-MS/MS) analysis of the pesticide residues. The statistical significance of the degradation was assessed using one-way analysis of variance (ANOVA) (p <0.05). All six isolated bacterial strains exhibited varying degrees of pesticide degradation. The maximum degradation was recorded for CP (up to 85%) and for CY (up to 68%) by strain Azotobacter chroococcum (76A). The ANOVA results confirmed statistically significant differences in degradation rates among the strains (p <0.05), indicating diverse biodegradation efficiencies. The main identified metabolites were 3,5,6-trichloro-2-pyridinol (TCP) from CP and 3-Phenoxybenzaldehyde (3-PBA) from CY. Both secondary metabolites exhibited lower acute toxicity than their parent compounds. These findings suggest that Azotobacter strain 76A could be used as a valuable tool in bioremediation strategies. The results of this study align with previous reports that highlight the dual role of Azotobacter in nitrogen fixation and xenobiotic degradation. Overall, integrating microbiological expertise with advanced chemical analyses supports sustainable innovations and promotes safer agricultural practices.
Chlorpyrifos, Cypermethrin, Azotobacter chroococcum 76A, Phyllosphere Microbes, Degradation Pathways, Bioremediation
The phyllosphere, which includes the above-ground parts of plants, harbours diverse microbial communities, predominantly bacteria, which play crucial roles in plant health and environmental interactions.1,2 Microbes inhabiting the phyllosphere influence plant health by limiting pathogen colonization through competition, antimicrobial production, and activation of plant defense pathways.3 In addition, they support plant growth by facilitating nitrogen fixation, synthesizing phytohormones, and enhancing stress resilience.4,5 When pesticides are sprayed in agricultural fields, phyllosphere microbes are the first to interact with these compounds. They serve as the first line of action in initiating the transformation of xenobiotic compounds. Studies have shown that phyllospheric bacterial communities can degrade organophosphorus pesticides. For instance, research on rape plants demonstrated that the natural microbial communities on leaves could degrade dichlorvos, an organophosphorus pesticide.6 Thus, phyllosphere-associated microbial consortia help reduce the overall toxicity on the plant surface and surrounding environment. Under environmental stress, phyllosphere fungi and bacteria secrete extracellular enzymes such as hydrolases, transferases, isomerases, and ligases, which contribute to the degradation of crop protection agents. These enzymes mediate key biochemical reactions, including hydrolysis, oxidation, and reduction, which are essential for pesticide degradation.7,8
Pesticides are widely employed in agriculture to increase crop yield and ensure food safety by combatting insects, pests, weeds, and microbial threats. Despite their benefits, the excessive and indiscriminate use of pesticides has resulted in significant environmental contamination, posing serious risks to soil health, water resources, and non-target organisms, including humans.9 Among various categories of pesticides, organophosphate and organochlorine compounds are particularly concerning owing to their high persistence, bioaccumulation, and toxicity, resulting in their widespread detection in the soil, water bodies, and agricultural products.10 Owing to their possible cancer-causing and neurotoxic effects, there is an immediate need for eco-friendly strategies to degrade and remove them from the environmental system.11
The application of microbes in bioremediation is increasingly recognized as an effective and sustainable approach for the detoxification of pesticide-contaminated sites. Several bacterial species, including Bacillus, Pseudomonas, Enterobacter, and Arthrobacter, have been reported to degrade organophosphate and organochlorine pesticides through enzymatic pathways, resulting in the breakdown of hazardous substances into less toxic metabolities.12-14 Bacterial degradation efficiency relies on several factors, including bacterial adaptation to pesticide-contaminated environments, the presence of specific catabolic enzymes, and surrounding conditions such as pH, temperature, and nutrient availability.15,16
Different analytical techniques have been used to evaluate pesticide degradation, among which Gas Chromatography-Mass Spectrometry (GC-MS) is one of the most sensitive and widely employed. Through GC-MS/MS, precise identification and quantification of pesticide residues and their breakdown products are achieved, helping researchers assess the efficiency of biodegradation pathways.17 Earlier studies have employed GC-MS to analyze the degradation of pesticides such as chlorpyrifos (CP), cypermethrin (CY) and carbofuran, facilitating the detection of intermediate compounds and identifying bacterial strains with strong degradation capabilities.14,18 Efficient pesticide degradation by bacteria is critical for their implementation in bioremediation and the formulation of bioaugmentation strategies for restoring contaminated agricultural sites.19
In our previous study, bacterial strains were isolated from pesticide-contaminated phyllosphere of okra (Abelmoschus esculentus) and eggplant (Solanum melongena) crops, and identified using 16S rRNA sequencing.20 Our findings from the okra and eggplant systems offer novel insights into warm-climate vegetable crops with different leaf morphologies and microbial associations. These two most widely cultivated vegetables are frequently treated with high levels of pesticides. Phyllosphere bacterial species were the focus of this study, because they naturally inhabit the aerial surfaces of plants, where they are frequently exposed to pesticides. Continuous exposure to these chemical compounds may lead to metabolic adaptations that enable them to tolerate and degrade pesticides.
This research primarily aimed to test the hypothesis that phyllosphere-associated bacterial strains isolated from pesticide-exposed crops (okra and eggplant) have developed metabolic capabilities to degrade organophosphate (CP) and pyrethroid (CY) pesticides, which can be effectively evaluated for bioremediation applications through residue quantification and metabolite profiling via GC-MS/MS by comparing treated and untreated samples. Therefore, a comparative analysis of the degradation performances of different bacterial isolates identified the most effective strain capable of breaking down pesticide residues. This study enhances our understanding of the microbial mechanisms involved in pesticide degradation and highlights their potential applications in bioremediation strategies, providing a sustainable approach for mitigating pesticide contamination in agricultural ecosystems. Enhancing the growth of beneficial microbial communities on plant surfaces can accelerate the natural degradation of pesticide residues, thereby minimizing environmental impacts and increasing crop safety.21
Chemicals and reagents
All chemicals used were of analytical grade, and the CP and CY standards were purchased from Sigma-Aldrich, USA. Nutrient broth, sodium sulfate, ethyl acetate and minimal salt medium (MSM) constituents: KH2PO4, K2HPO4, NH4NO3, MgSO4.7H2O, Ca (NO3)2.4H2O, and Fe (SO4)3. Six bacterial cultures namely, Bacillus sp. SKM33, Bacillus subtilis, Bacillus sp. StrainVPS50, Pseudomonas aeruginosa strain Y12, Azotobacter chroococcum strain 76A, and Azotobacter sp. Strain N9, were successfully isolated and identified from the phyllosphere, as described in our previous research.20
Sample preparation
All the six bacterial isolates were grown individually in nutrient broth after being maintained at 37 °C for 24 h under incubation conditions. An aliquot (1 mL) of the grown bacterial culture was aseptically inoculated into individual 250 mL flasks containing 100 mL MSM supplemented with pesticides (50 ppm). Uninoculated flasks were used as controls. All experiments were conducted in triplicates. All the samples were incubated for 0, 1, 3, 5, 10 and 16 days on a rotary shaker at 100 rpm at 30 °C. Subsequently, liquid samples (10 mL) collected on specific days were mixed with 50 mL of deionized water and extracted using 20 mL of hexane on a rotary shaker for 1 h.22,23 The extracts were dehydrated using anhydrous Na2SO4 and subsequently dried by evaporation under nitrogen at 45 °C using a rotary evaporator. The dried extract was reconstituted with 1 mL of an ethyl acetate: hexane (50:50) mixture, followed by thorough vortexing. After extraction, samples were filtered using 0.22 µm syringe filters to remove particulates that might interfere with GC-MS/MS. Finally, the solution was transferred into an amber glass vial for GC-MS/MS analysis.24
GC-MS analysis
The samples were stored in amber glass vials at -20 °C until analysis. Prior to GC-MS/MS injection, samples were equilibrated at 4 °C. The glassware and vials were pre-rinsed with methanol to prevent cross-contamination. The residues of CP and CY were determined by a gas chromatograph mass detector triple quadrupole (GC-MS/MS),25 instrument (Agilent GC-7890) with an Auto Sampler and column HP-5MS UI, 15 m long, 0.25 µm film thickness, 25 mm ID capillary, and a max column temperature of 315 °C. The splitless mode was used with helium as the carrier gas at a constant pressure and a flow rate of 2.617 mL/min. The oven’s initial temperature was set to 70 °C, held for 10 min, then increased to 285 °C at 10 °C/min, and held for 7 min, for a total run time of 25 min. Quality control was ensured through repeated injections and instrument calibration.
Statistical methods
The degradation data were analyzed using one-way analysis of variance (ANOVA) to evaluate the effect of the bacterial strains on pesticide degradation over the incubation period. Where appropriate, one-way ANOVA followed by Tukey’s honest significant difference (HSD) post-hoc test was used for pairwise comparisons at individual time points. Normality of residuals was assessed using the Shapiro-Wilk test, and homogeneity of variances was tested using Levene’s test before performing ANOVA. The data met the required assumptions for performing an ANOVA. A significance level of p <0.05 was considered for all comparisons to identify specific differences between strains. All results are reported as mean ± standard deviation of three independent replicates. Analyses were performed using GraphPad Prism (version X) and SPSS (version Y).
The present study demonstrated the biodegradation efficiency of six phyllosphere-associated microbial strains from okra and eggplant for the widely used pesticides CP and CY. The described results present both quantitative degradation data and GC-MS-based metabolic product identification. The CP degradation patterns of the six isolates are presented in Table 1. The residual CP concentrations (ppm) and percentage degradation were measured over specified durations of 0, 1, 3, 5, 10, and 16 days. Among the isolated strains, Azotobacter chroococcum 76A demonstrated the highest degradation, reaching 85% by day 16 (from 50.0 ± 0.4 ppm to 7.5 ± 0.5 ppm), significantly outperforming all other strains (ANOVA, F = 42.37, p <0.05). Azotobacter sp. N9 was the second-most efficient degrader (82.0%), followed by Bacillus sp. SKM33 (71.2%), Bacillus subtilis (69.0%), Bacillus sp. VPS50 (63.6%), and Pseudomonas aeruginosa Y12 (60.0%). In contrast, minimal degradation was observed in the uninoculated control, confirming that degradation was primarily due to bacterial activity. The degradation curve (Figure 1) shows a rapid decline in CP concentration during the first 5 days, particularly for the Azotobacter isolates, followed by a gradual plateau phase through day 16. During the 16 days study period, the rate of CP degradation in the uninoculated control remained very low. The results were analyzed for the experiments conducted in triplicates and are presented as mean ± standard deviation.
Table (1):
Residual chlorpyrifos concentration (in ppm) during degradation by various bacterial strains over a 16-day incubation period. Measurements were taken at specific time points (0, 1, 3, 5, 10, 16 days). Control treatment (chlorpyrifos without bacterial inoculation) was also included. Values are expressed as mean ± standard deviation (SD) from three independent experiments
| Bacterial strains | Incubation time (Days) | ||||||
|---|---|---|---|---|---|---|---|
| 0 | 1 | 3 | 5 | 10 | 16 | ||
| Bacillus sp. SKM33 | Conc. (ppm) ±SD | 50.0 ± 0.4 | 43.5 ± 0.9 | 33.5 ± 0.7 | 25.0 ± 0.6 | 20.5 ± 0.5 | 14.4 ± 0.4 |
| % Degradation | 0.0 | 13.0 | 33.0 | 50.0 | 59.0 | 71.2 | |
| Bacillus subtilis | Conc. (ppm) ±SD | 50.0 ± 0.2 | 45.5 ± 0.7 | 37.0 ± 0.8 | 28.0 ± 0.7 | 21.0 ± 0.5 | 15.5 ± 0.4 |
| % Degradation | 0.0 | 11.1 | 26.0 | 44.0 | 58.0 | 69.0 | |
| Bacillus sp. VPS50 | Conc. (ppm) ±SD | 50.0 ± 0.3 | 43.0 ± 0.9 | 33.0 ± 0.7 | 28.4 ± 0.7 | 22.7 ± 0.5 | 18.2 ± 0.4 |
| % Degradation | 0.0 | 14.0 | 34.0 | 43.2 | 54.6 | 63.6 | |
| Pseudomonas aeruginosa Y12 | Conc. (ppm) ±SD | 50.0 ± 0.7 | 45.0 ± 0.5 | 36.5 ± 0.8 | 30.7 ± 0.7 | 25.0 ± 0.5 | 21.0 ± 0.4 |
| % Degradation | 0.0 | 10.0 | 28.0 | 40.0 | 50.0 | 60.0 | |
| Azotobacter chroococcum 76A | Conc. (ppm) ±SD | 50.0 ± 0.2 | 40.0 ± 0.3 | 28.0 ± 0.8 | 18.0 ± 0.7 | 9.0 ± 0.6 | 7.5 ± 0.5 |
| % Degradation | 0.0 | 20.0 | 44.0 | 64.0 | 82.0 | 85.0 | |
| Azotobacter sp. N9 | Conc. (ppm) ±SD | 50.0 ± 0.5 | 44.5 ± 0.8 | 35.5 ± 0.7 | 26.5 ± 0.6 | 16.0 ± 0.4 | 9.0 ± 0.3 |
| % Degradation | 0.0 | 11.0 | 29.0 | 47.0 | 68.0 | 82.0 | |
| Control | Conc. (ppm) ±SD | 50.0 ± 0.4 | 49.8 ± 0.2 | 48.4 ± 0.3 | 47.2 ± 0.3 | 45.8 ± 0.2 | 45.1 ± 0.2 |
| % Degradation | 0 | 0.4 | 3.2 | 5.6 | 8.4 | 9.8 | |
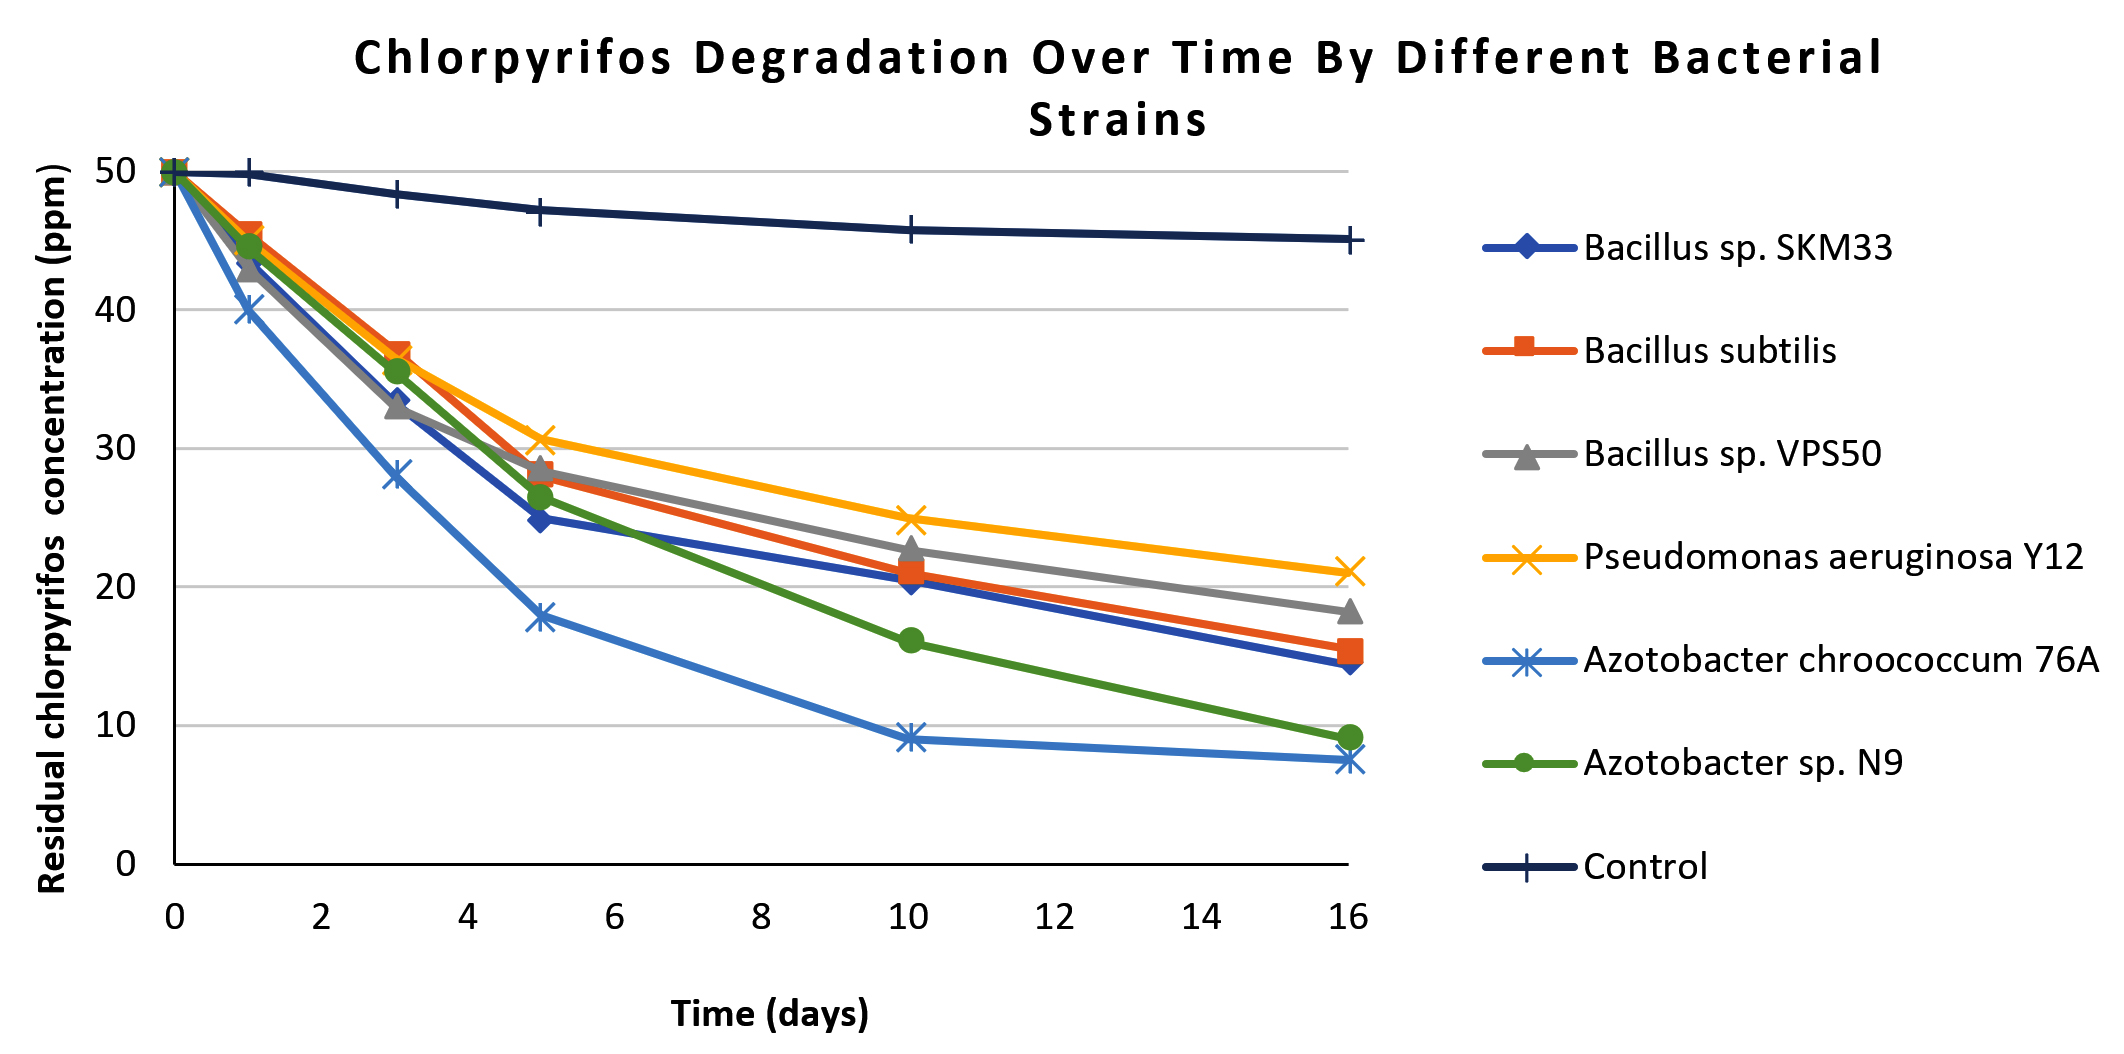
Figure 1. Line graph showing chlorpyrifos degradation patterns over 16 days for all isolated bacterial strains and control. Each line represents a bacterial strain, differentiated by distinct markers. In the graph x-axis represents residual chlorpyrifos concentration (in ppm) and y-axis represent number of days of incubation
The metabolic products of CP degradation were identified by GC-MS analysis by matching the retention times of the peaks with those of the library. As shown in Figure 2, multiple intermediates were detected, with 3,5,6-trichloro-2-pyridinol (TCP) as the key intermediate at a retention time of 5.94 minutes. This finding is consistent with those of the previous studies.26,27 Mass spectra and library-based identification using characteristic fragment ions and molecular ions (m/z) further confirmed the degradation process. However, absolute quantification was not performed because of the unavailability of certified metabolite standards, and intermediates were identified qualitatively. In Figure 3, which presents the mass-spectra, a prominent ion was observed at m/z 219, which corresponds to a diagnostic fragment of TMBDS-derivatized 3,5,6-TCP. In addition, a significant fragment at m/z 93 was detected, which was attributed to a chlorinated pyridyl ion originating from the fragmentation of the pyridine ring structure of TCP. These fragmentation patterns matched the reference spectra from the NIST Mass Spectral Library and previous reports, supporting the identity of the compound as 3,5,6-TCP. Other intermediates such as chloropyridinone and non-toxic organic acids, were detected around a retention time 4.70 min. TCP was transformed into chloropyridinone by oxidation and then into dichloropyridinol (retention time 7.84 min) by dichlorination. This transformation is supported by microbial degradation and is consistent with the previous study.28 After complete mineralization, acetic acid and formic acid were formed as final products. This finding was also observed in earlier biodegradation studies.29 This stepwise degradation, presented in Figure 4, demonstrates the metabolic versatility of the Azotobacter strain and underscores their role in the bioremediation of CP-contaminated environment.
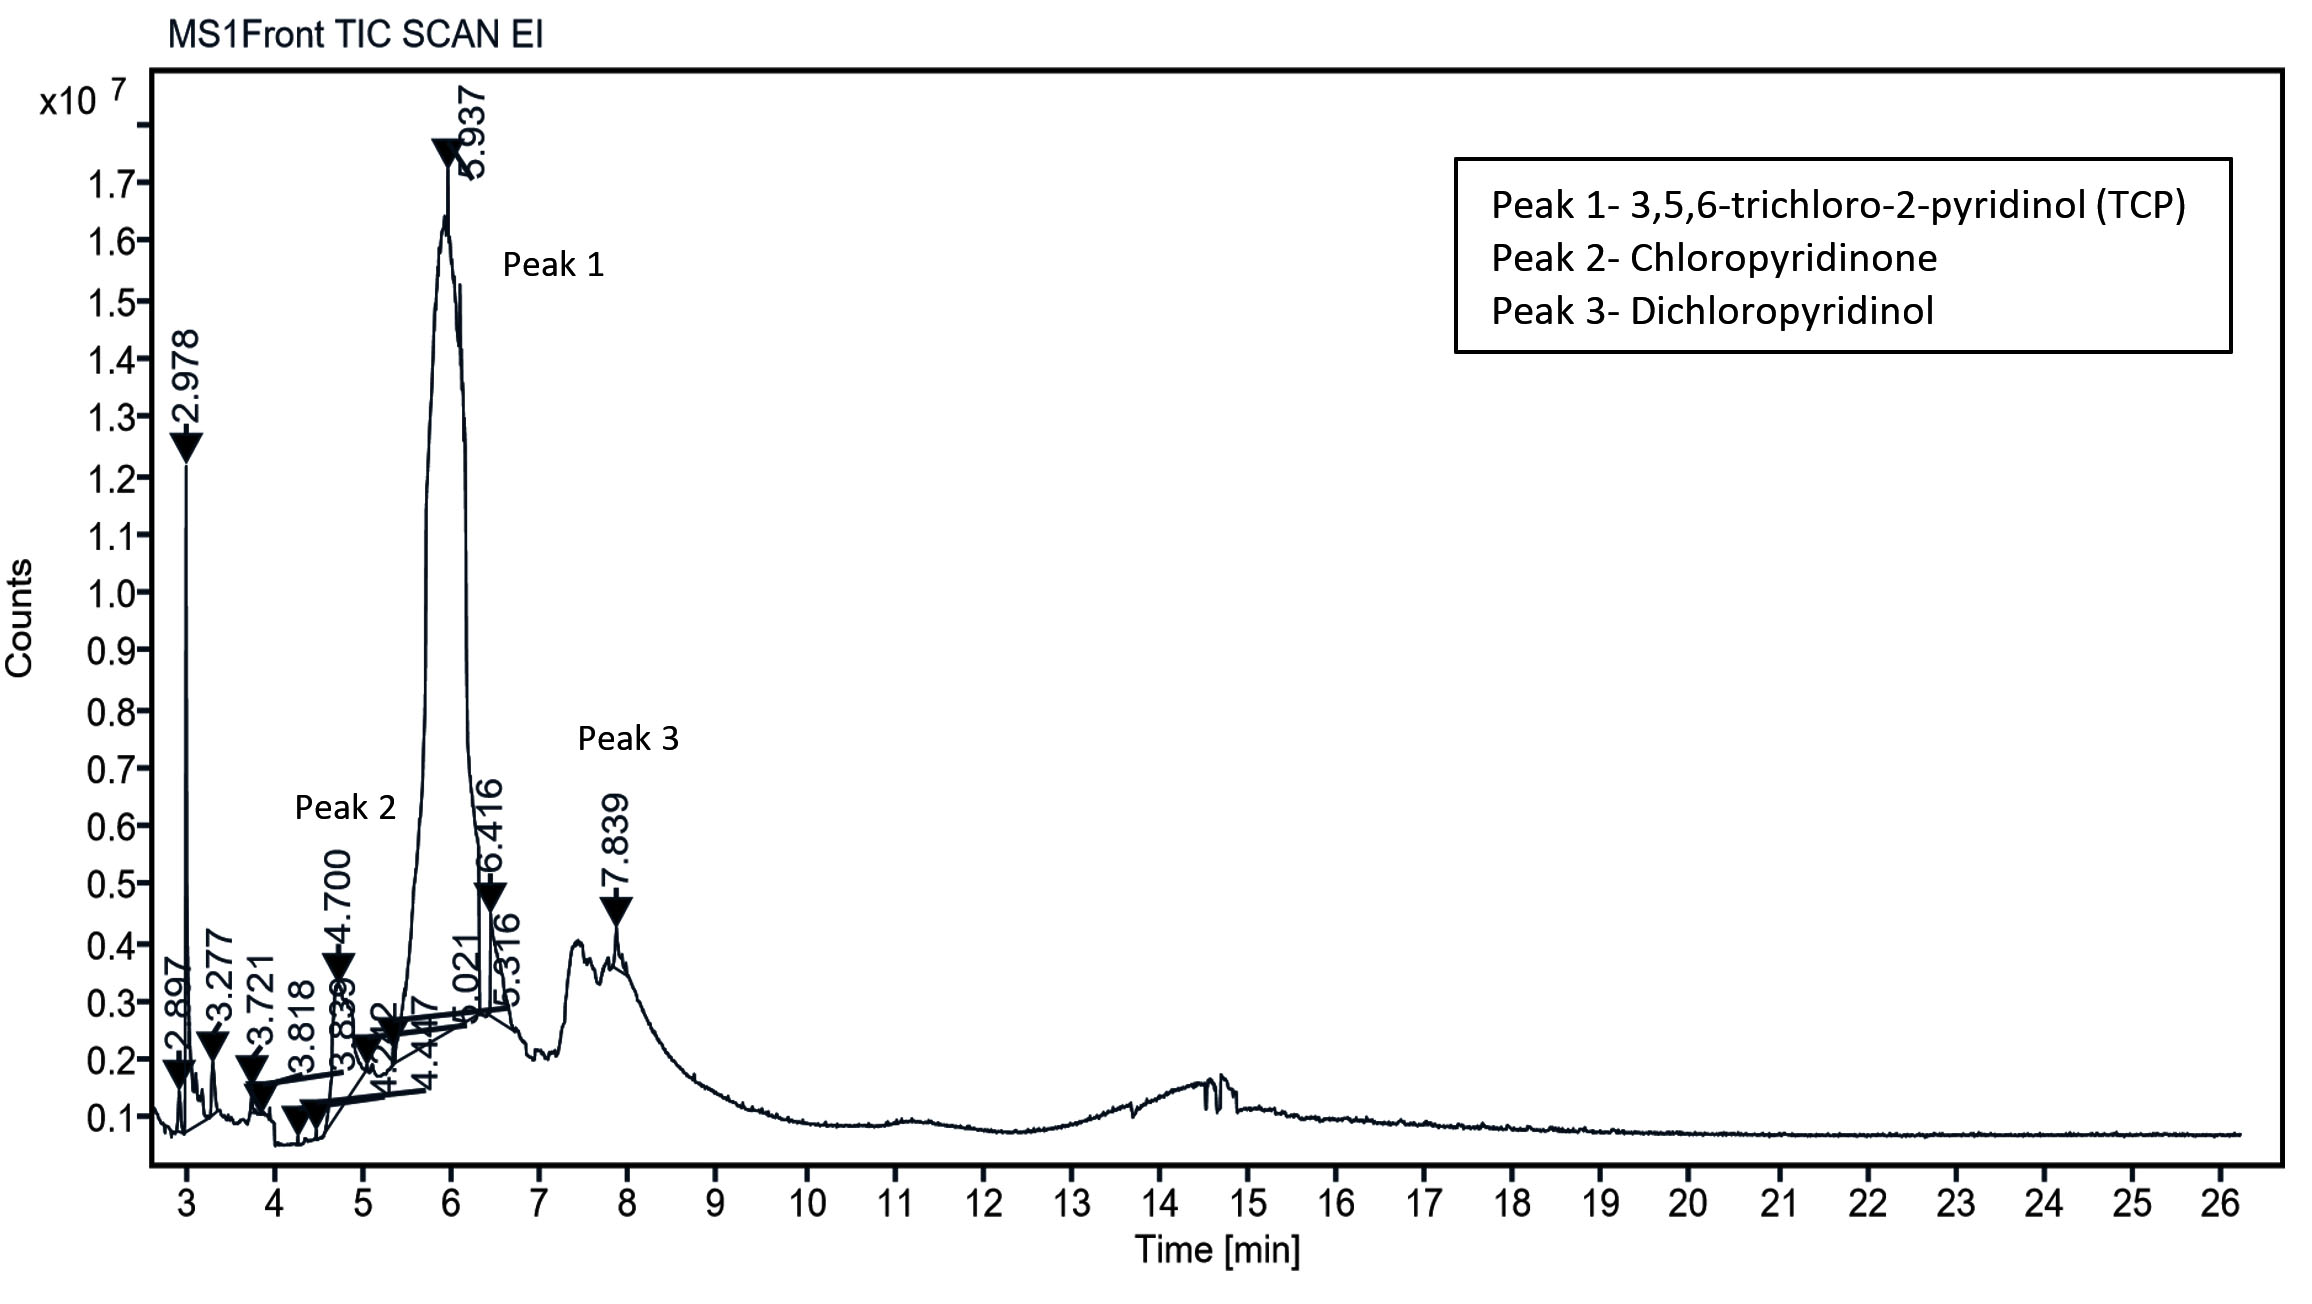
Figure 2. GC-MS chromatogram of chlorpyrifos and metabolites formed during the degradation by Azotobacter chroococcum 76A. Peaks represent detected compounds based on retention time. Peak labelled as 1 corresponds to 3,5,6-trichloro 2-pyridinol (TCP); 2 as chloropyridinone and 3 as dichloropyridinol
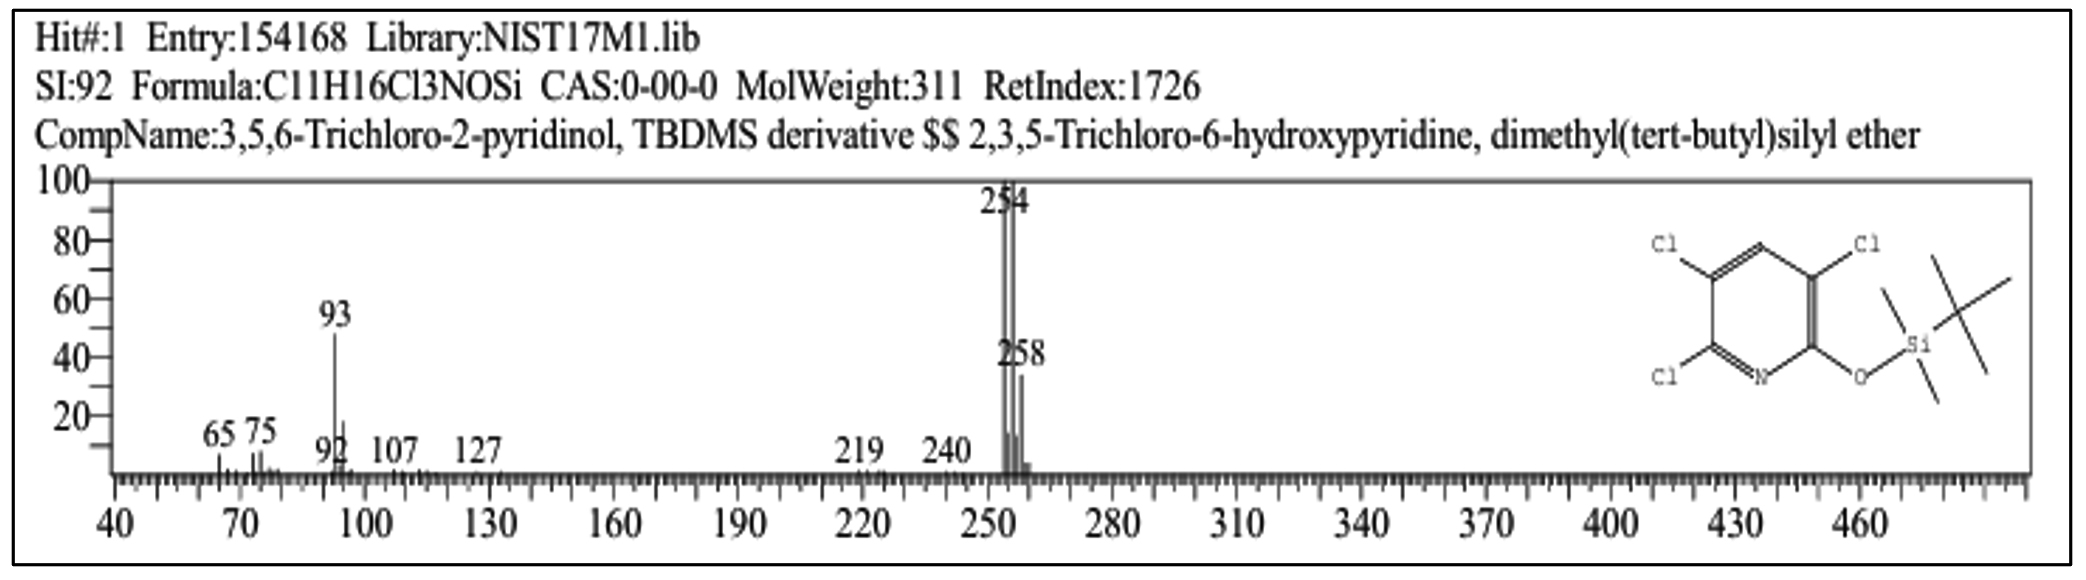
Figure 3. Mass spectra of 3,5,6-Trichloro-2-pyridinol (TCP) produced from chlorpyrifos degradation by Azotobacter chroococcum 76A. In the spectra x-axis represents m/z ratio and y-axis represents relative abundance
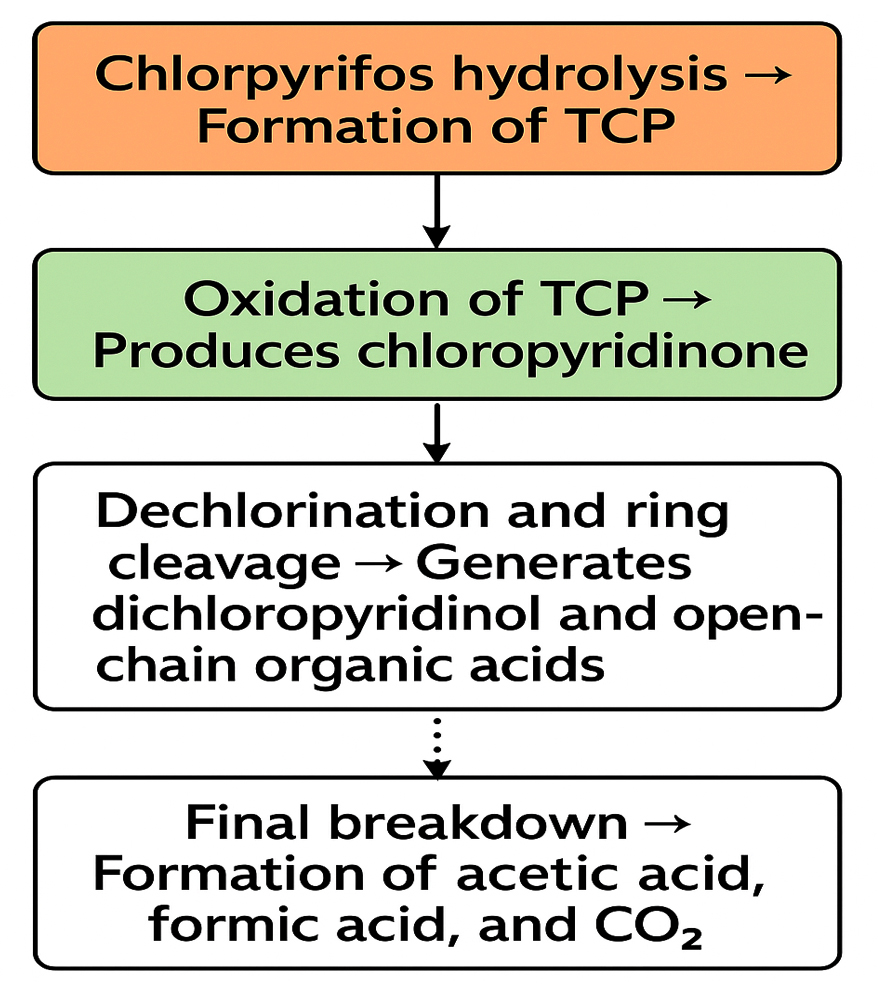
Figure 4. Flowchart representing proposed pathway for Chlorpyrifos degradation by Azotobacter chroococcum 76A. Experimentally confirmed steps are marked with solid arrows and proposed steps with dashed arrows
Following the analysis of CP degradation, the degradation profile of CY by the same six isolates was investigated under similar experimental conditions, and the results are summarized in Table 2. Azotobacter chroococcum 76A again exhibited the highest removal (68.0% by day 16, from 50.0 ± 0.6 ppm to 16.0 ± 0.4 ppm), significantly different from the other isolates (ANOVA, F = 42.37, p <0.05). Azotobacter sp. N9 removed 61.0% of the CY, followed by, Pseudomonas aeruginosa Y12 (59.0%), Bacillus sp. VPS50 (53.0%), Bacillus subtilis (51.4%), and Bacillus sp. SKM33 (45.2%). In the uninoculated control, CY degradation was minimal throughout the 16-day experimental period. The degradation profiles (Figure 5) mirror the CP trends, with steep initial declines followed by slow stabilization phases. Similar to CP, the degradation curve in Figure 5 shows a rapid reduction in the CY residue over the first 10 days, followed by a stabilization phase extending to 16 days.
Table (2):
Residual cypermethrin concentration (in ppm) during degradation by various bacterial strains over a 16 day incubation period. Measurements were taken at specific time points (0, 1, 3, 5, 10, 16). Control treatment (cypermethrin without bacterial inoculation) was also included to assess abiotic degradation. Values are expressed as mean ± standard deviation (SD) from three independent experiments
| Bacterial strains | Incubation time (Days) | ||||||
|---|---|---|---|---|---|---|---|
| 0 | 1 | 3 | 5 | 10 | 16 | ||
| Bacillus sp. SKM33 | Conc. (ppm) ±SD | 50.0 ± 0.2 | 46.8 ± 0.4 | 40.5 ± 0.4 | 33.0 ± 0.1 | 30.3 ± 0.3 | 27.4 ± 0.7 |
| % Degradation | 0.0 | 6.4 | 19.0 | 34.0 | 39.4 | 45.2 | |
| Bacillus subtilis | Conc. (ppm) ±SD | 50.0 ± 0.4 | 45.0 ± 0.6 | 38.2 ± 0.6 | 31.5 ± 0.3 | 28.1 ± 0.2 | 24.3 ± 0.5 |
| % Degradation | 0.0 | 10.0 | 23.6 | 37.0 | 43.8 | 51.4 | |
| Bacillus sp. VPS50 | Conc. (ppm) ±SD | 50.0 ± 0.1 | 46.5 ± 0.4 | 40.8 ± 0.3 | 32.6 ± 0.5 | 28.7 ± 0.8 | 23.5 ± 0.5 |
| % Degradation | 0.0 | 7.0 | 18.4 | 34.8 | 42.6 | 53.0 | |
| Pseudomonas aeruginosa Y12 | Conc. (ppm) ±SD | 50.0 ± 0.4 | 44.2 ± 0.5 | 39.5 ± 0.5 | 33.0 ± 0.3 | 27.6 ± 0.7 | 20.5 ± 0.8 |
| % Degradation | 0.0 | 11.6 | 21.0 | 34.0 | 44.8 | 59.0 | |
| Azotobacter chroococcum 76A | Conc. (ppm) ±SD | 50.0 ± 0.6 | 43.8 ± 0.2 | 36.5 ± 0.3 | 27.2 ± 0.5 | 18.5 ± 0.6 | 16.8 ± 0.4 |
| % Degradation | 0.0 | 12.4 | 27.0 | 45.6 | 63.0 | 68.0 | |
| Azotobacter sp. N9 | Conc. (ppm) ±SD | 50.0 ± 0.3 | 46.3 ± 0.5 | 39.2 ± 0.2 | 31.6 ± 0.4 | 21.4 ± 0.7 | 19.5 ± 0.6 |
| % Degradation | 0.0 | 7.4 | 21.6 | 36.8 | 57.2 | 61.0 | |
| Control | Conc. (ppm) ±SD | 50.0 ± 0.2 | 49.8 ± 0.2 | 48.4 ± 0.3 | 47.4 ± 0.3 | 46.3 ± 0.2 | 45.1 ± 0.2 |
| % Degradation | 0 | 0.8 | 3.6 | 5.2 | 7.4 | 8.6 | |
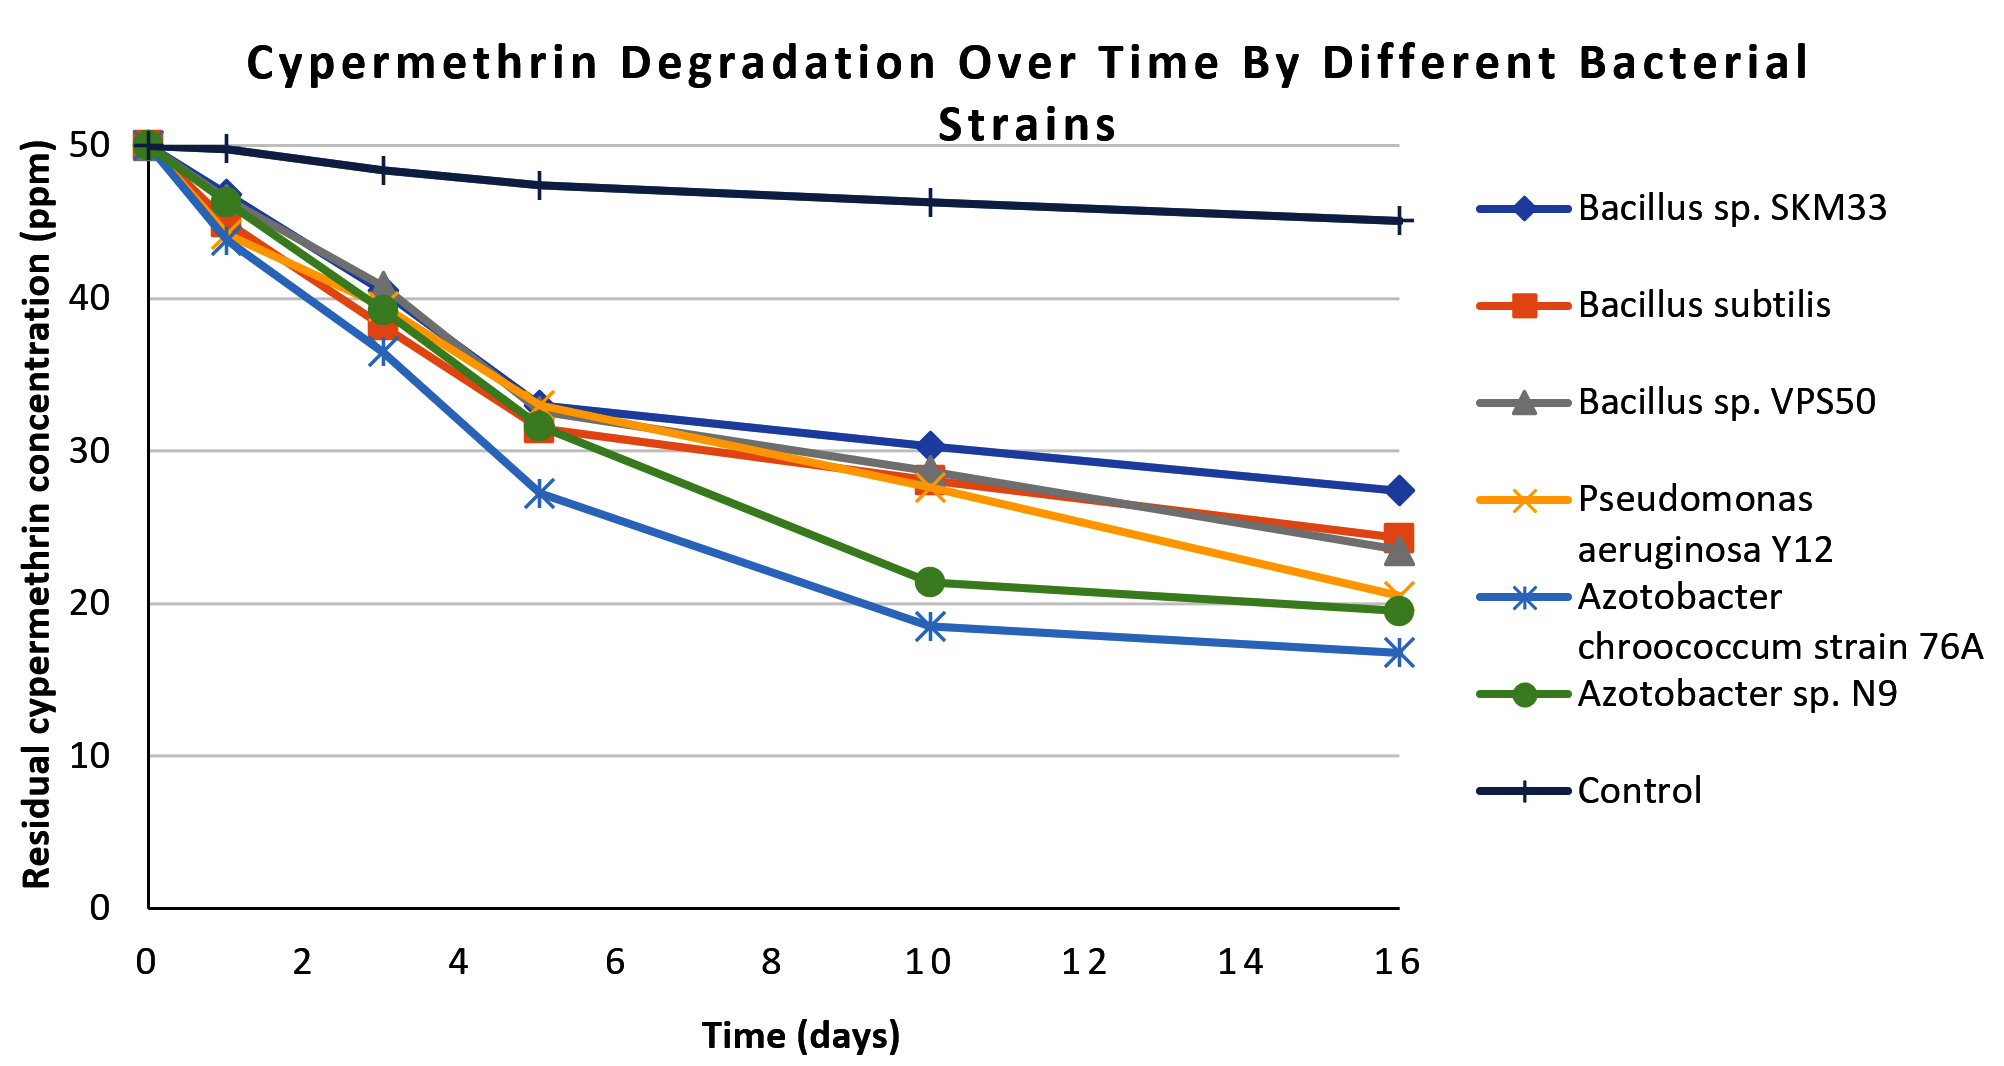
Figure 5. Line graph showing cypermethrin degradation patterns over 16 days for all isolated bacterial strains and control. Each line represents a bacterial strain, differentiated by distinct markers. In the graph x-axis represents residual cypermethrin concentration (in ppm) and y-axis represent number of days of incubation
Subsequent, GC-MS analysis of CY revealed the formation of primary degradation products from ester bond hydrolysis, such as 3-Phenoxybenzaldehyde (PBA), with a retention time of 5.77 min and cyano-3-phenoxybenzyl alcohol and its derivatives at approximately 7.0 min (Figure 6). Identification was based on matching the retention times and characteristic mass spectral fragment ions with the library data. The mass spectrum of the degradation product, shown in Figure 7, exhibits a prominent molecular ion at m/z 198, corresponding to the molecular weight of 3-PBA. The formation of 3-PBA has been reported in several studies.30,31 The detection of cyano-3-phenoxybenzyl alcohol was consistent with the results of previous study.32 Minor peaks corresponding to other non-toxic metabolites were also observed. Studies on the bacterial metabolism of pyrethroids have documented the formation of hydroquinone derivatives and their subsequent breakdown into maleic acid and succinic acid, indicating progressive breakdown toward complete mineralization.33 A sequential presentation of the proposed CY degradation pathway by Azotobacter chroococcum 76A is shown in Figure 8. The degradation pathway confirmed the metabolic adaptability of the Azotobacter strain for the eco-friendly detoxification of CY.
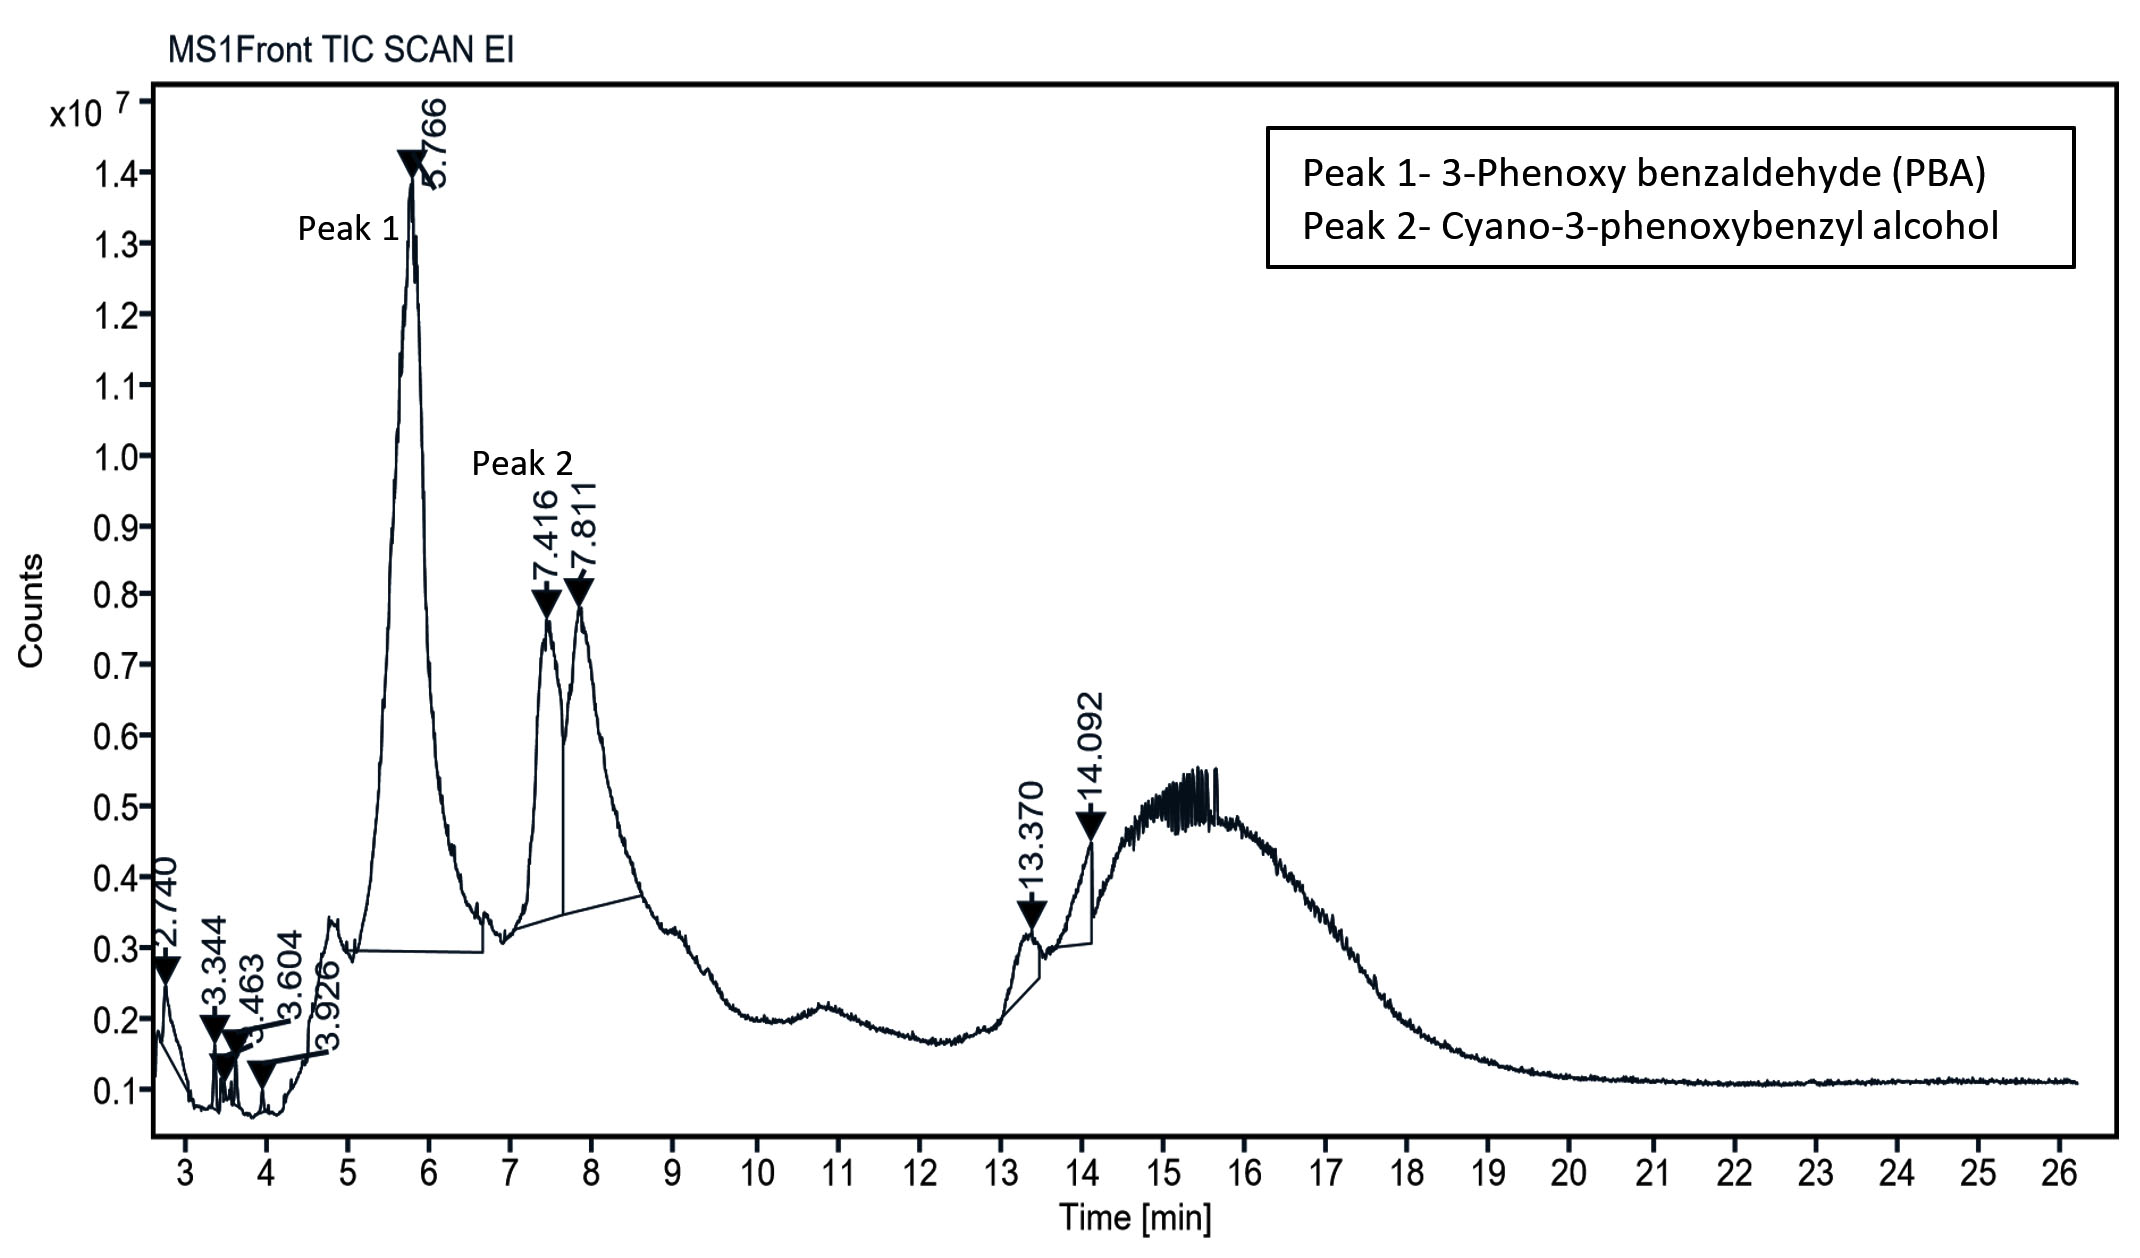
Figure 6. GC-MS chromatogram of chlorpyrifos and metabolites formed during the degradation by Azotobacter chroococcum 76A. Peaks represent detected compounds based on retention time. Peak labelled as 1 corresponds to 3-phenoxybenzaldehyde (PBA) and 2 as cyano-3-phenoxybenzyl alcohol
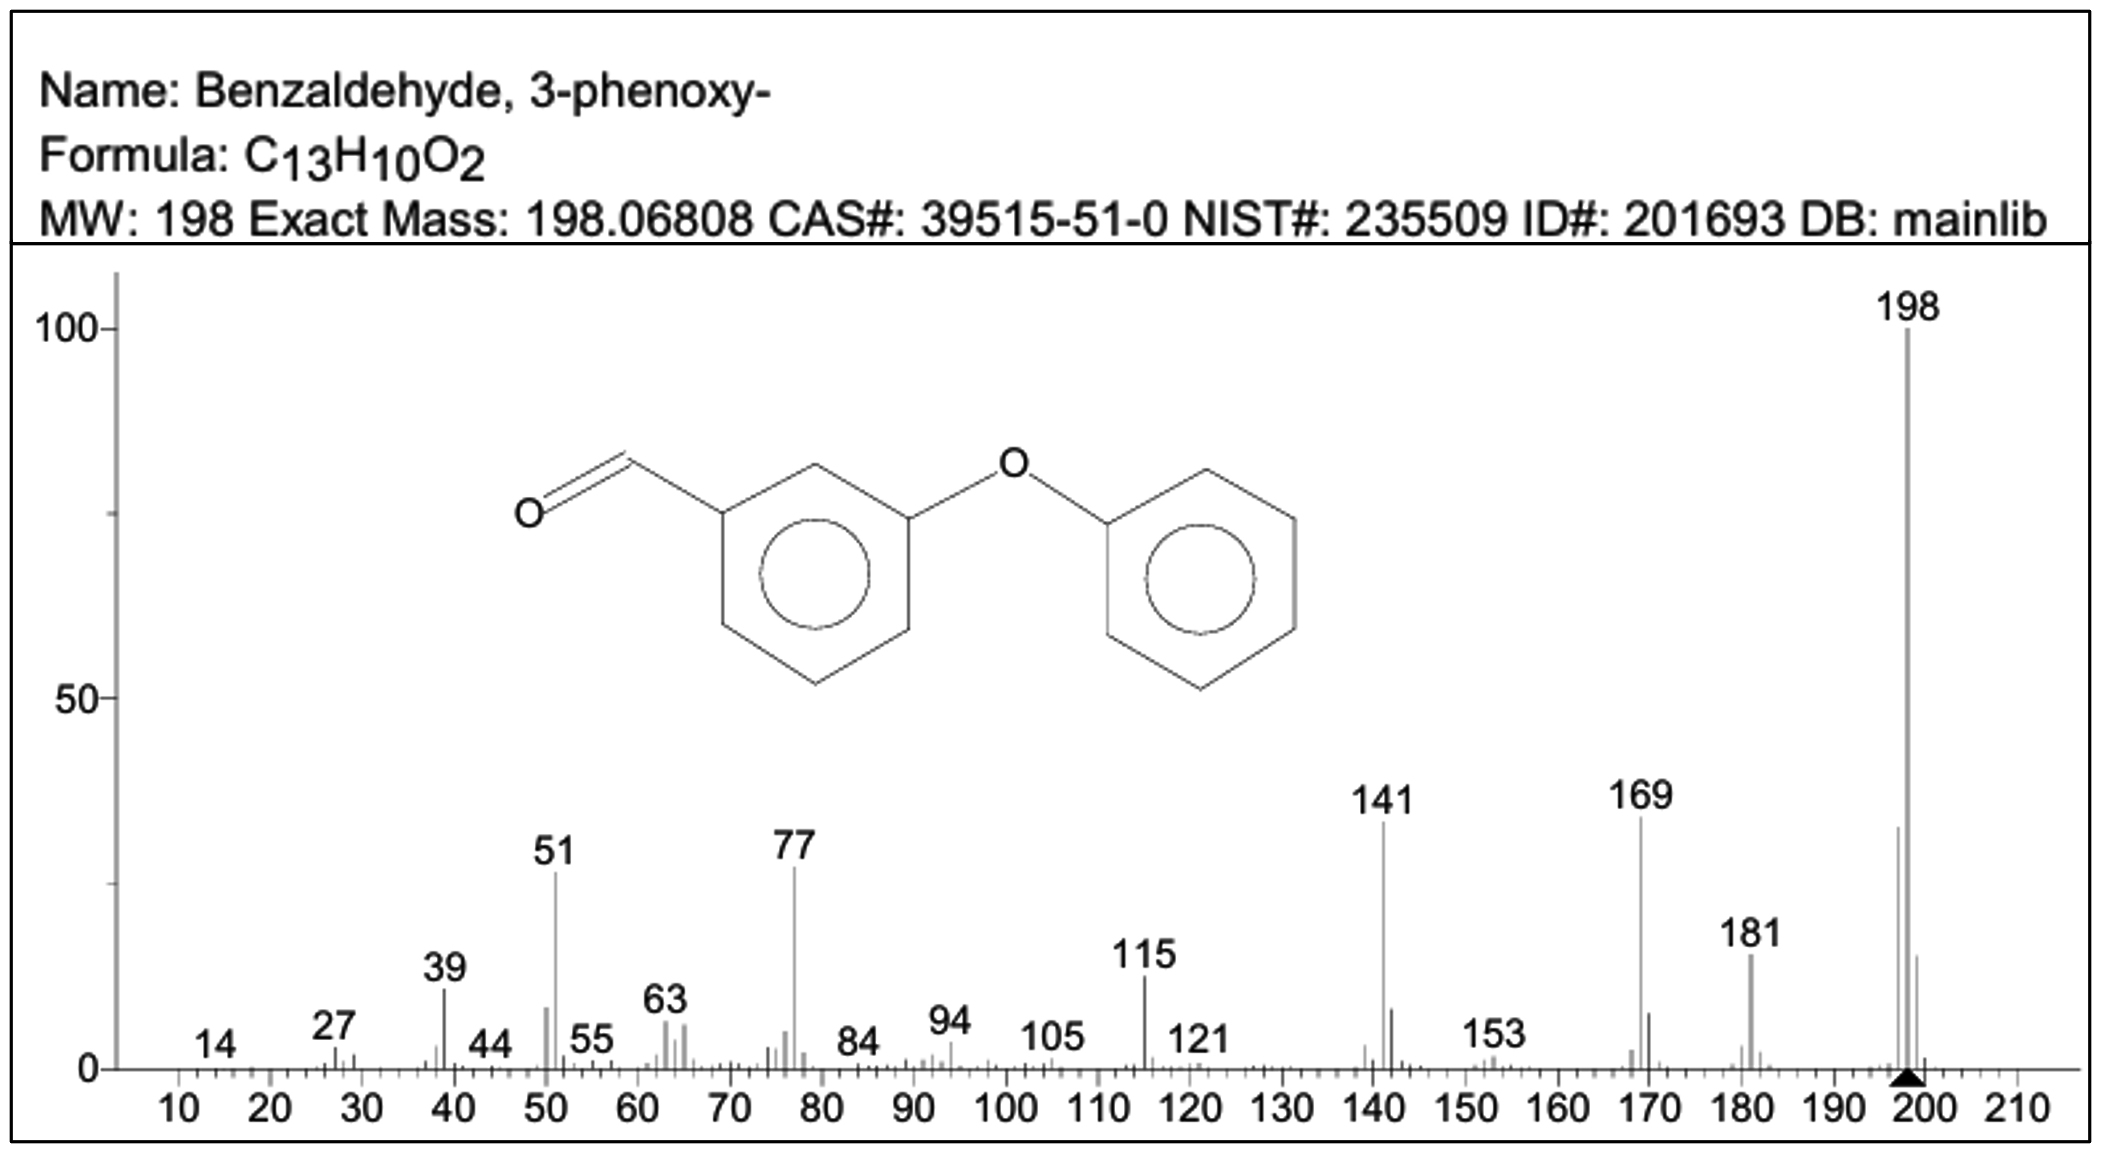
Figure 7. GC-MS spectrum of 3-phenoxybenzaldehyde showing the molecular ion peak at m/z 198. In the spectra x-axis represents m/z ratio and y-axis represents relative abundance
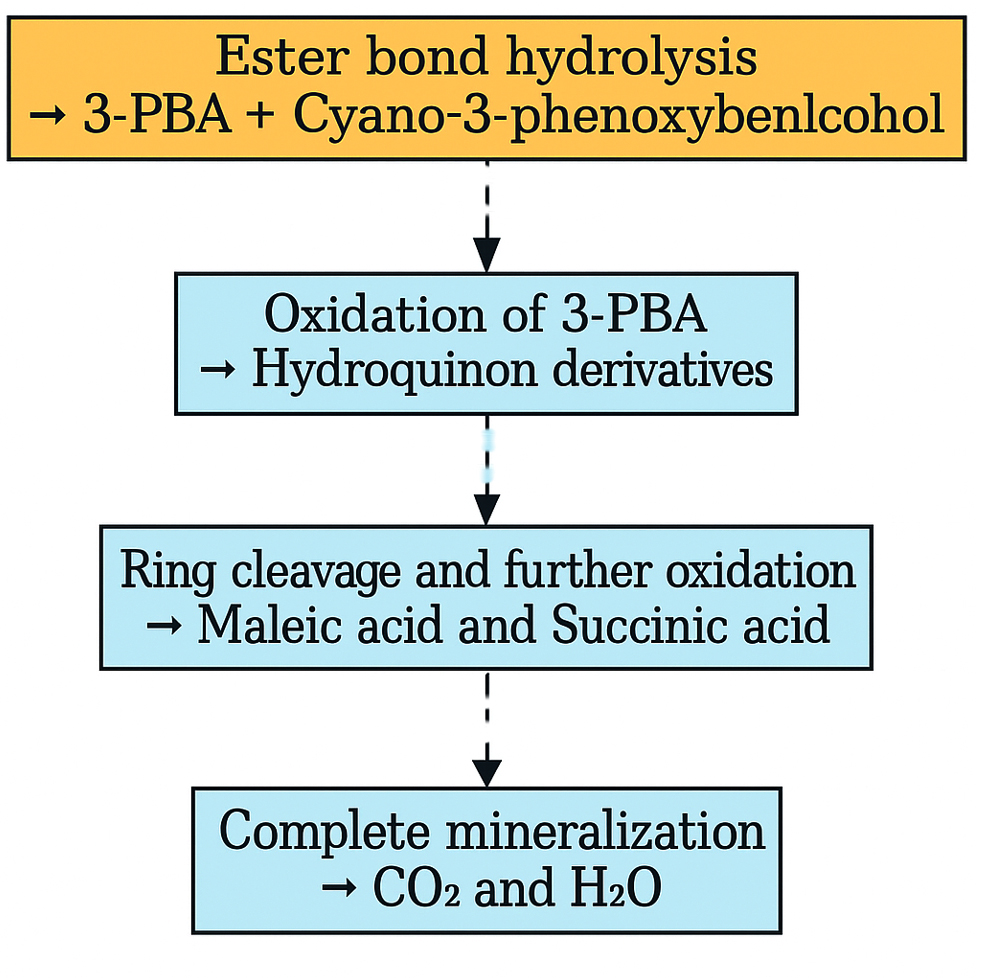
Figure 8. Flowchart representing proposed pathway for Cypermethrin degradation by Azotobacter chroococcum 76A. Experimentally confirmed steps are marked with solid arrows and proposed steps with dashed arrows
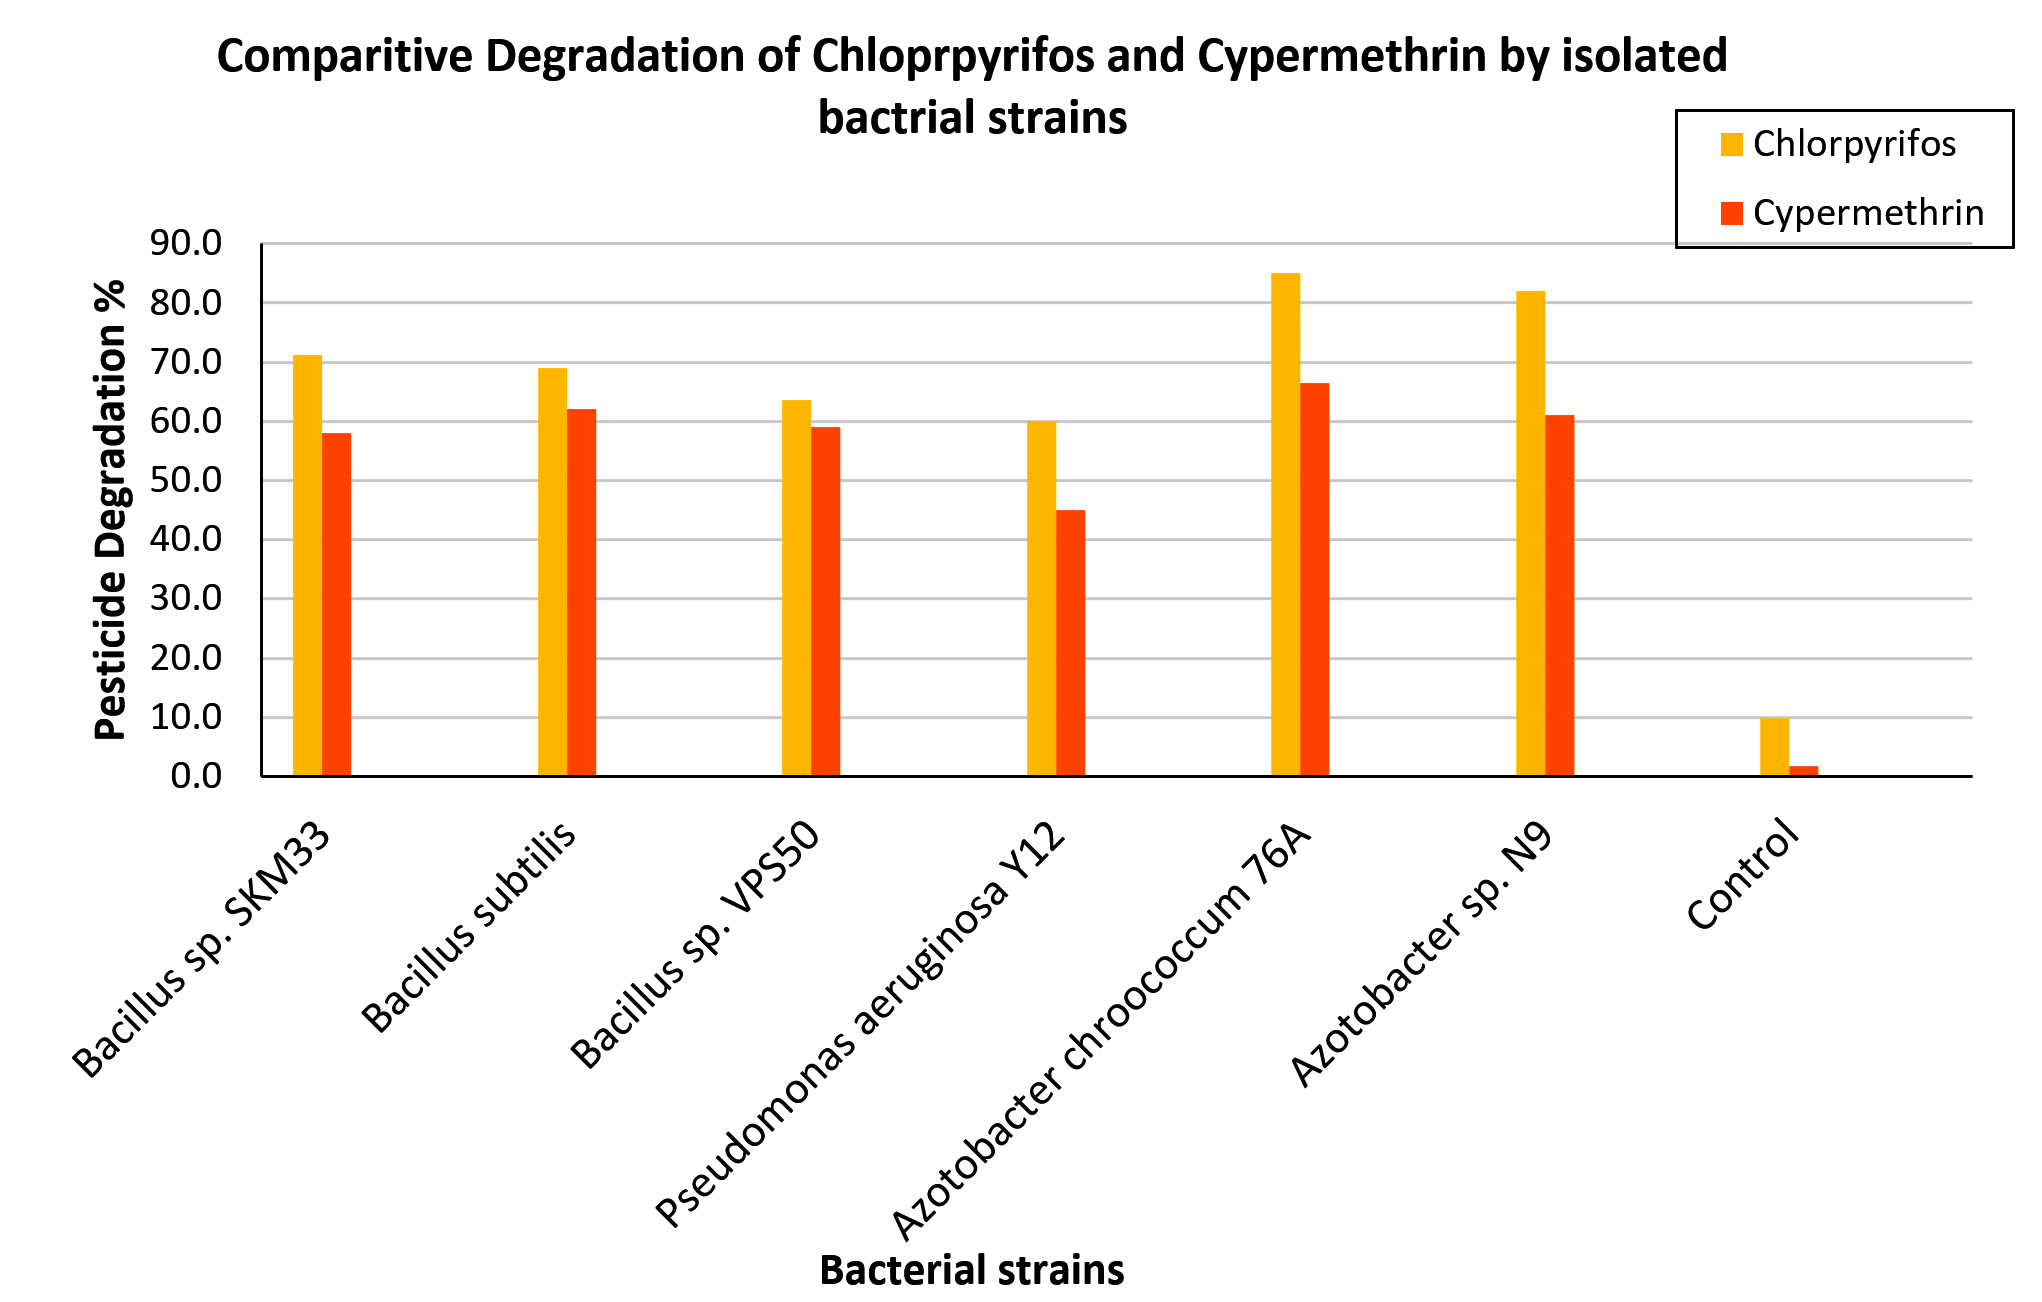
Figure 9. Degradation percentage of chlorpyrifos and cypermethrin by selected bacterial isolates and control on day 16 of incubation. Each bar presents the mean degradation percentage of the respective pesticide by individual bacterial strains
The comparative degradation percentages of CP and CY by all six bacterial strains, including the uninoculated control, on day 16 are depicted in the bar graph (Figure 9). For both pesticides, Azotobacter chroococcum 76A consistently demonstrated the highest biodegradation efficiency (85% CP, 68% CY), followed by Azotobacter sp. N9 (82% CP, 61% CY). The Tukey HSD test when used to compare CP and CY degradation across different bacterial strains summarized in Table 3, also provided evidence that Azotobacter chroococcum 76A significantly differs from other strains in degrading both pesticides. The two Azotobacter isolates outperformed the Bacillus and Pseudomonas strains, likely because of their potent plasmid-encoded hydrolases and oxidases that facilitate rapid hydrolysis and downstream metabolism. These results highlight the potential of Azotobacter strains for effective bioremediation of organophosphorus and pyrethroid contaminants. The results of this study also indicated that pesticide degradation by the isolated strains occurred through direct utilization rather than co-metabolism. This finding is supported by the use of a MSM lacking alternative carbon sources, which ensures that the pesticide serves as the sole or primary source of carbon and energy.
Table (3):
Represents the summary of the Tukey HSD comparisons for both Chlorpyrifos (CP) and Cypermethrin (CY) degradation across strains. Mean difference value includes the difference in mean degradation values between the two strains for a particular pesticide and p-value <0.05 indicates that the difference between two strains is statistically significant
| Pesticides | Bacterial Strain Pair | Mean Difference (%) | p-value | Significance |
|---|---|---|---|---|
| Chlorpyrifos (CP) | Azotobacter chroococcum 76A vs Azotobacter sp. N9 | 3.0 | 0.001 | Yes |
| Azotobacter chroococcum 76A vs Bacillus sp. SKM33 | 13.8 | 0.0001 | Yes | |
| Azotobacter chroococcum 76A vs Bacillus subtilis | 16.0 | 0.0001 | Yes | |
| Azotobacter chroococcum 76A vs Bacillus sp. VPS50 | 21.4 | 0.0001 | Yes | |
| Azotobacter chroococcum 76A vs Pseudomonas aeruginosa Y12 | 25.0 | 0.0001 | Yes | |
| Azotobacter chroococcum 76A vs Control | 75.2 | 0.0001 | Yes | |
| Cypermethrin (CY) | Azotobacter chroococcum 76A vs Azotobacter sp. N9 | 7.0 | 0.002 | Yes |
| Azotobacter chroococcum 76A vs Bacillus sp. SKM33 | 22.0 | 0.0001 | Yes | |
| Azotobacter chroococcum 76A vs Bacillus subtilis | 25.0 | 0.0001 | Yes | |
| Azotobacter chroococcum 76A vs Bacillus sp. VPS50 | 27.0 | 0.0001 | Yes | |
| Azotobacter chroococcum 76A vs Pseudomonas aeruginosa Y12 | 9.0 | 0.005 | Yes | |
| Azotobacter chroococcum 76A vs Control | 75.2 | 0.0001 | Yes |
The present study emphasizes the biodegradation potential of six phyllosphere-associated microbial isolates for two widely applied pesticides, CP and CY. Most studies have isolated pesticide-degrading bacteria from soil and water, whereas the phyllosphere, which is an underexplored habitat, is the niche of naturally selected degraders. Among the tested strains, Azotobacter chroococcum 76A exhibited the highest degradation efficiency of both compounds. The degradation kinetics, supported by GC-MS/MS analysis, revealed key intermediates including TCP, chloropyridinone, and 3-PBA, which were further broken down into simpler, non-toxic organic acids and putatively mineralized to CO2 and H2O.
These findings suggest that Azotobacter chroococcum 76A has a substantial potential for integration into bioremediation strategies aimed at detoxifying pesticide-contaminated environments. These bacteria are already plant-associated, indicating that they are more eco-friendly. Furthermore, the elucidated metabolic pathways provided valuable insights into the microbial degradation mechanisms of organophosphate and pyrethroid pesticides, offering a foundation for future research in environmental biotechnology and sustainable pest management. Introducing this bacterial strain back into the field did not disturb the natural microbial community, which is important for sustainable agriculture. Azotobacter chroococcum is a nitrogen-fixing bacterium that could be a versatile candidate for inclusion in the microbial consortia used in bioaugmentation because of its ability to degrade pesticides and enrich plant nutrients. However, field-scale validation and biosafety assessments under regulatory guidelines (e.g., CPCB and MoEFCC in India) are needed. Future studies should prioritize comprehensive genomic and transcriptomic analyses of Azotobacter strains to provide deeper insights into the specific metabolic enzymes responsible for biodegradation and the genetic basis of their degradation capabilities.
ACKNOWLEDGMENTS
The authors express their sincere gratitude to the Instrumentation lab and Microbiology Lab, Shriram Institute for Industrial research, Delhi, for providing laboratory facilities for the operation of GC-MS/MS instrument and for the culturing of microbial cultures along with technical assistance for the research work involved in preparation of this article, for which it is assigned the manuscript number SRI-MS#20250421-01. The authors are also extremely grateful to the Director, Dr. Mukul Das, Shriram Institute for Industrial Research, Delhi, for his valuable guidance and continuous support throughout the course of this research work.
CONFLICT OF INTEREST
The authors declare that there is no conflict of interest.
AUTHORS’ CONTRIBUTION
SS conceptualized and designed the study. SC performed the experiments. BB supervised the experiments. SC wrote the manuscript. BB reviewed the manuscript. All authors read and approved the final manuscript for publication.
FUNDING
None.
DATA AVAILABILITY
All datasets generated or analyzed during this study are included in the manuscript.
ETHICS STATEMENT
Not applicable.
- Bashir I, War AF, Rafiq I, Reshi ZA, Rashid I, Shouche YS. Phyllosphere microbiome: Diversity and functions. Microbiol Res. 2022;254:126888.
Crossref - Liu H, Brettell LE, Singh B. Linking the Phyllosphere Microbiome to Plant Health. Trends Plant Sci. 2020;25(9):841-844.
Crossref - De Mandal S, Jeon J. Phyllosphere Microbiome in Plant Health and Disease. Plants. 2023;12(19):3481.
Crossref - Perreault R, Laforest-Lapointe I. Plant-microbe interactions in the phyllosphere: facing challenges of the Anthropocene. ISME J. 2022;16(2):339-345
- Trivedi P, Batista BD, Bazany KE, Singh BK. Plant–microbiome interactions under a changing world: responses, consequences, and perspectives. New Phytol. 2022;234(6):1951-1959
Crossref - Ning J, Bai Z, Gang G, et al. Functional assembly of bacterial communities with activity for the biodegradation of an organophosphorus pesticide in the rape phyllosphere. FEMS Microbiol Lett. 2010;306(2):135-143.
Crossref - Kucharska K, Wachowska U, Czaplicki S. Wheat phyllosphere yeasts degrade propiconazole. BMC Microbiol. 2020;20(1):242.
Crossref - Chia XK, Hadibarata T, Kristanti RA, Jusoh MNH, Tan IS, Foo HCY. The function of microbial enzymes in breaking down soil contaminated with pesticides: a review. Bioprocess Biosyst Eng. 2024;47(5):597-620.
Crossref - Tudi M, Ruan HD, Wang L, et al. Agriculture development, pesticide application and its impact on the environment. Int. J. Environ. Res. Public Health. 2021;18(3):1112.
Crossref - Kumar A, Bhople BS, Jeganathan J. Balancing food security and environmental health: the dual challenge of pesticide use in India. Environ Sci Pollut Res. 32(9):4949-4956
Crossref - Jayasekara UG, Nabila B, Kristanti RA, et al. Eco-Friendly Strategies for Pesticide Removal: Biotechnological and Microbial Approaches. Tropical Environment, Biology, and Technology. 2025;3(1):11-24.
Crossref - Lourthuraj AA, Hatshan MR, Hussein DS. Biocatalytic degradation of organophosphate pesticide from the wastewater and hydrolytic enzyme properties of consortium isolated from the pesticide contaminated water. Environmental Research. 2021;205:112553.
Crossref - Ariffin F, Rahman SA. Biodegradation of carbofuran; a review. Journal of Environmental Microbiology and Toxicology. 2020; 8(1):50-57.
Crossref - Singh BK, Walker A. Microbial degradation of organophosphorus compounds. FEMS Microbiol Rev. 2006;30(3):428-471.
Crossref - Narayanan M, Kumarasamy S, Ranganathan M, Kandasamy S, Kandasamy G, Gnanavel K. Enzyme and metabolites attained in degradation of chemical pesticides ß Cypermethrin by Bacillus cereus. Materials Today Proceedings. 2020;33:3640-3645.
Crossref - Abu-Tahon MA, Housseiny MM, Aboelmagd HI, et al. A holistic perspective on the efficiency of microbial enzymes in bioremediation process: Mechanism and challenges: A review. Int J Biol Macromol. 2025;308 (Pt 2):142278.
Crossref - Nolvachai Y, Kulsing C, Marriott PJ. Pesticides Analysis: Advantages of increased dimensionality in gas chromatography and mass spectrometry. Critical Reviews in Environmental Science and Technology. 2015;45(19):2135-2173.
Crossref - Ramírez JRG, Muñoz LAI, Balagurusamy N, Ramírez JEF, Hernández LA, Campos JC. Microbiology and biochemistry of Pesticides Biodegradation. Int. J. Mol. Sci. 2023; 24(21):15969.
Crossref - Das S, Dash HR. Microbial bioremediation. In: Elsevier eBooks. ; 2014:1-21.
Crossref - Chaudhary S, Singha D, Bhat B, Sharda S. Screening and comparative analysis of pesticide – microbe dynamics from phyllosphere of okra and eggplant. J Microbiol Biotechnol Food Sci. 2024;14(4):e11332.
Crossref - Nunes PSO, Lacerda-Junior GV, Mascarin GM, et al. Microbial consortia of biological products: Do they have a future? Biol Control. 2024;188:105439.
Crossref - El-Gawad HA. Validation method of organochlorine pesticides residues in water using gas chromatography-quadruple mass. Water Sci. 2016;30(2):1-7.
Crossref - Lo CC. Effect of pesticides on soil microbial community. J Environ Sci Health B. 2010; 45(5):348-359.
Crossref - Pankaj N, Sharma A, Gangola S, Khati P, Kumar G, Srivastava A. Novel pathway of cypermethrin biodegradation in a Bacillus sp. strain SG2 isolated from cypermethrin-contaminated agriculture field. 3 Biotech. 2016; 6(1).
Crossref - Hernández F, Cervera MI, Portolés T, Beltrán J, Pitarch E. The role of GC-MS/MS with triple quadrupole in pesticide residue analysis in food and the environment. Anal Methods. 2013;5(21):5875-5894.
Crossref - Racke KD. Environmental fate of chlorpyrifos. Rev Environ Contam Toxicol. 1993;131:1-150.
Crossref - Singh BK, Walker A, Morgan JAW, Wright DJ. Effects of soil pH on the biodegradation of chlorpyrifos and isolation of a chlorpyrifos-degrading bacterium. Appl Environ Microbiol. 2003;69(9):5198-5206.
Crossref - Li J, Liu J, Shen W, et al. Isolation and characterization of 3,5,6-trichloro-2-pyridinol-degrading Ralstonia sp. strain T6. Bioresour Technol. 2010;101(19):7479-7483.
- Fang H, Yu YL, Wang X, Shan M, Wu XM, Yu JQ. Dissipation of chlorpyrifos in pakchoi-vegetated soil in a greenhouse. J Environ Sci (China). 2006;18(4):760-764
- Liu ZY, Chen X, Shi Y, Su ZC. Bacterial Degradation of Chlorpyrifos by Bacillus cereus. Advanced Materials Research. 2011; 356-360:676-680.
Crossref - Chen S, Liu C, Peng C, Liu H, Hu M, Zhong G. Biodegradation of chlorpyrifos and its hydrolysis product 3,5,6-trichloro-2-pyridinol by a new fungal strain Cladosporium cladosporioides Hu-01. PLoS One. 2012;7(10):e47205.
Crossref - Matsumura F. Toxicology of Insecticides. 2nd ed. Plenum Press; 1985.
- Xu G, Zheng W, Li Y, Wang S, Zhang J, Yan Y. Biodegradation of chlorpyrifos and 3,5,6-trichloro-2-pyridinol by a newly isolated Paracoccus sp. strain TRP. International Biodeterioration & Biodegradation. 2008; 62(1):51-56.
Crossref
.
© The Author(s) 2025. Open Access. This article is distributed under the terms of the Creative Commons Attribution 4.0 International License which permits unrestricted use, sharing, distribution, and reproduction in any medium, provided you give appropriate credit to the original author(s) and the source, provide a link to the Creative Commons license, and indicate if changes were made.