

ISSN: 0973-7510
E-ISSN: 2581-690X
Biosurfactants are tensio-active, amphipathic biomolecules, which can reduce the surface tension of liquids. Synthetic surfactants are predominantly toxic, resistant to degradation, and exhibit narrow range of activity, whereas surface-active biosurfactants are non-toxic and biodegradable. Biosurfactants from halophilic microorganisms have significant attributes of being able to work under diverse spectrum of salt concentration, pH and temperature. This research was focussed on biosurfactant producing halophilic organism from a saline lake and the production of biosurfactant. Out of 32 bacterial isolates from saline water, and 18 bacterial isolates from saline soil, only the isolates growing on inorganic salt media amended by adding 3% NaCl and 1% Kerosene as carbon source and an inducer and passing the two stages of screening; SH-6 isolate was found to be a relatively better isolate (oil displacement zone = 2.96 ± 0.05 cm, E24= 64.66 ± 0.57%, 47.33 ± 0.57% reduction in surface tension). Using 16S rRNA technique along with the phylogenetic analysis, a moderate halophilic strain SH-6 (optimum growth at 3% NaCl) was identified to be Pseudomonas aeruginosa (NCBI Accession number PP567277). Acid precipitation along with solvent-based extraction (using non-polar Chloroform and polar Methanol) was adopted to obtain biosurfactant with a resultant yield of 0.31 ± 0.01 g %. With Rhamnolipid R-90 (90% pure) as a standard reference and using primary chromatographic characterization like Column and Thin Layer chromatography, followed by HPLC and HPTLC the biosurfactant was found to be similar to Rhamnolipid. There is a future prospect to optimize Rhamnolipid production and investigate the applications in bioremediation, agriculture.
Halophilic, Biosurfactant, Sodium Chloride, Rhamnolipid
Synthetic substances that can reduce the tensio-active force at the surface of liquids are surfactants.1 They can form self-assembled clusters known as micelles in a system composed of water or oil and have an immense role in the decontamination of contaminated sites. Chemical surfactants are synthetic in nature, whereas biosurfactants are synthesized by living organisms using a variety of agricultural and other raw materials. Synthetic surfactants are toxic, non-biodegradable and limited in their action in terms of temperature and pH, whereas biosurfactants are relatively less toxic and biodegradable. Biosurfactants are biological entities with a domain having an affinity for water and a domain that repels water, and the capability to exert action on the surface. They could either be prepared and secreted or could exist being section of the cytoplasmic membrane by many living organisms which includes bacteria, fungi and yeasts.2,3 Biosurfactants are secondary metabolites and are significant to the organism synthesizing them, they regulate the route of nutrient transport; monitor the host-microbe interaction and quorum sensing mechanisms.4 Biosurfactants like chemical surfactants decrease the tensio-active force at the surface of liquids and are commercially significant.
Biosurfactants possess both water-attracting and repelling functional groups in their structure, this aspect implies there exist two different synthetic pathways for each group. The water-repelling structural domain may be a fatty acid with a hydroxy group whereas water-attracting structural part may be an alcohol, a carboxylic acid group, carbohydrate group, phosphate group, amino acid or a cyclic peptide.
For the biosynthesis of amphiphilic biosurfactants, four principal possibilities have been stated:5
- De novo mode of biosynthesis via independent pathways for both the water-attracting and water-repelling moieties.
- De novo mode of biosynthesis for the hydrophilic moiety, whereas inducible mode for the biosynthesis of the hydrophobic moiety.
- De novo mode of biosynthesis for the water-repelling moiety, whereas the substrate governs the formation of the water-attracting moiety.
- Carbon substrate that is incorporated in the media governs the synthesis of both the residues.
The lipid composition of halophiles is unique with respect to phytanyl glycerol which may influence tensio-active force at the surface. With respect to organism’s nature, salinity can influence biosurfactant. For moderate halophilic organisms, optimum concentration of salt can stabilize the biosurfactant, facilitating its secretion and enhancing the surface activity. In the current scenario of global industrialization, chemicals have gained dominance in life. Sustainable development in its real sense is to be assessed and emphasized. There are several technical and chemical-based techniques for remediation of a contaminated site, but every technique has its merits and demerits.6 In most of the cases, the conditions at the polluted sites are saline and require a safer eco-friendly approach for remediation. Similarly, the mundane methods adopted for extraction and processing of oil from natural resources are also required to be reviewed and investigated to search for a relatively better sustainable method.
There has been research on biosurfactants from bacterial and fungal organisms, but relatively less research has been done for halophilic organisms. Relatively lesser investigation has been undertaken on biosurfactant production from halophiles, their optimization, characterization and applications. Halophiles are living organisms that require saline conditions for the optimum growth. They have evolved to balance the external osmotic pressure and resist the denaturing impact of salts.7 Slight halophiles can grow with 1-3% concentration of sodium chloride (NaCl), whereas halophiles that are moderate exhibit growth in an optimum manner between 3-15% concentration of NaCl and extreme halophilic microbial cells exhibit better growth in a condition with greater than 15% NaCl.8 Hence, there is a need to explore saline contaminated habitats for halophilic organisms capable of producing biosurfactants hypothesizing on their ability to perform under higher levels of salinity, temperature and pH which are predominant at contaminated sites. In this research, an attempt was made to enrich water and soil samples from saline contaminated lake ecosystem, isolate, screen biosurfactant producing halophilic organisms, produce and characterize the biosurfactant. Phospholipids, glycolipids and lipopeptides possess lower molecular mass. Higher molecular weight biosurfactants encompass proteins, polysaccharides with a bound lipid, polysaccharides having hydrophilic and hydrophobic parts, proteins with a bound lipid or unique combination of these biopolymers.9 Halophilic biosurfactants have immense applications in diverse domains, which includes augmented extraction of oil and bioremediation, cosmetics, food bioprocessing, agriculture and pharmaceuticals.10 Investigation of kinetic parameters and modelling of production parameters would enable to explore the strategies for economically viable production process of biosurfactant.11
Enrichment of halophilic organisms from contaminated saline lake water and soil samples
To obtain halophilic biosurfactant producing organisms, first halophilic organisms were enriched and isolated, followed by enrichment and screening of biosurfactant producers. The emphasis was on contaminated saline lake ecosystems. Sterile containers were used to collect saline lake water samples and soil samples in its vicinity. Samples of water were collected in sterile glassware and greasy sticky soil samples near the track of salt trollies were collected in sterile bottles and petri-dishes. A total of 20 samples (including water and soil) were taken from diverse locations of Sambhar Lake, near Sambhar salt works, Rajasthan, India.12
The following broth media with slight modifications were amended with 3% NaCl (3-5% NaCl for moderate halophile).13 A pH meter monitored the medium’s pH (Contech instruments Ltd. Mumbai). Broth was subjected to agitation using a shaker (Classic Scientific) 100 (rpm) at 37 °C for a duration of 7 days.
The pH value at the beginning was set at 7.2 for the following media, incubated for a duration of 1 week at a temperature of 37 °C.
- Sterile Nutrient broth (NB)
- Sterile Sehgal-Gibbons (SG) broth14,15
- Sterile Halophilic broth14-16
- Sterile Zobell broth pH 7.617
A 1 mL volume of saline lake water sample was aseptically inoculated into 100 mL of above-mentioned media and kept on a shaker (100 rpm) at 37 °C for 7 days. Similarly, a suspension consisting of 1 g of soil and 10 mL saline was subjected to vortex for a minute, and 1 mL of the supernatant was inoculated into 100 mL of above-mentioned media. After 7 days of incubation, second round of enrichment was undertaken with 10 mL inoculum aseptically transferred to the fresh sterile broth respectively.14,15 Procedure was repeated until satisfactory growth was obtained.
After the second round of enrichment in above mentioned media the broth sample was subjected to serial 10-fold dilution up to 10-10 using sterile saline pH (7.4) and 0.1 mL was plated on respective solid media with the similar composition. Along with serial dilution, direct isolation by T-streak method was also performed to get isolated colonies. The incubation of plates was undertaken at a temperature value of 37 °C, for a duration of 7 days for bacteria and number of isolates were obtained.
These different types of halophilic organisms may or may not synthesize biosurfactants, so now they were subjected to enrichment in inorganic mineral salt media seeded with NaCl and an inducer. Various types of mineral salt media were evaluated.18 N-MSM19 was found to be relatively better and had relatively lesser precipitate formation.
Enrichment and isolation of the biosurfactant producing halophilic microorganisms
From enrichment experiments for moderate halophiles, bacterial isolates were obtained. Halophiles were enriched in sterile Bushnell-Haas N-MSM which was amended with 3% NaCl, and a hydrocarbon inducer in the form of 1 % (v/v) Kerosene.19 With an objective to supply minimum carbon in the initial stages for survival 0.1% glucose was added.17
Different inducers like Kerosene, Coconut oil, Olive oil and Diesel were also evaluated. The different types of oils were initially sterilized by dry-heat method at 140 °C for 1 h for three consecutive days. After 7 days of incubation, second round of enrichment was undertaken with 10 mL inoculum aseptically transferred to the new sterile broth respectively. Broth was observed for turbidity and foam formation, which served as primary indicators for biosurfactant production. After the second round of enrichment, the bacterial broth sample was subjected to serial 10-fold dilution up to 10-10 using sterile saline pH-7.4 and 0.1 mL was streaked on sterile solid media with similar conditions. Direct isolation by T-streak approach was also undertaken to obtain isolated colonies. The duration of incubation of plates was of 7 days at a temperature value of 37 °C and number of prospective producers of biosurfactant isolates were counted. Those isolates that were able to grow on inorganic mineral salt media amended with 3% NaCl and 1% Kerosene inducer, were selected for further screening.
Initial screening of the capability of the isolate for utilization of a hydrocarbon inducer
Preparation of inoculum for the screening tests
From the initial moderately halophilic isolates, bacterial isolates were able to grow on N-MSM.19 They were prospective biosurfactant producing moderately halophilic organisms. Different types of colonies exhibiting different morphological features were selected for further investigation. For preservation of cultures, sterile Nutrient Agar (Himedia, Mumbai) slants with 3% NaCl were used and stored at 4 °C.
To prepare an inoculum to seed the production flask, each isolate was inoculated in 50 mL of Luria Bertani medium incubated for 18 h until a cell density of 0.5 O.D.600 nm was obtained using the McFarland standard. A 2 mL of seed inoculum was aseptically inoculated into 100 mL of a modified N-MSM.
After 7 days-time period, the Erlenmeyer flask was observed for initial changes like turbidity (indicating growth) and foam formation (indicating emulsification of inducer) both changes served as primary indicators of biosurfactant formation. In this initial enrichment, the purpose was to enrich hydrocarbon degraders, with this intention no other carbon source was additionally added and hydrocarbon served as sole source of carbon as well as an inducer. Enriched broth was centrifuged at 10,000 g for a duration of 20 min and further screening procedures were employed to investigate the biosurfactant producing ability using the supernatant.
The shortlisted bacterial isolates were also sub-cultured on sterile NA slants with 3% NaCl and stored at 4 °C.
Methods adopted for screening of biosurfactant producers
Inoculum for screening tests
In this research, bacterial isolates maintained on NA slants were sub-cultured and a homogenous suspension was used for various screening tests.
Initial validation of the screening methods
With an objective to validate the screening results, initially all the primary level tests for stage I screening were performed using an abiotic positive control in the form of 0.1% standard synthetic anionic detergent Sodium Dodecyl Sulphate (SDS). Distilled water served as a negative control. All observations were taken in triplicates. The experimental values were calculated as an average with standard deviation (SD). For data analysis and validation, analysis of variance (ANOVA) test for a single factor was used to calculate the p-value. Different tests parameters were assessed as the dependent variables and the bacterial isolates were independent variables.
Also in the initial screening, after the validation, along with the isolates two biosurfactant producing standard strains (SS1) Bacillus sp. MTCC 2473 (SS2) and Pseudomonas aeruginosa MTCC 10636 (SS2) were procured from CSIR Institute of Microbial Technology, Chandigarh, India, assessed simultaneously and served as biotic positive controls.
Stage I screening
Tilted glass slide (TGS) test
Each isolate was initially subjected to a tilted glass slide test where a colony of an isolate was brought in contact with saline sample at one border of a sterile slide, and the saline drop was observed, if it begins dipping down it could be considered as a positive result.20
Haemolytic test
Each isolate was investigated for biosurfactant production by inoculating the suspension of the isolate from NA slant on sterile superimposed blood agar media (SIBA). After incubation for 24 h at 37 °C if the colony had clearance in its vicinity, it indicated haemolysis of the red-blood cell further indicating biosurfactant production.21,22
Parafilm M test
Each isolate was subjected to an initial rapid primary screening step for the producer of biosurfactant. The supernatant drop was bought in contact with a Parafilm M sheet and compared with a drop of water placed on the same sheet, if its diameter is greater than water, it could be considered as a positive result.23 The diameter of the drop (cm) could be taken.
Lipolytic test
For this test, sterile Gorodkowa’s Tributyrin media was utilized to assess lipase activity of the isolates. Each isolate was cultivated at a temperature of 30 °C for 24-48 h. Plates were assessed for a clearance in the vicinity of the growth.24
Oil-drop-collapse method
To perform this test, 2 µL of machine oil was loaded in one well on the 96 well microtiter plate and permitted to equilibrate for 1 h at 30 °C. After this step, the well with a 5 µL drop of supernatant was observed for 1 min to know whether the drop remains intact or collapses.25 If oil drop changes to a flat drop it could be considered as an indicative of biosurfactant production. If the drop remains intact as it is i.e. beaded, then it could be considered as a negative result. Collapse of the drop is indicative of a positive test.26
With an objective to tabulate the results, the observations were noted as ‘+’ to ‘+++’ indicating partial to complete oil spreading; where ‘+++’ indicates flat drop after 1 min, ‘++’ indicates relatively less flat drop after 1 min, and ‘+’ indicates relatively negligible flat drop as compared to the negative control.
Oil displacement test
This test was performed in a petri dish containing distilled water (50 mL). For this test, 20 µL Soybean oil mixed with basic fuchsin (just to make the observation clear and visible) was added, followed by adding the culture suspension (10 µL) on oil layer. Diameter of oil displacement zone was evaluated.27
Stage II screening
CTAB agar method
In order to perform the test, the initial media N-MSM was amended with Cetyl trimethyl ammonium bromide CTAB (0.2 g/L), to this Methylene blue stain was added (0.005 g/L).19 Plates were incubated and observed for blue concentric rings in the vicinity of a colony after 48-72 h at 37 °C. The bluish halo could be considered as an indicator of an anionic surfactant.28
BATH test
For this test the prospective isolates were cultivated in modified N-MSM in the presence of an inducer. After the appearance of visible turbidity, broth was centrifuged for 10 min at 10,000 g and the pellet was obtained. After giving saline washings, the cell suspension was utilized for the BATH test. Cell suspension with a volume of 2 mL was treated with n-hexane (100 µL) and the preparation was vortexed for a minute and allowed to settle under static conditions at 30 °C for 1 h. After the duration of 1 h two layers were formed, and the aqueous layer was pooled. Using spectrophotometer in visible range, the factor evaluated was absorbance at a wavelength of 600 nm. In order to estimate the percentage of the hydrophobicity the ratio of the absorbance of suspension after and before incubation was subtracted from 1 and multiplied by 100.29
Measurement of emulsification index
For this test, a volume of 2 mL of Kerosene and 2 mL of filtrate was mixed and vortexed for a minute. It was observed for formation of an emulsion and its maintenance for 24 h. For calculation purpose, emulsion height was divided by the mixture’s complete height and the answer obtained was multiplied by 100.30
Determination of surface tension
Evaluation of surface tension at periodic intervals is crucial in biosurfactant investigation.31 Isolates were cultured in N-MSM amended with an appropriate inducer and incubated on the shaker (150 rpm) at 37 °C for 5 days. As a control for comparison, uninoculated N-MSM with oil as abiotic control was maintained for initial measurement. Du-Nouy ring Tensiometer (manufactured by Ganga Scientific, Kolkata), was subjected to calibration using distilled water (72 dynes/cm) and used for measurement.32 The decrease in surface tension was noted and calculated as a percentage decrease.
After the screening steps, the isolate/s showing the highest emulsification index, and reduced tensio-active force of mineral salt medium were chosen for identification studies and production of biosurfactant.
The above tests were conducted for all the isolates, and it was noted that HB-1, HB-26, SH-6, SH-7 along with few others performed relatively better, out of these isolates SH-6 consistently maintained good results so henceforth the promising isolate SH-6 was investigated further.
Identification of the promising biosurfactant producer
Gram staining
The bacterial isolate was subjected to Gram staining and the smear was observed under oil-immersion lens (100X).
Identification of the biosurfactant producing isolate
Sequencing analysis of 16S rRNA gene
Along with morphological and biochemical preliminary analysis, the further steps of the identification of the bacterial isolate SH-6 were done using partial sequencing of the 16S rRNA gene at HiMedia laboratories Pvt. Ltd., Thane.
The uncontaminated QC passed culture plate was used for colony PCR. The genomic DNA was isolated as per the standard protocol and processed further. Molecular Biology grade water (50 µL) was used as suspending medium for 1-2 well-isolated colonies selected from the plate and subjected to proper mixing, followed by incubation for 10 min at 95 °C and a brief centrifugation. The supernatant thus obtained was used as a PCR template using 16S universal primers:
16S universal primers used for bacterial isolate SH6 16S rRNA gene amplification:33
Primer working from forward: 16S27F (5′-CCAGAGTTTGATCMTGGCTCAG-3′)
Primer working from reverse: 16S1492R (5′-TACGGYTACCTTGTTACGACTT-3′)
PCR products were further purified by salt precipitation and analysed using agarose gel in order to assess PCR amplicons along with 500 bp of DNA ladder Using the approach of BDT v3.1 chemistry, purified amplicons were evaluated by cycle sequencing and then subjected to sequencing on genetic analyzer (ABI 3500 XL). With an objective to generate good quality base reads covering the target, internal primers were also incorporated to obtain near full-length sequence. BLASTN search algorithm was used for assessment of sequences against the microbial nucleotide sequence databases.
BLAST analysis was undertaken. Sequences of 16S rRNA in the form of the .ab1 trace files obtained from the sequencer were manually customized, changed into a readable file based on format of FASTA and then assembled into a sequence in a contiguous manner. After these modifications the files were exported as a FASTA file. Different software’s like Chromaslite and MEGA (Molecular Evolutionary Genetic Analysis) were explored for initial sequence-based data. For bacterial isolate, the SILVA database v138.1 was employed for database search of the assembled consensus sequence34 using the BLAST tool.35
The FASTA format of the sequence was accepted by BLASTN program. Later an appropriate bacterial and archaeal 16S rRNA database was selected in order to search for homology for the given sequence. The steps enabled in the identification of the species. Multiple sequence alignment was undertaken. Along with MEGA other software like CLUSTALW was also explored, since it is always better to validate output using two or more tools. The obtained 16S rRNA gene sequence was considered for the multiple sequence alignment by the CLUSTALW program. For the Phylogenetic analysis from the database, highest similarity 1000 hits from the beginning were obtained. From a source consisting of different taxa, ten neighbour sequences exhibiting close similarity were aligned using MUSCLE aligner.
Production of biosurfactant
Inoculum preparation
For bacterial isolate seed inoculum, 18-20 h saline culture suspension of Pseudomonas aeruginosa SH-6 was prepared. Density of the inoculum was set at 0.5 O.D.600 nm using McFarland standard. From the culture 2% v/v inoculum was used to inoculate 100 mL sterile modified N-MSM19 amended with 3% NaCl and 1% Kerosene.
Extraction and estimation of biomass
The bacterial isolate was cultivated for 6 days in the respective Mineral basal media i.e. N-MSM at 37 °C for Pseudomonas aeruginosa SH-6 to facilitate the production of biosurfactant. The flasks were incubated on shaker at 100 rpm. After incubation and centrifugation of production broth at 10,000 g for 15 min, cell pellets and crude biosurfactant supernatant were obtained. The supernatant was used to extract the biosurfactant by the technique with the use of an acid to facilitate precipitation and use of solvent to facilitate extraction. The suspended pellets were further separated by centrifugation. A temperature of 50 °C for a duration of 24-48 h was employed for drying of cell pellet. This process was continued till a stable reading of the dry weight was obtained.36
Method for extraction of biosurfactant
The bacterial biosurfactant was synthesized using N-MSM and different solvents in combination and different proportions were evaluated to obtain the best possible extraction. Taking cognizance of green chemicals and with a purpose to investigate alternative solvents, we evaluated different solvents such as non-polar Chloroform and polar Methanol in the ratio of 2:1,37 solvents such as Chloroform and Ethanol in the ratio of 2:1,38,39 solvent system comprising of Chloroform, Methanol and Water in the ratio of 10:05:07,40 Acetone-based precipitation at a low temperature,41 chilled Ethyl acetate42,43 and Dichloromethane.44
Recovery of the biosurfactant
After the respective incubation in the mineral media, the production media was centrifuged at a high speed 10,000 g for 15 min. As per the situation, the culture broth was processed either in fat tubes or Eppendorf tubes. For Eppendorf tubes cooling microfuge was operated at 10,000 g for 15 min. Initial weight of the fat tube or the Eppendorf tube was determined and used in biomass and biosurfactant dry weight calculations. Wherever applicable sterility was maintained throughout the biosurfactant extraction process. Broth was made cell-free, and it was acidified (pH 2.0). For the purpose of lowering the pH 6N HCl was used, the acidified broth was refrigerated for 18 h at 4 °C. Post cold treatment, broth was centrifuged for 15 min at 10,000 g, 0.1 NaHCO3 was used as a dissolving media for the precipitate and subjected to solvent extraction using organic solvents i.e. Chloroform:Methanol (2:1) and subjected to thorough mixing using a separatory funnel and the phases separated were stabilized. Multiple cycles of extraction were undertaken and at each step the pooled fractions from the organic phase were dried for evaporation of traces of solvents at 50 °C, and contents were subjected to treatment with water and again re-extracted using a solvent mixture. The objective behind this step was to purify the residue to a considerable degree. The organic layer had concentrated biosurfactant. With an objective to concentrate biosurfactant and recover solvents, rotary evaporator device was employed. Biosurfactant mass obtained was treated with n-Hexane in order to eliminate the unused oil.45 Crude viscous biosurfactant was treated at 50 °C for a duration of 24 h to obtain a dried mass of biosurfactant.46
After the downstream processing of the biosurfactant from the broth, the residue obtained was subjected to Column chromatography to obtain different fractions, which were then subjected to Thin-layer chromatography (TLC). Presence of biosurfactant in the sample on comparing with the standard reference Rhamnolipid R-90 (90% pure, AGAE) helped in the confirmation of the biosurfactant.
Characterization of biosurfactant
Initial detection of biosurfactant components using chromatography
Biosurfactant residue was dissolved in organic solvent and centrifuged at 10000 g for 5 min to collect the organic phase to retrieve solid crude residue for column chromatography. As per the literature47,48 rhamnolipids obtained from Pseudomonas species consists of congeners, and there could be different homologues present. Hence, column chromatography helped in separating mono-rhamnolipids, di-rhamnolipids present, if any. Later the fractions obtained were combined for further analysis as per the requirement.
Column chromatography
For silica gel-based column chromatography, chloroform was used as the dissolving medium for the residue. Loading of sample was undertaken from the column top. Washings were given to the column with 100% chloroform with an objective to eliminate any impurities, neutral lipids present if any. An attempt was made to gradually proceed from non-polar to polar in terms of the polarity of the mobile phases, hence initially a mixture of non-polar chloroform and polar methanol was adopted, and the ratio of these solvents was changed in the sequential order from 2:1 to 1:1 and finally to 1:2 (v/v) respectively. Fractions of 10 mL were collected in dilution tubes and were subjected to TLC to check the presence of congeners of rhamnolipids. A solvent system comprising of chloroform, methanol and water (65:7:2) was used for TLC.49 The first ones to elute from the column could be mono-rhamnolipids followed by di-rhamnolipids. The fractions were then combined and validated by TLC, HPLC and HPTLC analysis.
Thin-layer chromatography
Aluminium plates that were pre-coated with Silica gel (G60, F254, Merck Germany 6×3 cm) were utilized. Sample preparation was done by dissolving 0.1 g of the partially purified biosurfactant in 1 mL of analytical grade methanol. A 10 µL volume of the sample was spotted twice with intermittent drying, at a point which was on the reference line at a distance of 2 cm away from the plate’s bottom. In a similar manner, different plates were prepared to detect lipids, carbohydrates and amino acids. With an objective to detect carbohydrates, another plate was prepared for specific detection of sugars using Rhamnose (1%) prepared in distilled water, as a standard. For mobile phase, solvents i.e. Chloroform:Methanol:Acetic acid [65:10:4 (v/v/v)] were used.50 Proper precautions were taken to maintain the saturation of the vapour phases. Mobile phase was permitted to run till 75% of the plate and the developed plates were air-dried before detecting various components. Lipids were detected with the help of iodine vapour.51 A 1% Ninhydrin reagent prepared in acetone was sprayed to detect amino acid groups. Different reagents relevant to carbohydrates were used. Molish’s reagent (consisted of 5-8 drops of concentrated H2SO4 added to 10% a-Naphthol solution made in 96% ethanol)52 and Anthrone reagent (obtained by adding 1 g of Anthrone prepared in 5 mL of H2S04 to 95 mL Ethanol) was used to detect carbohydrates.53 Plates were then subjected to a temperature of 100 °C and observed until the appearance of definite spots. With an objective to detect carbohydrates and sugars respectively, the plates were assessed for pale violet and yellow spots. Brownish yellow spots for lipids and purple spots for amino acids were checked. The Rf value of sugars was calculated for further studies.
HPLC analysis of biosurfactants
HPLC analysis of the biosurfactant was undertaken at National Facility of Biopharmaceuticals (NFB) at G. N. Khalsa College, Matunga Mumbai. The biosurfactant sample was subjected to derivatization so to generate phenacyl esters. The biosurfactant obtained after processing and purification was dissolved in 100% Acetonitrile having 2-bromoacetophenone and triethylamine in the molar ratio (1:4:2). The mixture was then kept in a Sonicator for 1 h at 60 °C. In this system p-bromophenacyl esters were then injected into the column of HPLC for the qualitative detection of Rhamnolipid. As a standard, Rhamnolipid R-90 was used, and the test samples were diluted 1:20 in 10% Acetonitrile. The mobile phase consisted of a gradient having phase A: Water and phase B: Acetonitrile, 10% to 60% of mobile phase B. A reverse phase C18 column having a dimension 150 x 4.6 mm at 40 °C was used. A sample volume of 20 µL was injected with a flowrate was 0.8 mL/min, a runtime of 30 min wavelength and was evaluated at 272 nm.3
Separation of components of biosurfactant and confirmation of results of TLC by HPTLC
Biosurfactant obtained after acid precipitation and solvent extraction was dried and used for chromatographic analysis. An amount of 0.1 g was dissolved in HPTLC grade Methanol (1 mL) used as a solvent and its components were used for analysis in automated HPTLC system (CAMAG, Switzerland) at Anchrom Laboratory, Mulund (East) Mumbai. Earlier attempts were also made by dissolving test sample in HPTLC grade Chloroform. A 200.0 x 100.0 mm plate (1.05554.0001) (Merck Darmstadt, Germany) with silica gel 60 F254 was a stationary phase. The test samples (5,10,15 µL) were spotted on this plate using an automated sampler (LINOMAT V A, S/N: 080222). The developing solvent system used as a mobile phase comprised of Chloroform: Methanol:Water (6.5:2.5:0.4 v/v).50 Mobile phase saturated the CAMAG twin trough glass tank (TTC 20 x 10) in 20 minutes. Different sample volumes comprising of standard Rhamnolipid (1 mg/mL) along with samples (SH-6 glycerol based rhamnolipid, SH-6 glucose-based rhamnolipid and HF-1 olive oil-based rhamnolipid-fungal isolate) in the range of 2-15 µL were applied with the help of micro syringe using a Linomat V band spotter from CAMAG Switzerland. Solvent phase was allowed to run up to 70.0 mm length of the solvent front and plates were kept at room temperature for 3 min for air-drying. An automatic developing chamber was used for the development of plates It was then derivatized using Naphthol reagent (2.5 g of Naphthol was weighed and taken in 500 mL glass beaker, to this 12.5 mL of concentrated sulphuric acid was added and 238 mL of 95% ethanol was added) and the spots were detected after heating for 2 min at 105 °C. Plates were then scanned using a scanner (4A, S/N:170422), evaluated using TLC visualizer (2, S/N:290203) under visible, UV (254 and 366 nm) light and there was a provision for image documentation.54
Enrichment and isolation of halophilic organisms
Water and soil samples from various saline lake locations were collected in sterile dilution tubes, petri dishes and screw-capped bottles. Wherever applicable cross-contamination was avoided. Along with the saline lake water samples, soil samples were also considered because researchers have recommended that the soil with organic content could be a potent source of biosurfactant producers.55 The samples were processed for the enrichment of the organisms. The incubation period facilitated the enrichment of some promising halophilic organisms. Different media were initially employed for the enrichment and the purpose was to enrich the organisms so that at least they could tolerate 3% NaCl, as this would qualify the isolates to be moderately halophilic.8
From the saline water samples, 32 whereas from soil samples 18 isolates were obtained. These were obtained from media amended with 3% NaCl such as Nutrient agar, Sehgal-gibbons agar, Halophilic agar, and Zobell marine agar.
Enrichment and isolation of the biosurfactant producing halophilic microorganisms
All the moderate halophilic bacteria isolates obtained on enrichment, were able to grow in N-MSM inorganic mineral salt media. There was turbidity in the broth with growth and foam formation as shown in Figure 1. Foam formation indicated emulsification of the inducer Kerosene. Comparative observations of shake flasks used for biosurfactant production indicated that, foam formation along with turbidity were relatively lesser in the shake flask containing Coconut oil, Olive oil and Diesel respectively. The emulsification index value with kerosene (64.66 ± 0.57) was higher than that of Coconut oil (61 ± 1.73) Olive oil (62.33 ± 0.57) and Diesel (63.66 ± 0.57). In another research, based on tolerance to Kerosene, good emulsification was observed for Pseudomonas sp. that could degrade kerosene along with biosurfactant production as a secondary metabolite.56 Perhaps because the initial source of the saline lake water sample was contaminated and had traces of oil leaked by trollies for crude salt transport, there could be a possibility of the presence of hydrocarbon degraders. In the initial enrichment step, readily utilizable carbon source glucose was kept at a very low concentration just to provide enough energy source for survival. Later, only kerosene was available, and it could serve as source of energy and carbon inducing biosurfactant synthesis. Foam formation is observed during the production of biosurfactants, and attempts are being made to reduce the foam so as to reduce the downstream processing expenses.57 There was no other carbon source added to N-MSM. This indicated their potential to synthesize biosurfactant which was assessed in the double screening. Foaming was also observed in the production of rhamnolipid, and foam fractionation method was adopted by using a combination of product removal at that place with a pre-purification step.58
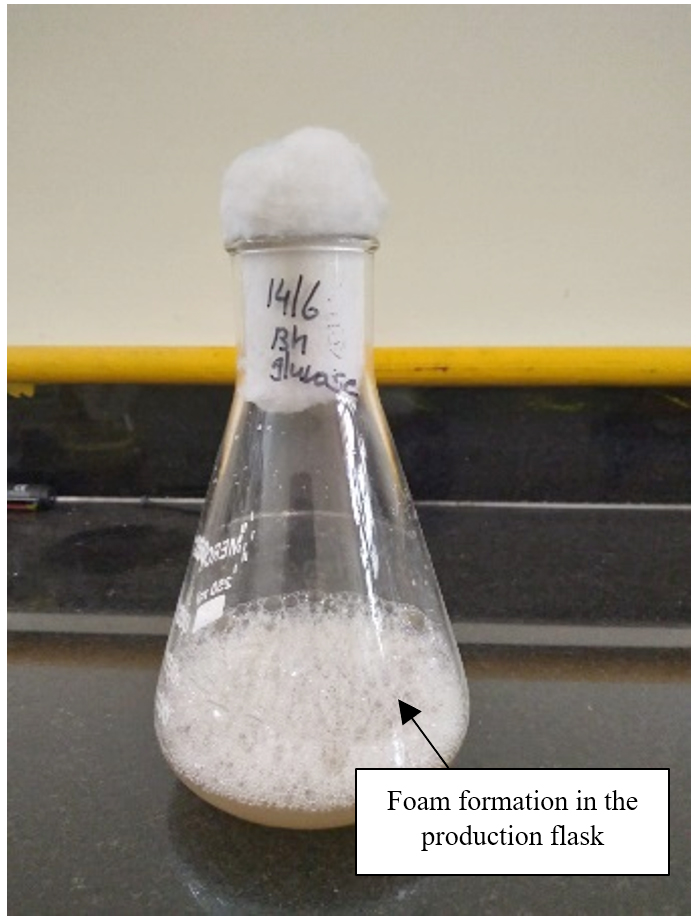
Figure 1. Foam formation in N-MSM production media for biosurfactant
Screening of isolates hydrocarbon utilization
The results were compared with biotic positive controls of cultures known to produce biosurfactant: (SS1) Bacillus sp. MTCC 2473, and (SS2) Pseudomonas aeruginosa MTCC 10636.
Stage I screening
Tilted glass slide (TGS) test
Isolates that exhibited the dipping of the liquid were selected for further screening. Results are shown in Table 1. In similar research, the tilted glass test was used to assess various organisms and marine Acinetobacter species. They had observed that tilted glass slide test in combination with other tests could serve in the screening of the biosurfactant producers.20
Table (1):
Tilted glass slide test
Isolate |
Observation |
|---|---|
SH-6 |
+ |
SS-1 (biotic positive control) |
+ |
SS-2 (biotic positive control) |
+ |
Key: + indicates a positive test; – indicates a negative test
Haemolytic test
Researchers in their review have mentioned haemolytic test as a significant preliminary test.59,60 Like our research, the researchers could isolate a variety of haemolytic positive isolates such as Serratia sp., Bacillus sp.20,61 However, we cannot rely totally on the haemolytic tests as the zone of clearance on SIBA-Super imposed blood agar could be due to other factors like virulence factor haemolysin or due to divalent ions. Hence, it is better to supplement the haemolytic test with other tests. Figure 2 consists of the SIBA plate with the growth of SH-6. Observations for the haemolytic activity are mentioned in the Table 2.
Table (2):
Haemolytic test
Isolate |
Observation |
|---|---|
SH-6 |
++ |
SS-1 (biotic positive control) |
+++ |
SS-2 (biotic positive control) |
++ |
Key: ++ clear zone of haemolysis would be less than 1 cm.
+++ clear zone would be greater than 1 cm and less than 3 cm.
– indicates a negative test indicating absence of haemolysis
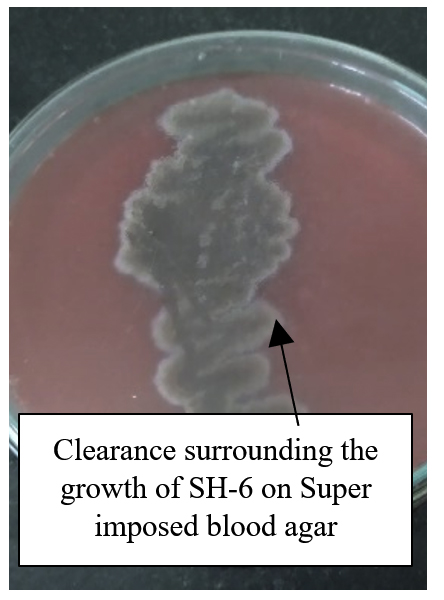
Figure 2. SIBA plate with a growth of SH-6 and a zone of clearance surrounding the growth
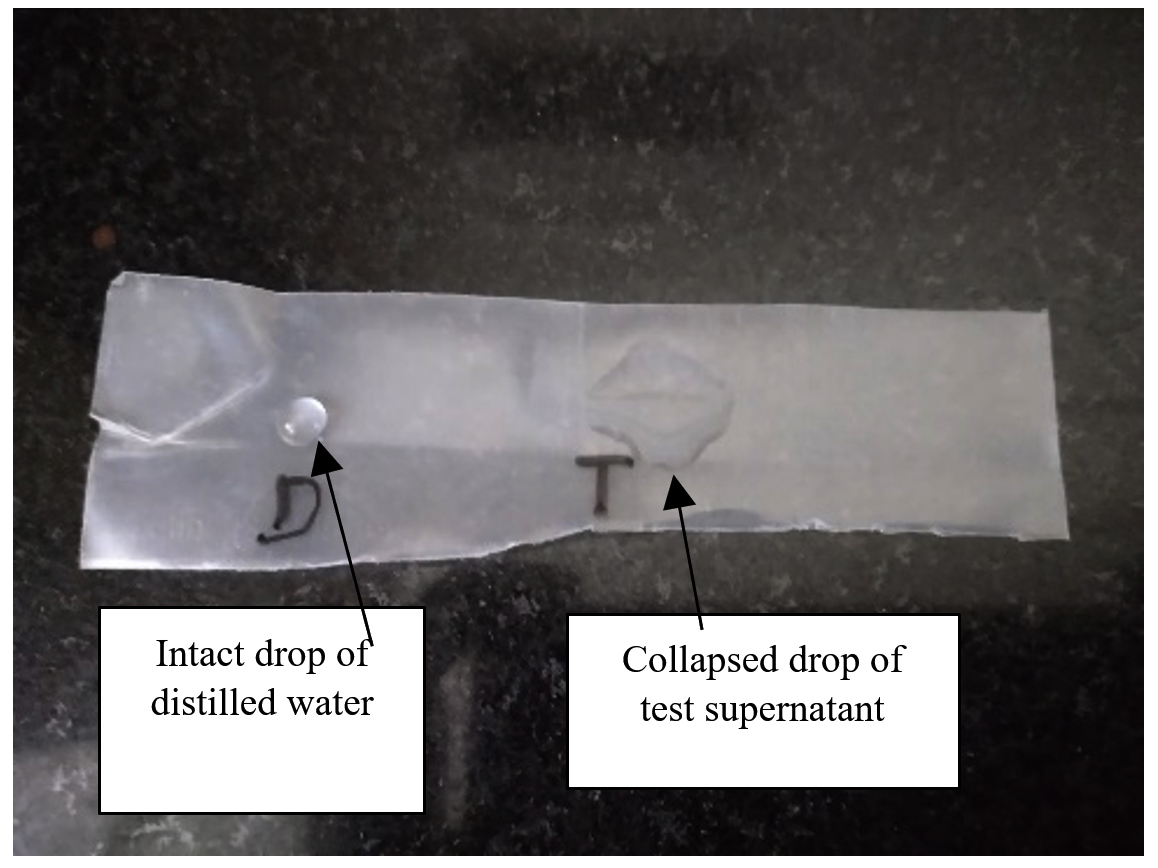
Figure 3. Parafilm-M test showing the collapse of the drop against the intact drop of water as a negative control
Parafilm M test
After taking a drop on the Parafilm-M paper strip the drop diameter was evaluated for isolates as shown in Table 3 and Figure 3. Similar investigation was undertaken for the screening tests for the heavy metal tolerant biosurfactant producing isolates from Egyptian soil. In their research most of the isolates had a diameter in the range of 0.4-0.7 cm. Our isolates also exhibited a similar response which in turn corroborates the data in the literature.23 One-way ANOVA-based analysis with the p-value of 0.005 which is less than 0.05 implies significant findings. Calculated F-value was 14 that was higher than the F critical value 5.143, indicating significant differences in means.
Table (3):
Parafilm-M test
Isolate |
Diameter of the group (cm) |
|---|---|
SH-6 |
0.6 ± 0 |
SS-1 (biotic positive control) |
0.57 ± 0.01 |
SS-2 (biotic positive control) |
0.61 ± 0.01 |
Note: (p-value = 0.005, F = 14, n = 3)
Lipolytic test
The isolates growing on Gorodkowa’s Tributyrin agar were evaluated for a zone of clearance. The results are shown in Table 4. Lipase test could be considered as a significant aspect. As per the literature, lipase production has been associated with glycolipids and lipopeptides.62
Table (4):
Lipolytic test
Isolate |
Observation |
|---|---|
SH-6 |
++ |
SS-1 (biotic positive control) |
++ |
SS-2 (biotic positive control) |
++ |
Key: ++ indicates a prominent zone of clearance
+ indicates a weaker zone of clearance
Oil-drop-collapse method
This test has been employed by other researchers as well for the screening of biosurfactant producers.22,63 Drop-collapse test would be positive for the isolates which synthesize higher extracellular biosurfactant. The results are shown in Table 5. As per the literature, the isolates positive for the oil-drop collapse test could be further tested for surface tension.26 Keeping this aspect into consideration the isolates were further evaluated by employing relatively better and more reliable sensitive test such as Oil displacement test as mentioned in Table 6.
Table (5):
Drop collapse test
Isolate |
Observation |
|---|---|
SH-6 |
++ |
SS-1 (biotic positive control) |
++ |
SS-2 (biotic positive control) |
++ |
Key: ++indicates relatively less flat drop after 1 min
Table (6):
Oil displacement test
Isolate |
Diameter of clearance zone (cm) |
|---|---|
SH-6 |
2.96 ± 0.05 |
SS-1 (biotic positive control) |
2.9 ± 0.17 |
SS-2 (biotic positive control) |
2.36 ± 0.3 |
Note: (p-value = 0.02, F = 7.684, n = 3)
Oil displacement test
Displacement of oil is connected with biosurfactant activity.64 Oil displacement is a more sensitive technique to screen producers of biosurfactant than other methods adopted for the same.65 It works on the principle that biosurfactants alter the contact angle manifesting at the oil-water interface, exerting surface pressure and eventually leading to the displacement of the oil drops66 as mentioned in Table 6 and Figure 4. One-way ANOVA-based analysis with 0.02 as p-value implies important findings. Calculated F value was 7.684 that was higher than the F critical value 5.143, indicating significant differences in means.
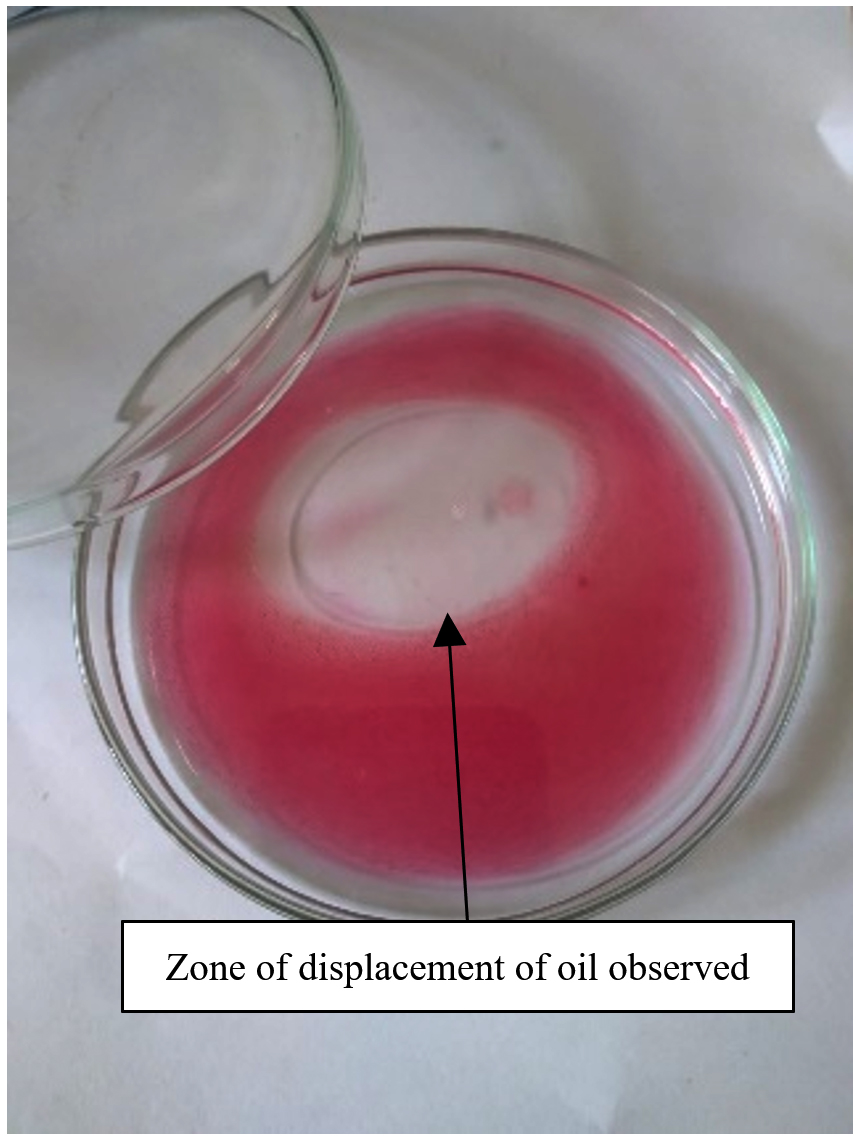
Figure 4. Oil displacement test
Stage II screening
CTAB agar method
The isolates were assessed for the appearance of bluish halo surrounding the growth. Formation of blue colour indicates biosurfactant production. Glycolipids can react with the bromide salt found in CTAB and form a blue complex with methylene blue leading to an ion pair that is not soluble.67 Test has been employed for Pseudomonas species68 as well as the Bacillus species. The results are shown in Table 7 and Figure 5. On the basis of one-way ANOVA, p-value was found to be 0.02 which is lesser than 0.05 indicating crucial findings. Calculated F value was 7.166 that was higher than the F critical value 5.143, indicating significant differences in means.
Table (7):
CTAB agar test
Isolate |
Diameter of halo zone (mm) |
|---|---|
SH-6 |
17.66 ± 0.57 |
SS-1 (biotic positive control) |
15.33 ± 0.57 |
SS-2 (biotic positive control) |
17.33 ± 1.15 |
Note: (p-value = 0.02, F = 7.166, n = 3)
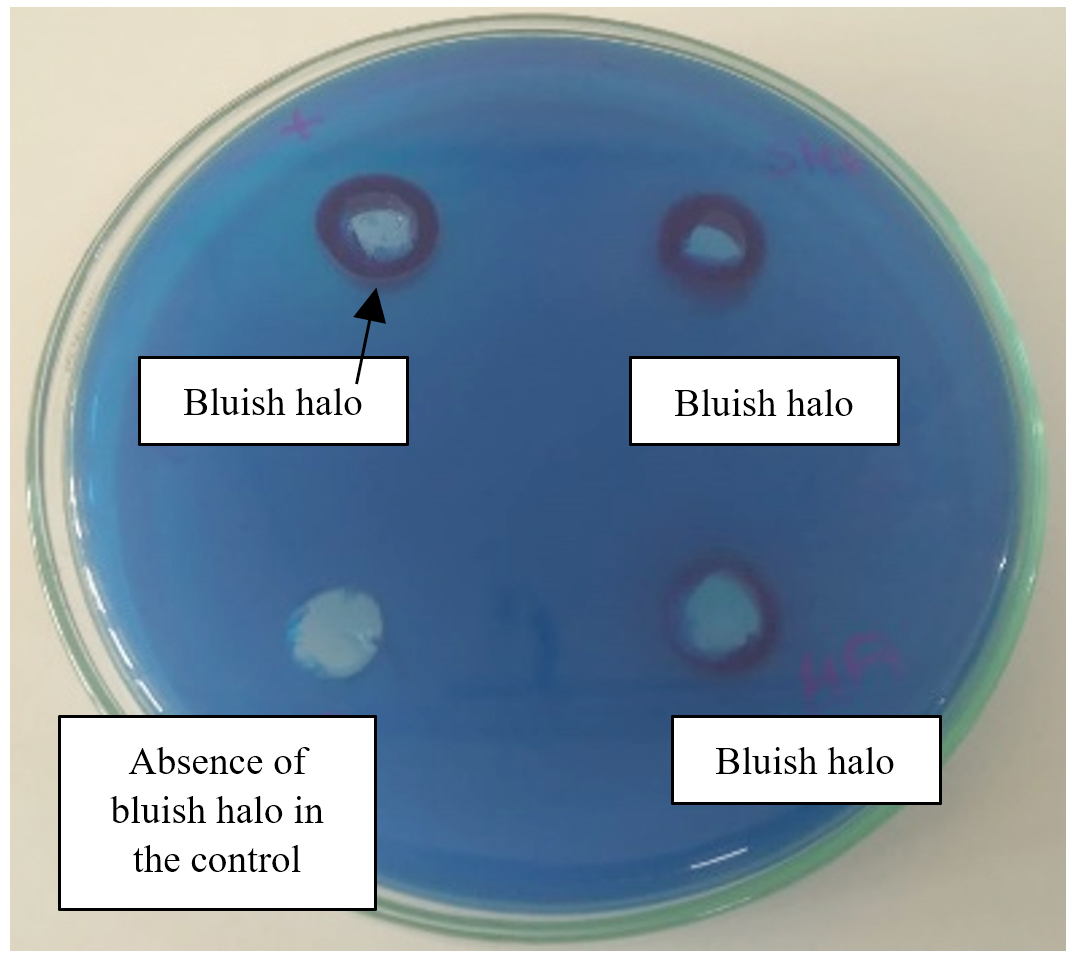
Figure 5. Bluish halo around the well indicating the presence of a biosurfactant
BATH test
The response to the BATH test indicates the hydrophobicity of biosurfactants. The method of BATH was employed by another researcher. SH-6 isolate has been responding consistently good in the tests performed till this stage as depicted in Table 8. Data was validated using one-way ANOVA and the p-value was calculated to be 0.0003. Calculated F value was 38.196 that was higher than the F critical value 5.143, indicating significant differences in means.
Table (8):
BATH test
Isolate |
% hydrophobicity |
|---|---|
SH-6 |
61.58 ± 0.8 |
SS-1 (biotic positive control) |
56.91 ± 0.62 |
SS-2 (biotic positive control) |
60.33 ± 0.57 |
Note: (p-value = 0.0003, F = 38.196, n = 3)
Measurement of emulsification index
The results are shown in Table 9 and Figure 6. Hydrocarbon emulsification basically enhances bioavailability. This serves as an indirect test but significantly helpful as it is biosurfactant dependent variable.61
Table (9):
Emulsification index
Isolate |
% E24 |
|---|---|
SH-6 |
64.66 ± 0.57 |
SS-1 (biotic positive control) |
62 ± 1 |
SS-2 (biotic positive control) |
64.33 ± 0.57 |
Note: (p-value = 0.009, F = 11.4, n = 3)
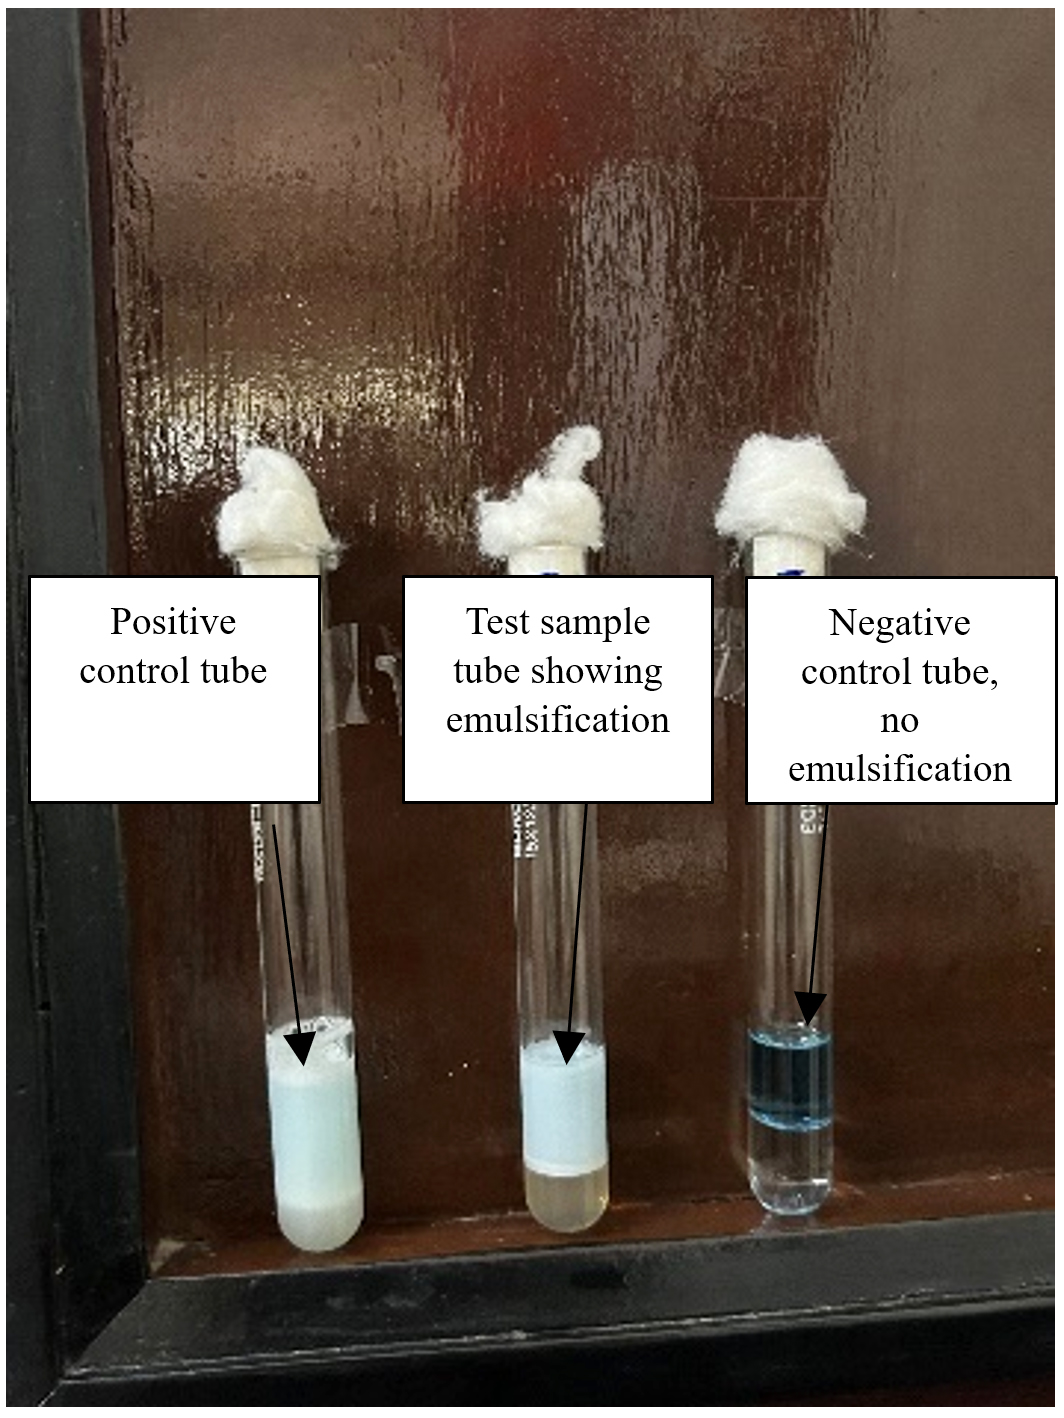
Figure 6. Emulsification test
Using one-way ANOVA, p-value was calculated to be 0.009 highlighting the reliability of the observations. Calculated F-value was 11.4 that was higher than the F critical value 5.143, indicating significant differences in means.
Emulsification feature could be considered as stable if E24 is more than 50%. Considering the aspects mentioned by other researchers as quoted, it appears SH-06 bacterial isolate could exhibit a considerable degree of stable response.
Determination of surface tension
If a microorganism decreases the medium’s tension-active force to a value less than 40 mN/m, it could be an important indicator for the synthesis of biosurfactants.69,70 They could be considered useful in a variety of bioremediation related processes. At the interfacial zone, biosurfactants induce the formation of the micelles which eventually increases solubility of poorly soluble compounds in water.71
Table (10):
Comparative analysis of surface tension reduction values
No. |
Initial value of surface tension (mN/m) of sample |
Final value of surface tension (mN/m) of sample after biosurfactant production |
Ref. |
|---|---|---|---|
1. |
64 |
34 |
Current study |
2. |
72 |
35.26 |
72 |
3. |
66 |
30 ± 0.65 |
73 |
4. |
64 |
30 |
74 |
Table 10 consists of the findings of the surface tension reduction in comparison with other strains of Pseudomonas aeruginosa synthesizing biosurfactants. Values of surface tension reduction reported in literature are reasonably closer to the findings in this research. Carbon to nitrogen ratio, pH, temperature and other physico-chemical conditions influences the biosurfactant production. The percentage reduction is mentioned in Table 11.
Table (11):
Determination of surface tension
Isolate |
Percent reduction in surface tension |
|---|---|
SH-6 |
47.33 ± 0.57 |
SS-1 (biotic positive control) |
52.08 ± 1.8 |
SS-2 (biotic positive control) |
48.95 ± 0.9 |
Note: (p-value = 0.008, F = 11.90, n = 3)
One-way ANOVA-based analysis with a lower p-value of 0.008 substantiates the observations. Calculated F value was 11.909 that was higher than the F critical value 5.143, indicating significant differences in means.
Identification of the promising biosurfactant producer
Gram staining
The isolate SH-6 was found to be Gram negative rod in staining as shown in Figure 7. Table 12 consists of the colony characteristics of the isolate SH-06 on Nutrient agar media amended with 3% NaCl.
Table (12):
Colony characteristics of SH-06
Colony characteristics |
Observed result |
|---|---|
Colony size |
2 mm |
Shape |
Slight elliptical |
Colour |
Greenish blue |
Margin |
Entire |
Elevation |
Flat |
Motility |
Motile |
Consistency |
Butyrous |
Opacity |
Translucent |
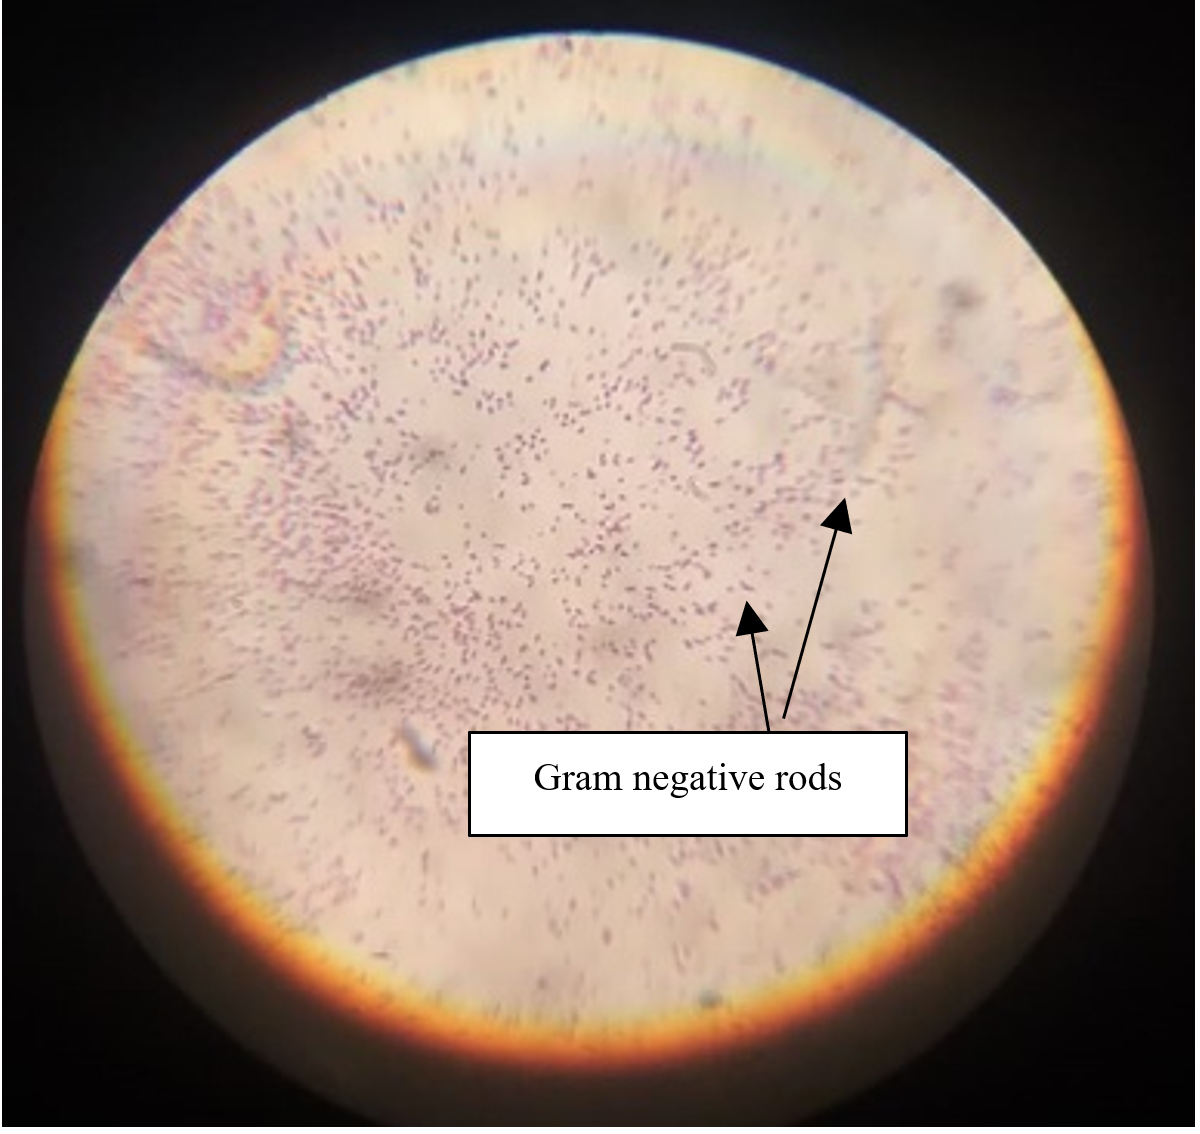
Figure 7. Gram staining of the isolate
16S rRNA gene sequencing analysis
Analysis of the pure isolate was undertaken at the Hi-Media Laboratory, Thane. When the isolate SH-06 was subject to 16S rRNA gene analysis, the amplicon was retrieved, and Sanger sequencing machine was used for sequencing. Bacterial isolate SH-06 was subjected to phylogenetic analysis and identified to be Pseudomonas aeruginosa. On further analysis with BLASTN algorithm, the respective sequence files were uploaded on the NCBI portal. GenBank Accession number was obtained as PP567277. Phylogenetic tree was constructed as shown in Figure 8 using neighbour-joining algorithm using 1000 iterations, to observe for the evolutionary relationships of SH-6 with other Pseudomonas strains. The isolate SH-6 exhibited a close evolutionary relationship with Pseudomonas aeruginosa (ASRA01000067) and hence identified as Pseudomonas aeruginosa.
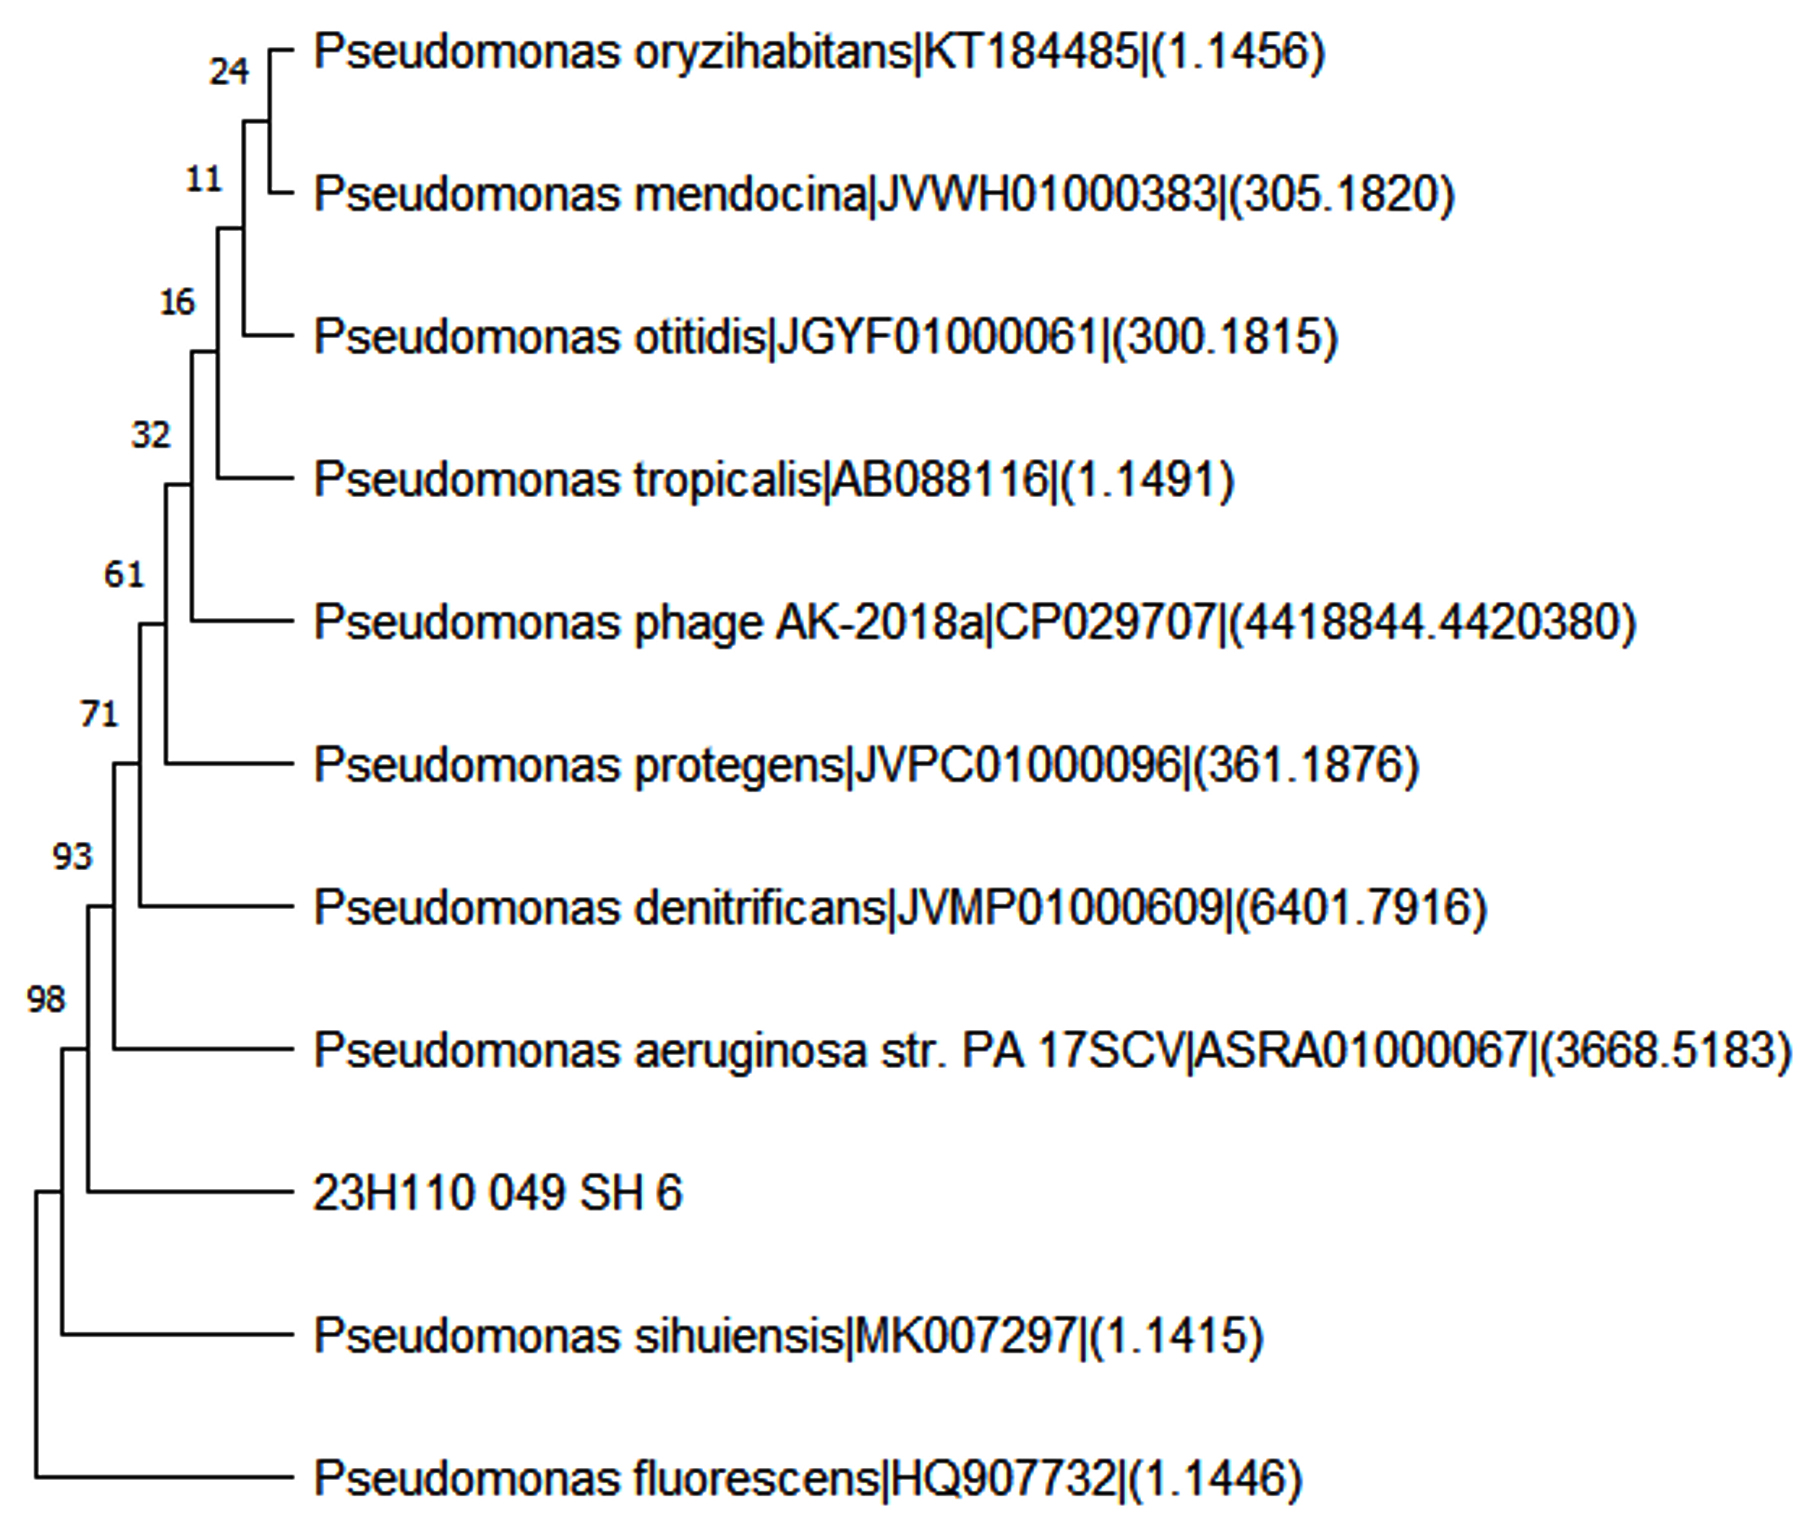
Figure 8. Phylogenetic tree for Pseudomonas aeruginosa SH-6
Production of biosurfactant
The method adopted for development of inoculum differs from cell to cell and the parameters to be assessed. Luria Bertani broth was used for inoculum development for seeding the production media. Another research mentioned substrate in the form of waste engine oil for biological remediation of contaminated soil and commercial synthesis of biosurfactant.75 Another research highlighted the potential of valorization of waste engine oil with an objective to facilitate a circular bioeconomical concept of biosurfactant production by assessing the rates of aeration and agitation in a fed-batch fermentation mode.76 Scientific investigation highlighted the possibility to adopt the approach of free and immobilized cell system using waste engine oil in order to synthesize biosurfactant,77 wherein using GC-MS it was observed that immobilized strain of Pseudomonas aeruginosa exhibited a relatively better potential as compared to free cells.76
Extraction and estimation of biomass
The biomass was obtained after the harvesting of the production broth. Biosurfactant was derived from the supernatant. Cell pellet was subjected to drying yielding a dry weight of 0.41 ± 0.01 g %.
Extraction and recovery of biosurfactant
Different solvents were assessed in combination taking into consideration the proper balance of the polarity of the system. A comparative analysis of the solvent extraction methods as shown in Table 13, highlights the yield of biosurfactant obtained along with the percentage purity of the solvents used in the extraction process. From the Table 13, it is evident that the average yield is highest 0.3 ± 0 g % with Chloroform:Methanol in the ratio (2:1) used for extraction. Possible reason could be due to the provision of both non-polar (chloroform) and polar (methanol) phases ensuring proper extraction, owing to the fact that biosurfactant consists of hydrophilic and hydrophobic domains. One-way ANOVA -based analysis with the p-value of 0.003 implies the importance of the findings. Calculated F value was 6.430 that was higher than the F critical value 3.105, indicating significant differences in means.
Table (13):
Comparative analysis of solvent extraction methods
Solvent system |
Average Yield (g %) ± SD |
|---|---|
Chloroform:Methanol (2:1) |
0.3 ± 0 |
Chloroform:Ethanol (2:1) |
0.26 ± 0.01 |
Chloroform:Methanol:Water (10:5:7) |
0.25 ± 0.03 |
Cold Dichloromethane |
0.25 ± 0 |
Cold Acetone precipitation |
0.23 ± 0.02 |
Chilled Ethyl acetate |
0.27 ± 0.01 |
Note: (p-value = 0.003, F = 6.430, n = 3)
The dried honey coloured biosurfactant was obtained in the study by employing a combination of Chloroform:Methanol (2:1) as shown in Figure 9. The yield of biosurfactant obtained using Chloroform:Methanol (2:1) combination was 0.31 ± 0.01 g % which was relatively better than the other combinations as shown in Figure 10.
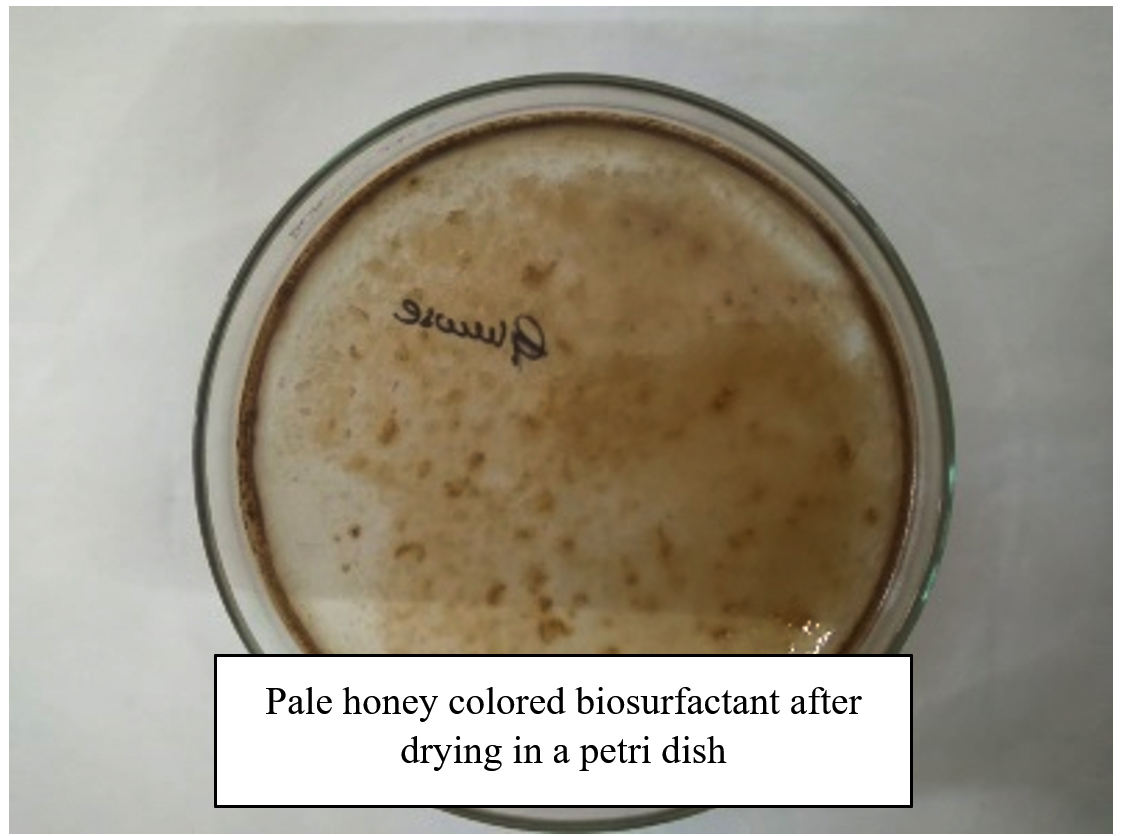
Figure 9. Pale honey coloured dried biosurfactant in a petri dish
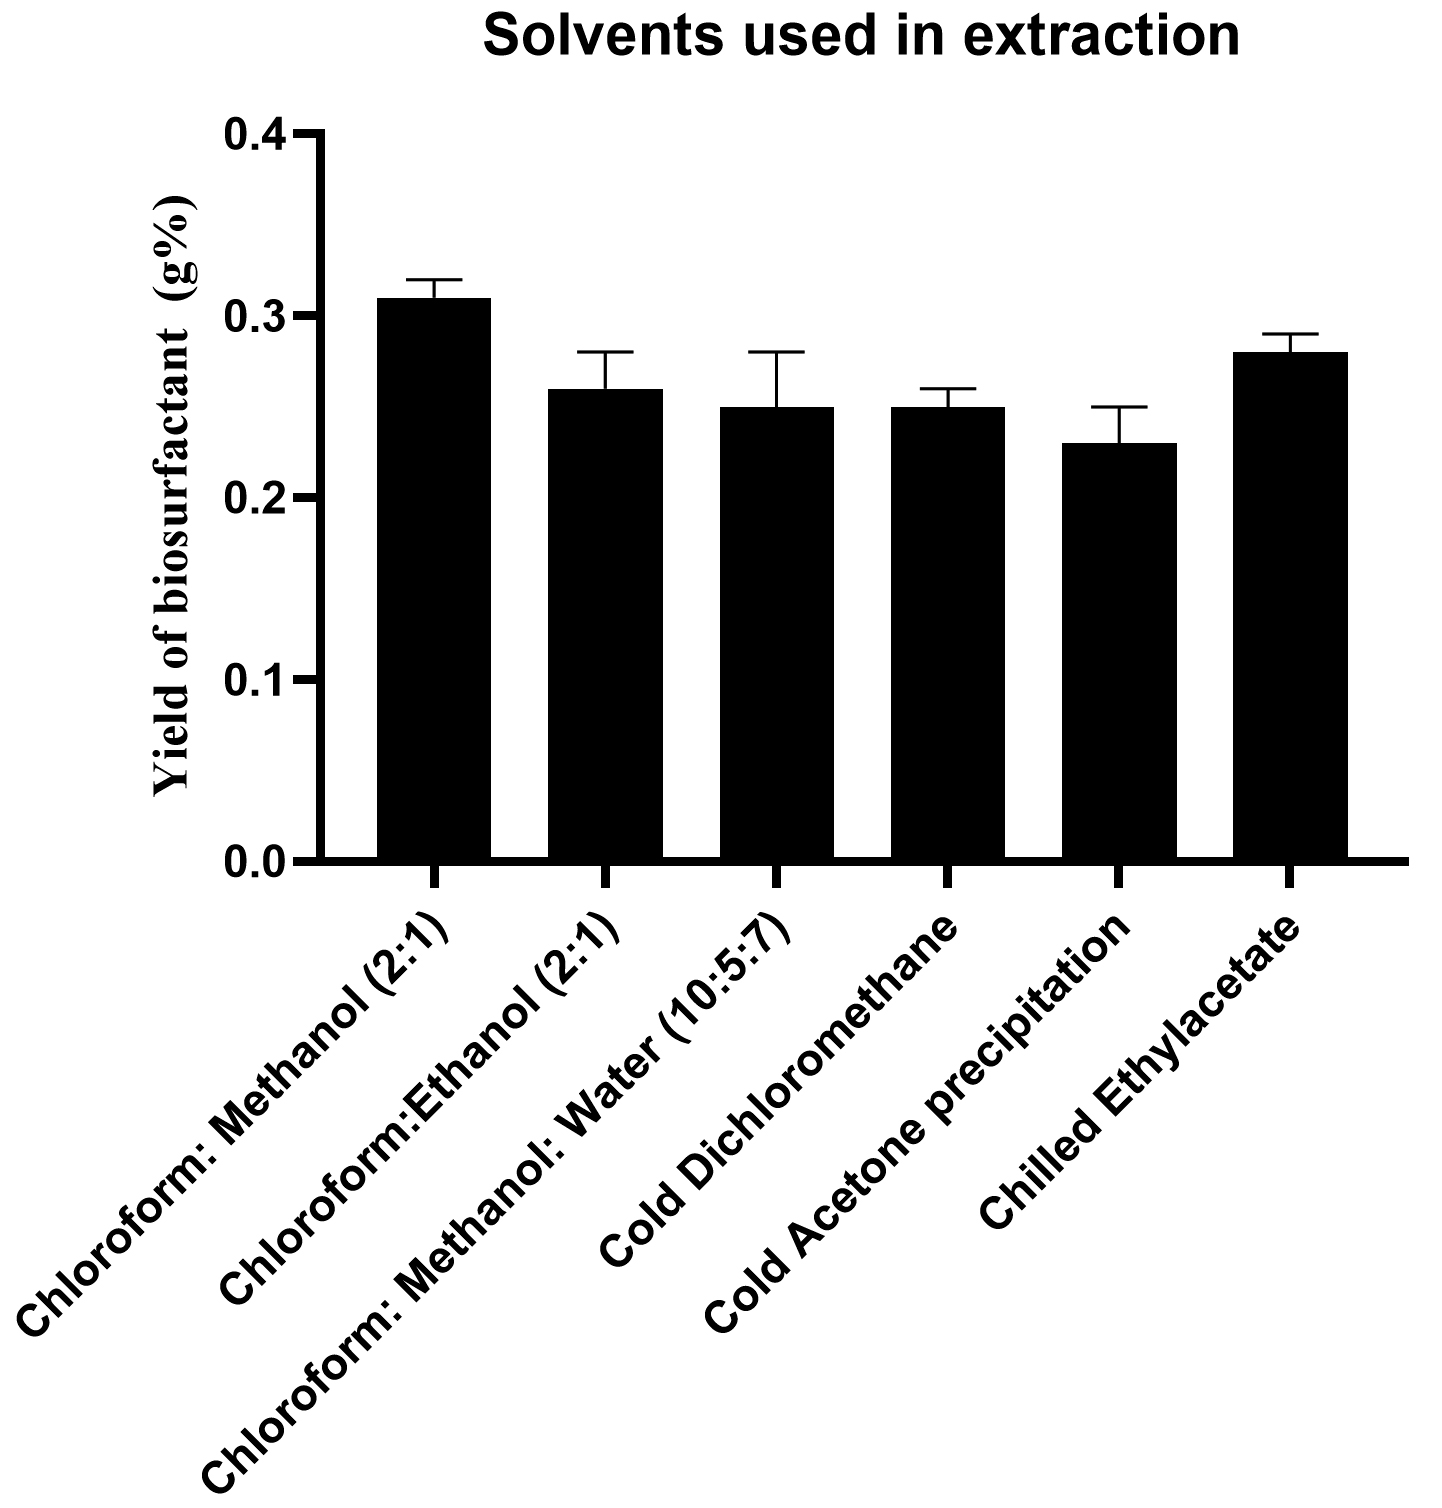
Figure 10. Solvents used for the recovery of biosurfactant
When the supernatant was subjected to acid precipitation and solvent extraction a viscous pale honey coloured biosurfactant was obtained. The initial yield of the biosurfactant was 0.31 ± 0.01 g %. Phosphate buffer pH 7.0, was used to reconstitute the biosurfactant and was preserved in it.
Characterization of biosurfactant
Initial detection of biosurfactant components using Column chromatography and thin layer chromatography (TLC)47
Column chromatography
Fractions of 10 mL were collected in dilution tubes and were evaluated by TLC. Column chromatography could facilitate separation of different congeners of rhamnolipids with different number of rhamnose units. Fractions collected from column were validated by TLC analysis.
Thin-layer chromatography
Column chromatography fractions on analysis by TLC exhibited the presence of congeners of rhamnolipids. When fractions collected from column chromatography were subjected to TLC analysis, initial fractions (the first ones to elute) contained mono-rhamnolipids, whereas the fractions collected later contained di-rhamnolipids. As in the initial stages for enrichment kerosene was used as an inducer for biosurfactant synthesis, mono-rhamnolipids were relatively more than di-rhamnolipids.78 These findings were in alignment with the observations from another research on the assessment of antimicrobial potential of congeners of rhamnolipids.79 Different spots (yellow and brown in colour) were observed when the plate was sprayed with reagent for sugars and lipids respectively. There was no visible spot for amino acid. Glycolipid nature of the biosurfactant could be deduced from these findings and could be Rhamnolipid, as the standard used for TLC was 0.1% Rhamnose and the spot was in alignment with the test sample spot. TLC plates are shown in the Figure 11 (a and b). The glycolipid Rf value of 0.74 for test and 0.75 for standard Rhamnolipid are in close agreement with the findings in a paper for TLC of Rhamnolipids using a similar solvent system.80 The lower ones were di-rhamnolipids and the upper spots were mono-rhamnolipids. These findings were in alignment with the research conducted with Pseudomonas aeruginosa KT1115 for di-rhamnolipid wherein the researchers tried TLC to assess the mono and di-rhamnolipid types of biosurfactants and separate them.81 Mono-rhamnolipids could be employed when there is relatively greater degree of hydrophobicity required as observed in the case of solubilization of hydrophobic substances; whereas di-rhamnolipids are suitable for emulsification-based applications due to their enhanced polar attributes.82
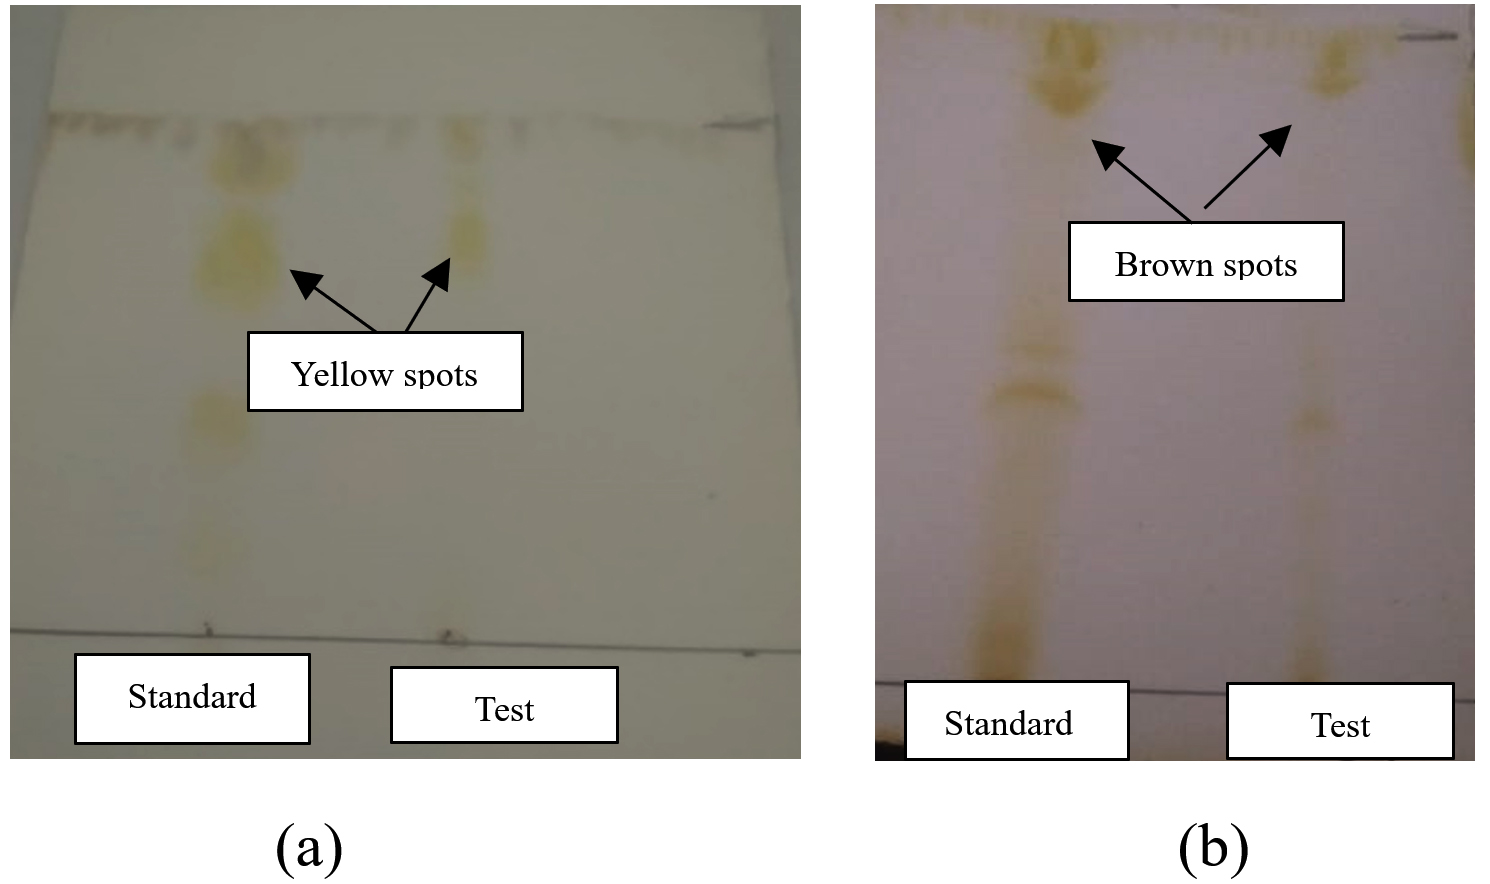
Figure 11. TLC plate showing the spots indicating (a) yellow for sugar and (b) brown for lipid
HPLC analysis of biosurfactants
HPLC analysis revealed the presence of Rhamnolipid in test sample. Retention peak of the test sample T1 at 21.417 min was in agreement and very close to the standard Rhamnolipid R-90 (AGAE) with a retention time at 21.441 min. The chromatograms as depicted in the Figure 12 (a and b)for the test and the standard samples confirm the presence of the Rhamnolipid. Our findings corroborate the findings in research, that stated that the p-bromophenacyl esters of Rhamnolipids were separated using reverse phase HPLC within 25 min.3
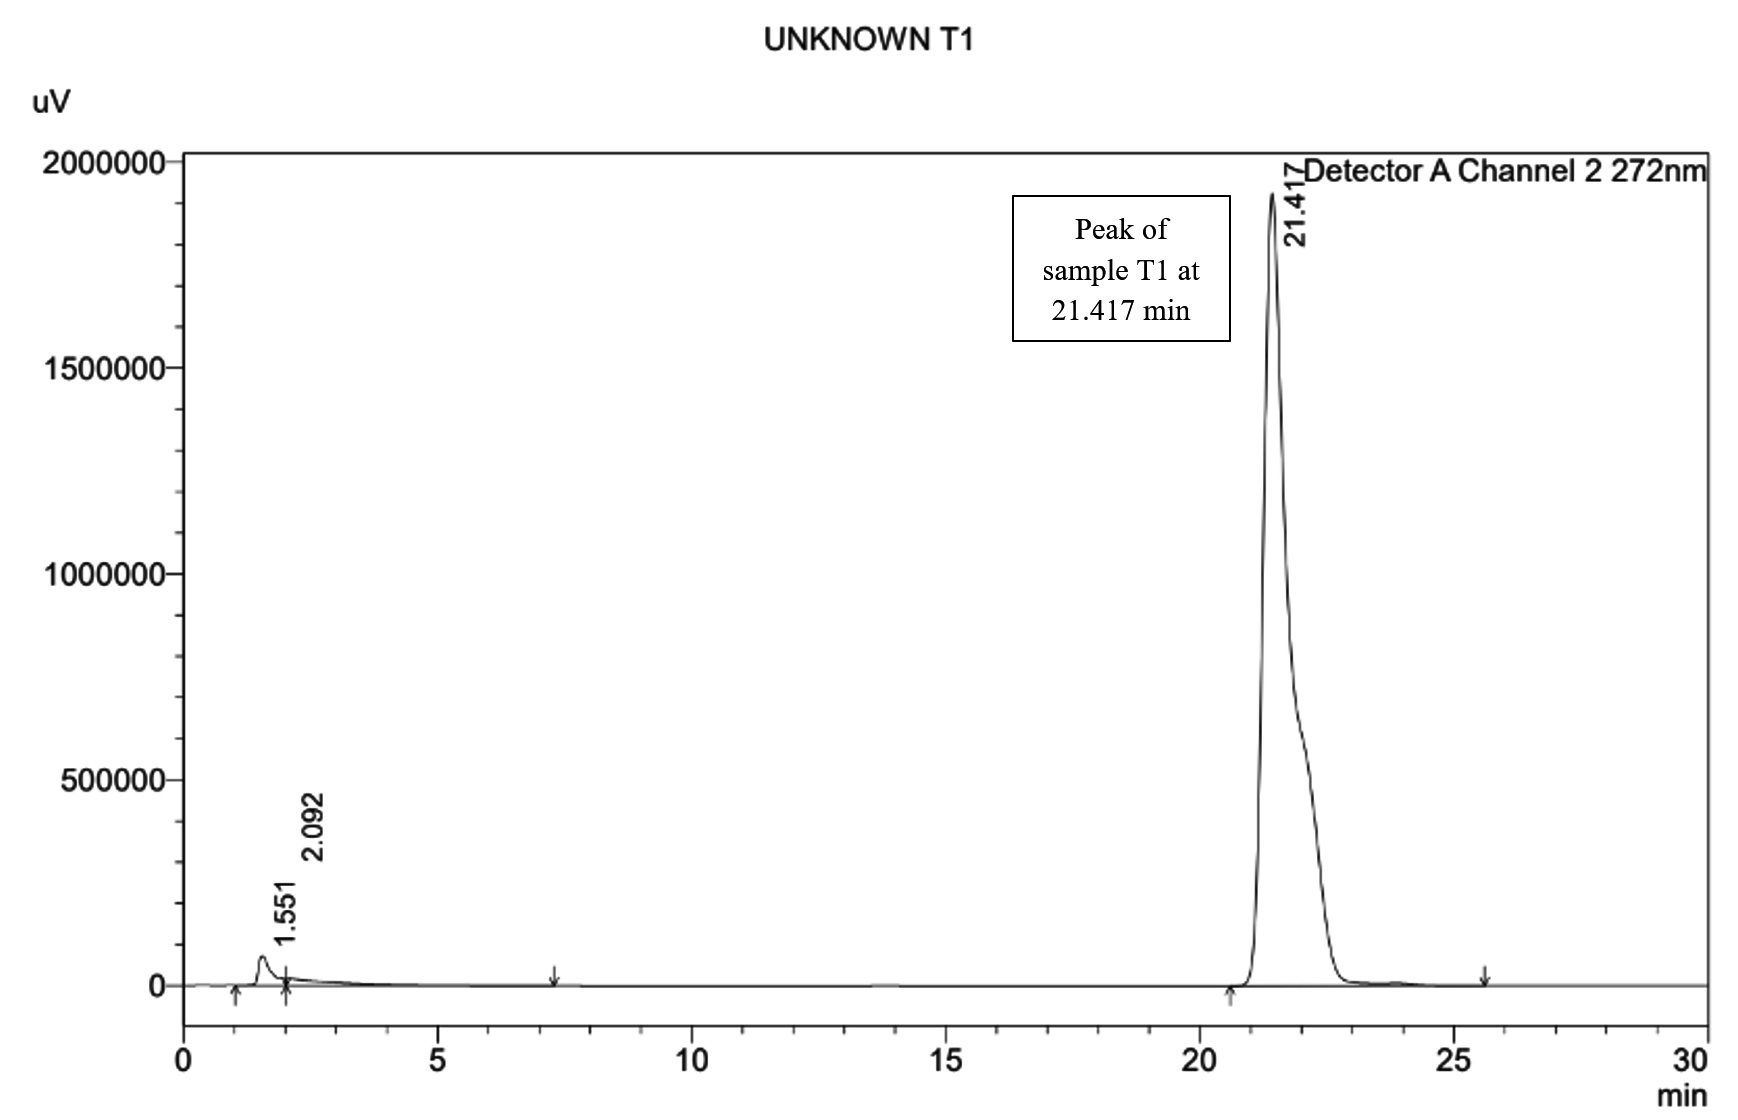
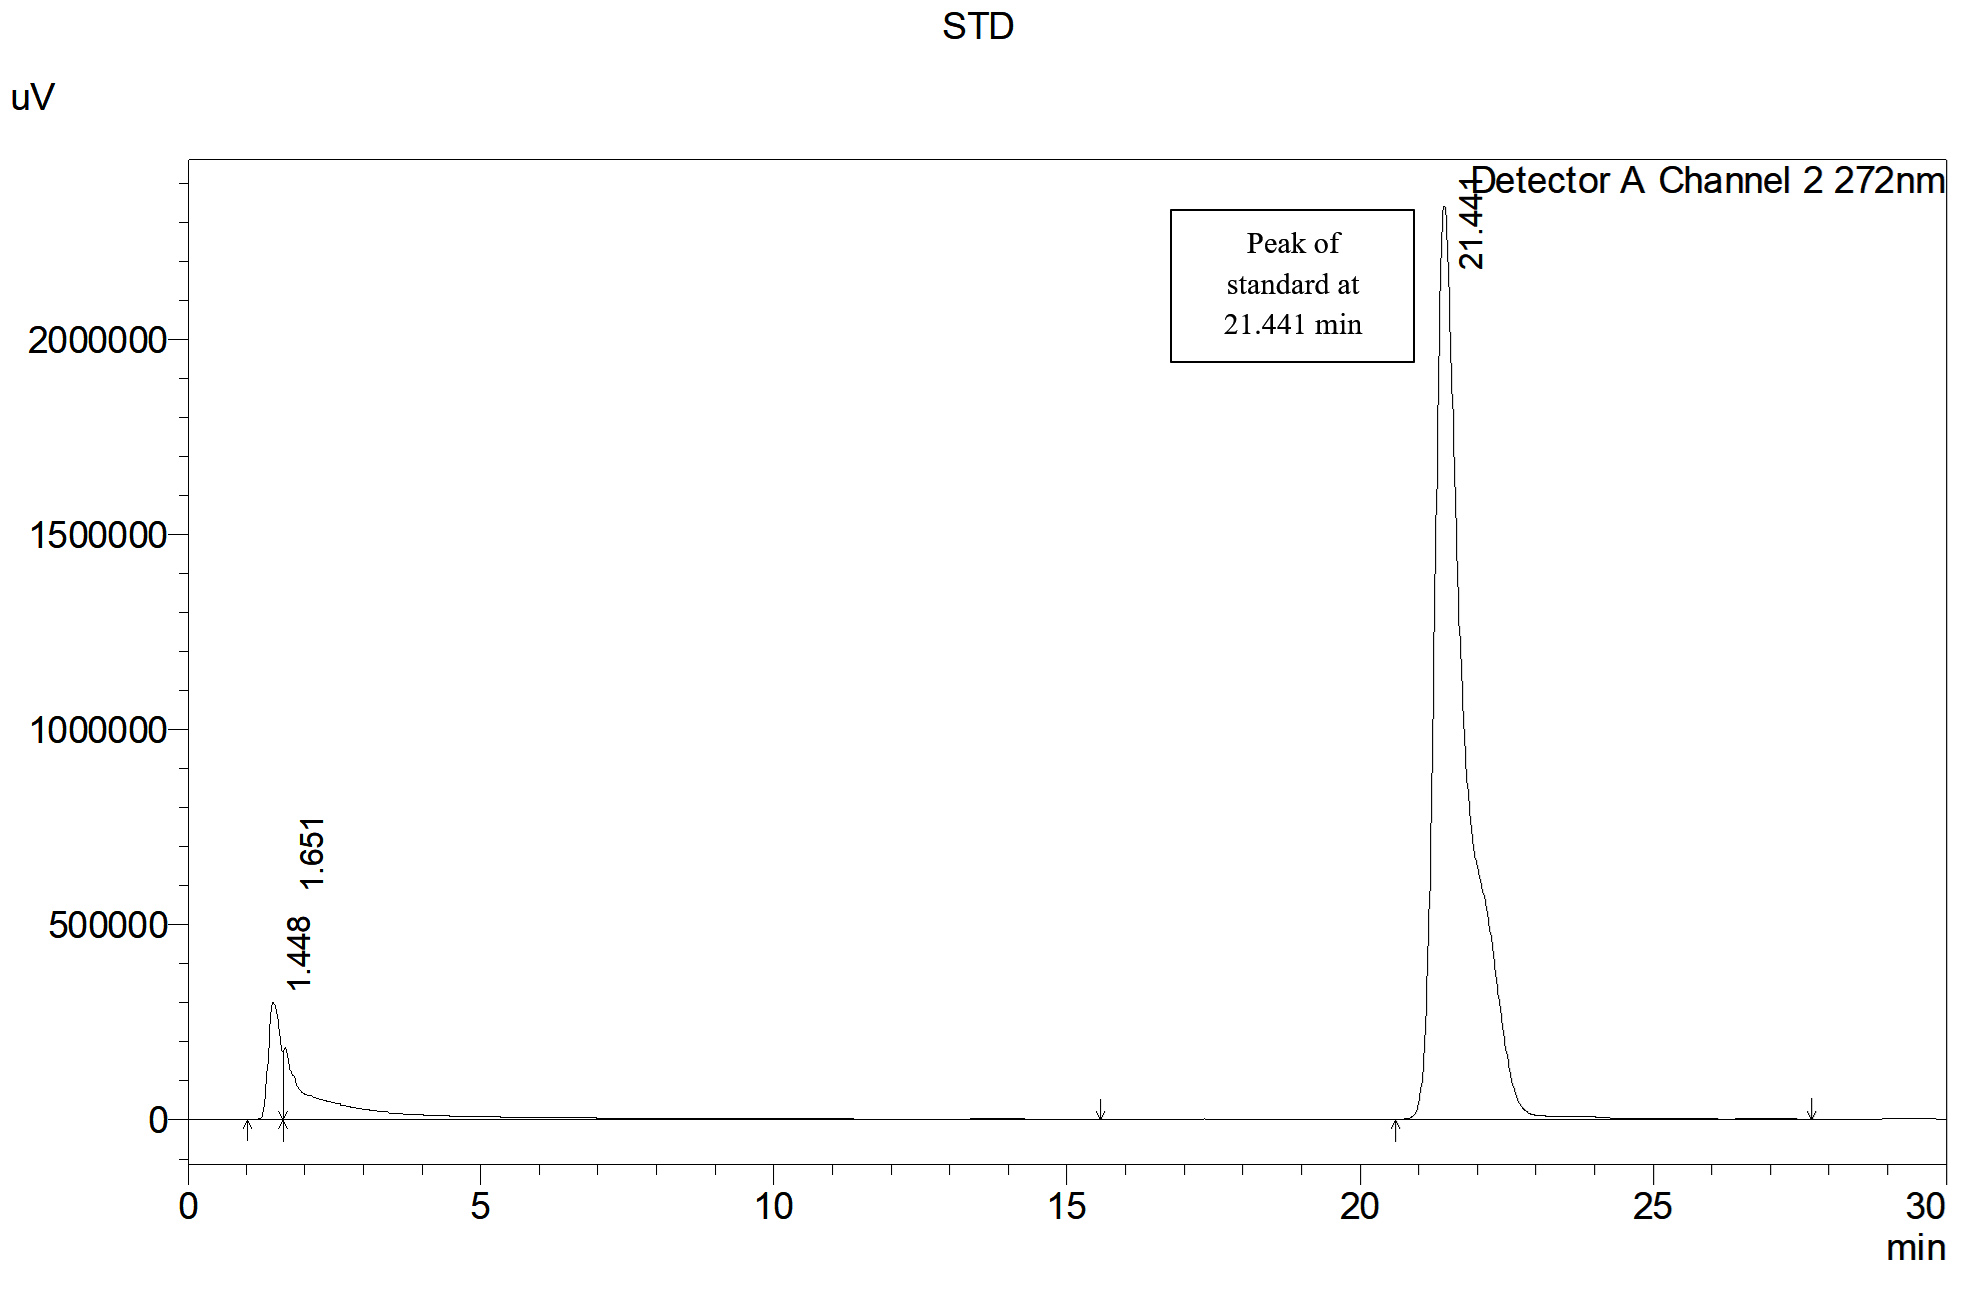
Figure 12. (a) HPLC chromatogram of test sample; (b) HPLC chromatogram of the standard Rhamnolipid
Separation of components of biosurfactant and confirmation of results of TLC by HPTLC
HPTLC analysis validated the findings of TLC and detected the presence of Rhamnolipid in the test samples. Different sugar based (Glucose and Glycerol) rhamnolipids were assessed and Rhamnolipid was detected in both the samples, as two major bands at Rf: 0.36 and Rf: 0.56 after derivatization with Naphthol reagent. In Rhamnolipid standard track with 90% purity (AGAE) 5 bands were detected at different Rf values: 0.15, 0.21, 0.36, 0.41 and 0.56 respectively. Band at Rf: 0.36 and 0.56 from Rhamnolipid standard were considered as the major bands. Band at Rf: 0.36 and 0.56 similar to Rhamnolipid were detected in both the test samples for SH-6 bacterial isolate i.e. SH-6 Glucose and Glycerol-based test samples as shown in the Figure 13. HF-1 Olive oil-based sample was for a fungal isolate. In similar research for HPTLC for rhamnolipids, the researched found 4 peaks, out of which 2 peaks were considered as major homologues based on area percentages.83
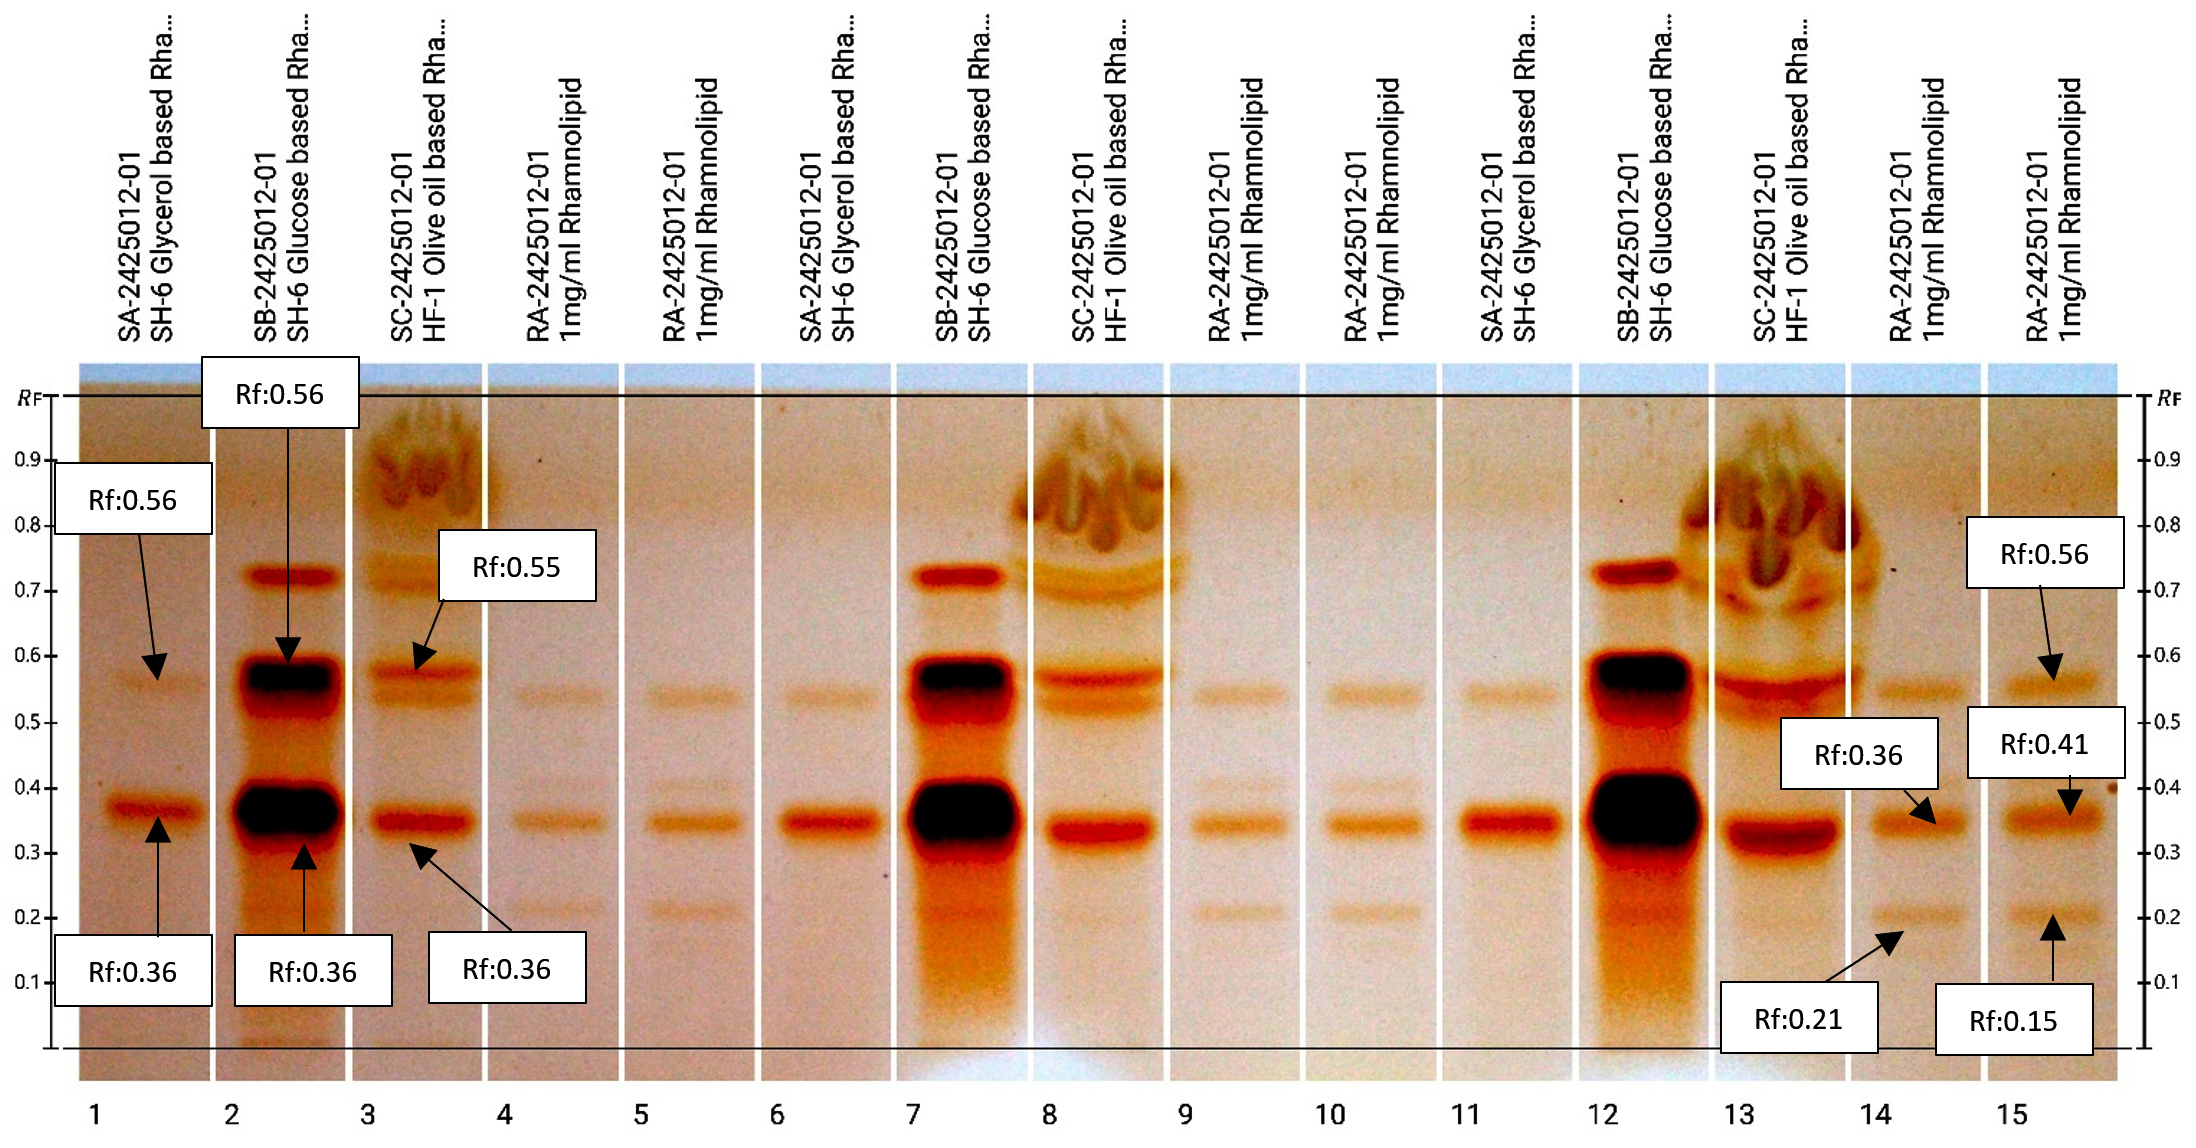
Figure 13. HPTLC chromatogram (Track Details: Track-1,6 & 11: Glycerol based Rhamnolipid with volume 5,10 and 15 µL, Track-2,7 & 12: Glucose based Rhamnolipid with volume 5,10 and 15 µL, Track -3,8 & 13: Olive oil based Rhamnolipid with volume 5,10 and 15 µL, Track-4,5,9,10,14 & 15: Rhamnolipid standard with volume. 2,3,4,5, and 6 µL respectively)
Emphasis was on the enrichment, isolation, screening of biosurfactant synthesizing halophilic organisms. The enrichment was undertaken first for the halophilic organisms and from them the biosurfactant producers were obtained by enrichment in inorganic mineral salt media N-MSM amended with 3% NaCl and 1% inducer Kerosene. There was no other carbon source added to N-MSM broth. Two stages of screening allowed the selection of the most suitable isolates, since only one screening test would not be sufficient to assess and validate the potential to synthesize biosurfactant. A moderate halophilic Pseudomonas aeruginosa SH-6 exhibiting optimum growth at 3% NaCl was obtained. It could synthesize Rhamnolipid (0.31 ± 0.01 g %), the presence of which was confirmed by TLC, HPLC and HPTLC.
Future prospects
Taking a cognizance of the production cost, there is immense scope to investigate the physico-chemical parameters governing Rhamnolipid production that would help in the production optimization. Based on the principle of OFAT (One Factor At a Time) various parameters could be optimized. Findings from OFAT could be considered for Plackett-Burman based screening of significant variables followed by further optimization using response surface methodology. There is immense potential for further research on strain improvement to enhance the yield of Rhamnolipid using appropriate genetic engineering techniques. Various other extremophilic organisms could be investigated to obtain biosurfactant producers. Use of biosurfactants in agriculture, medicine and environment could be investigated.
ACKNOWLEDGMENTS
The authors are thankful to the Principal K.J. Somaiya College of Science and Commerce, Vidyavihar, Mumbai, and the management of Somaiya Vidyavihar for the infrastructure.
CONFLICT OF INTEREST
The authors declare that there is no conflict of interest.
AUTHORS’ CONTRIBUTION
Both authors listed have made a substantial, direct and intellectual contribution to the work, and approved it for publication.
FUNDING
Initial pilot scale studies were assisted by funding for Minor research from University of Mumbai in 2016-2017.
DATA AVAILABILITY
All datasets generated or analyzed during this study are included in the manuscript.
ETHICS STATEMENT
This article does not contain any studies on human participants or animals performed by any of the authors.
- Jain A, Waseem Khan H, Jain P. Application of biosurfactant as versatile additives or ingredients of food processing. Applications of Next Generation Biosurfactants in the Food Sector. 2023:111-135.
Crossref - Clien SY, Lu W Bin, Wei YH, Chen WM, Chang JS. Improved production of biosurfactant with newly isolated Pseudomonas aeruginosa S2. Biotechnol Prog. 2007;23(3):661-666.
Crossref - Schenk T, Schuphan I, Schmidt B. High-performance liquid chromatographic determination of the rhamnolipids produced by Pseudomonas aeruginosa. J Chromatogr A. 1995;693(1):7-13.
Crossref - Gudina EJ, Rangarajan V, Sen R, Rodrigues LR. Potential therapeutic applications of biosurfactants. Trends Pharmacol Sci. 2013;34(12):667-675.
Crossref - Sineriz F, Hommel RK, Kleber H-P. Production of Biosurfactants. Encyclopedia of Life Support Systems (EOLSS). 2001;05.
- Gaur S, Sahani A, Chattopadhyay P, Gupta S, Jain A. Remediation of Waste Engine Oil Contaminated Soil using Rhamnolipid based Detergent Formulation. Mater Today Proc. 2023;77(1):31-38.
Crossref - Kanekar PP, Kanekar SP, Kelkar AS, Dhakephalkar PK. Halophiles – Taxonomy, Diversity, Physiology and Applications. Microorganisms in Environmental Management. 2012:1-34.
Crossref - Ventosa A, de la Haba RR, Sanchez-Porro C, Papke RT. Microbial diversity of hypersaline environments: a metagenomic approach. Curr Opin Microbiol. 2015;25:80-87.
Crossref - Pacwa-Płociniczak M, Płaza GA, Piotrowska-Seget Z, Cameotra SS. Environmental Applications of Biosurfactants: Recent Advances. Int J Mol Sci. 2011;12(1):633-654.
Crossref - Citarasu T, Thirumalaikumar E, Abinaya P, Babu MM, Uma G. Biosurfactants from halophilic origin and their potential applications. Green Sustainable Process for Chemical and Environmental Engineering and Science. 2021:489-521.
Crossref - Gaur S, Gupta S, Jain A. Production, characterization, and kinetic modeling of biosurfactant synthesis by Pseudomonas aeruginosa gi |KP 163922|: a mechanism perspective. World J Microbiol Biotechnol. 2023;39(7):178.
Crossref - Gaur S, Gupta S, Jain A. Characterization and oil recovery application of biosurfactant produced during bioremediation of waste engine oil by strain Pseudomonas aeruginosa gi|KP 16392| isolated from Sambhar salt lake. Bioremediat J. 2021;25(4):308-325.
Crossref - Irwin JA. Overview of extremophiles and their food and medical applications. Physiological and Biotechnological Aspects of Extremophiles. 2020:65-87.
Crossref - Quadri I, Hassani II, l’Haridon S, Chalopin M, Hacene H, Jebbar M. Characterization and antimicrobial potential of extremely halophilic archaea isolated from hypersaline environments of the Algerian Sahara. Microbiol Res. 2016;186-187:119-131.
Crossref - Thombre RS, Shinde VD, Oke RS, Dhar SK, Shouche YS. Biology and survival of extremely halophilic archaeon Haloarcula marismortui RR12 isolated from Mumbai salterns, India in response to salinity stress. Sci Rep. 2016.
Crossref - Azhar M, Uniyal V, Chauhan N, Rawat DS. Isolation and biochemical characterization of Halophiles from Sahastradhara region, Dehradun, India. Int J Curr Microbiol Appl Sci. 2014;3(12):753-760.
- Haque E, Riyaz MA, Shankar S, Hassan S. Physiochemical and Structural Characterization of Biosurfactant Produced by Halophilic Pseudomonas aeruginosa ENO14 Isolated from Seawater. Int J Pharm Investig. 2020;10(4):437-444.
Crossref - Xu M, Guo J, Sun G. Biodegradation of textile azo dye by Shewanella decolorationis S12 under microaerophilic conditions. Appl Microbiol Biotechnol. 2007;76(3):719-726.
Crossref - Sifour M, H. Al-Jila M, Ghazi MA. Emulsification Properties of Biosurfactant Produced from Pseudomonas aeruginosa RB 28. Pak J Biol Sci. 2007;10(8):1331-1335.
Crossref - Satpute SK, Bhawsar BD, Dhakephalkar PK, Chopade BA. Assessment of different screening methods for selecting biosurfactant producing marine bacteria. Indian J Mar Sci. 2008;37(3):243-250.
- Carrillo PG, Mardaraz C, Pitta-Alvarez SI, Giulietti AM. Isolation and selection of biosurfactant-producing bacteria. World J Microbiol Biotechnol. 1996;12(1):82-84.
Crossref - Youssef NH, Duncan KE, Nagle DP, Savage KN, Knapp RM, McInerney MJ. Comparison of methods to detect biosurfactant production by diverse microorganisms. J Microbiol Methods. 2004;56(3):339-347.
Crossref - El-Shahed MMS, Mohamed SH, Sadik MW, Mabrouk MI, Sedik MZ. Applications of Candida tropicalis Bioactive Biosurfactant Produced Using Simple Substrate Medium. Egypt J Bot. 2022;0(0):0-0.
Crossref - Cha M, Lee N, Kim M, Kim M, Lee S. Heterologous production of Pseudomonas aeruginosa EMS1 biosurfactant in Pseudomonas putida. Bioresour Technol. 2008;99(7):2192-2199.
Crossref - Kiran GS, Hema TA, Gandhimathi R, et al. Optimization and production of a biosurfactant from the sponge-associated marine fungus Aspergillus ustus MSF3. Colloids Surf B Biointerfaces. 2009;73(2):250-256.
Crossref - Bodour AA, Drees KP, Maier RM. Distribution of Biosurfactant-Producing Bacteria in Undisturbed and Contaminated Arid Southwestern Soils. Appl Environ Microbiol. 2003;69(6):3280-3287.
Crossref - Morikawa M, Hirata Y, Imanaka T. A study on the structure-function relationship of lipopeptide biosurfactants. Biochim Biophys Acta. 2000;1488(3):211-218.
Crossref - Singh P, Tiwary BN. Isolation and characterization of glycolipid biosurfactant produced by a Pseudomonas otitidis strain isolated from Chirimiri coal mines, India. Bioresour Bioprocess. 2016;3(1):42.
Crossref - Rosenberg M, Gutnick D, Rosenberg E. Adherence of bacteria to hydrocarbons: A simple method for measuring cell-surface hydrophobicity. FEMS Microbiol Lett. 1980;9(1):29-33.
Crossref - Haba E, Espuny MJ, Busquets M, Manresa A. Screening and production of rhamnolipids by Pseudomonas aeruginosa 47T2 NCIB 40044 from waste frying oils. Journal of Applied Microbiology,2000. 88(3), 379–387.
Crossref - Makkar RS, Cameotra SS. Biosurfactant production by a thermophilic Bacillus subtilis strain. J Ind Microbiol Biotechnol. 1997;18(1):37-42.
Crossref - Santos APP, Silva MDS, Costa EVL, et al. Production and characterization of a biosurfactant produced by Streptomyces sp. DPUA 1559 isolated from lichens of the Amazon region. Braz J Med Biol Res. 2017;51(2):e6657.
Crossref - Weisburg WG, Barns SM, Pelletier DA, Lane DJ. 16S ribosomal DNA amplification for phylogenetic study. J Bacteriol. 1991;173(2):697-703.
Crossref - Parente E, Zotta T, Giavalisco M, Ricciardi A. Metataxonomic insights in the distribution of Lactobacillaceae in foods and food environments. Int J Food Microbiol. 2023;391-393:110124.
Crossref - Altschul SF, Gish W, Miller W, Myers EW, Lipman DJ. Basic local alignment search tool. J Mol Biol. 1990;215(3):403-410.
Crossref - Pruthi V, Cameotra SS. Novel Sucrose Lipid Produced by Serratia marcescens and its Application in Enhanced Oil Recovery. J Surfactants Deterg. 2000;3(4):533-537.
Crossref - Cheng T, Liang J, He J, Hu X, Ge Z, Liu J. A novel rhamnolipid-producing Pseudomonas aeruginosa ZS1 isolate derived from petroleum sludge suitable for bioremediation. AMB Express. 2017.
Crossref - Zhang Y, Miller RM. Enhanced octadecane dispersion and biodegradation by a Pseudomonas rhamnolipid surfactant (biosurfactant). Appl Environ Microbiol. 1992;58(10):3276-3282.
Crossref - Rekadwad B, Maske V, Khobragade CN, Kasbe PS. Production and evaluation of mono- and di-rhamnolipids produced by Pseudomonas aeruginosa VM011. Data Brief. 2019;24:103890.
Crossref - Cooper DG, Goldenberg BG. Surface-Active Agents from Two Bacillus Species. Appl Environ Microbiol. 1987;53(2):224-229.
Crossref - Onwosi CO, Odibo FJC. Rhamnolipid biosurfactant production by Pseudomonas nitroreducens immobilized on Ca2+ alginate beads and under resting cell condition. Ann Microbiol. 2013;63(1):161-165.
Crossref - George S, Jayachandran K. Production and characterization of rhamnolipid biosurfactant from waste frying coconut oil using a novel Pseudomonas aeruginosa D. J Appl Microbiol. 2013;114(2):373-383.
Crossref - Cooper DG, Zajic JE, Gerson DF. Production of surface-active lipids by Corynebacterium lepus. Appl Environ Microbiol. 1979;37(1):4-10.
Crossref - Cooper DG, Macdonald CR, Duff SJ, Kosaric N. Enhanced Production of Surfactin from Bacillus subtilis by Continuous Product Removal and Metal Cation Additions. Appl Environ Microbiol. 1981;42(3):408-412.
Crossref - Pranav H Nakhate, P. A. Optimisation of Rhamnolipid: A New Age Biosurfactant from Pseudomonas aeruginosa MTCC 1688 and its Application in Oil Recovery, Heavy and Toxic Metals Recovery. Journal of Bioprocessing & Biotechniques, 2015;5(5).
Crossref - Sumathi R, Yogannath N. Isolation and identification of Biosurfactant producing Pseudomonas aeruginosa from marine sediment samples and its Antimicrobial Properties. Int J Adv Res Biol Sci. 2016;3(12):200-212.
- Ibrahim HMM. Characterization of biosurfactants produced by novel strains of Ochrobactrum anthropi HM-1 and Citrobacter freundii HM-2 from used engine oil-contaminated soil. Egyptian Journal of Petroleum. 2018;27(1):21-29.
Crossref - Matatkova O, Michailidu J, Jezdik R, et al. Production and Characterization of Rhamnolipids Produced by Pseudomonas aeruginosa DBM 3774: Response Surface Methodology Approach. Microorganisms. 2022;10(7).
Crossref - Zhao F, Wang B, Yuan M, Ren S. Comparative study on antimicrobial activity of mono-rhamnolipid and di-rhamnolipid and exploration of cost-effective antimicrobial agents for agricultural applications. Microb Cell Fact. 2022;21(1):221.
Crossref - Geissler M, Oellig C, Moss K, Schwack W, Henkel M, Hausmann R. High-performance thin-layer chromatography (HPTLC) for the simultaneous quantification of the cyclic lipopeptides Surfactin, Iturin A and Fengycin in culture samples of Bacillus species. J Chromatogr B. 2017;1044-1045:214-224.
Crossref - Das P, Yang XP, Ma LZ. Analysis of biosurfactants from industrially viable Pseudomonas strain isolated from crude oil suggests how rhamnolipids congeners affect emulsification property and antimicrobial activity. Front Microbiol. 2014;5.
Crossref - Faisal ZG, Mayaada SM, Khalid AH. Optimization and Chemical Characterization of Biosurfactant Produced from a Novel Pseudomonas guguanensis Strain Iraqi ZG.K.M. Int J Microbiol. 2023;2023:1-16.
Crossref - Zargar AN, Mishra S, Kumar M, Srivastava P. Isolation and chemical characterization of the biosurfactant produced by Gordonia sp. IITR100. PLoS One. 2022;17(4):e0264202.
Crossref - Elshafie AE, Joshi SJ, Al-Wahaibi YM, et al. Sophorolipids production by Candida bombicola ATCC 22214 and its potential application in microbial enhanced oil recovery. Front Microbiol. 2015;6:01324.
Crossref - Lyu Y, Zhang T, Dou B, Li G, Ma C, Li Y. A lipopeptide biosurfactant from Bacillus sp. Lv13 and their combined effects on biodesulfurization of dibenzothiophene. RSC Adv. 2018;8(68):38787-38791.
Crossref - Stancu MM. Kerosene tolerance in Achromobacter and Pseudomonas species. Ann Microbiol. 2020;70(1):8.
Crossref - Anic I, Apolonia I, Franco P, Wichmann R. Production of rhamnolipids by integrated foam adsorption in a bioreactor system. AMB Express. 2018;8(1):122.
Crossref - Blesken CC, Strumpfler T, Tiso T, Blank LM. Uncoupling Foam Fractionation and Foam Adsorption for Enhanced Biosurfactant Synthesis and Recovery. Microorganisms. 2020;8(12):2029.
Crossref - Satpute SK, Banpurkar AG, Dhakephalkar PK, Banat IM, Chopade BA. Methods for investigating biosurfactants and bioemulsifiers: a review. Crit Rev Biotechnol. 2010;30(2):127-144.
Crossref - Banat IM, Makkar RS, Cameotra SS. Potential commercial applications of microbial surfactants. Appl Microbiol Biotechnol. 2000;53:495-508.
Crossref - Nalini S, Parthasarathi R. Biosurfactant production by Serratia rubidaea SNAU02 isolated from hydrocarbon contaminated soil and its physico-chemical characterization. Bioresour Technol. 2013;147:619-622.
Crossref - Desai JD, Banat IM. Microbial production of surfactants and their commercial potential. Microbiol Mol Biol Rev. 1997;61(1):47-64.
Crossref - Varjani S, Upasani VN Evaluation of rhamnolipid production by a halotolerant novel strain of Pseudomonas aeruginosa. Bioresource Technology, 288, 121577.
Crossref - Rodrigues L, Banat IM, Teixeira J, Oliveira R. Biosurfactants: potential applications in medicine. J Antimicrob Chemother. 2006;57(4):609-618.
Crossref - Phan CW, Abu Bakar NF, Hamzah A. A Comparative Study on Biosurfactant Activity of Crude Oil-Degrading Bacteria and Its Correlation to Total Petroleum Hydrocarbon Degradation. Bioremediat J. 2013;17(4):240-251.
Crossref - Thaniyavarn J, Roongsawang N, Kameyama T, et al. Production and Characterization of Biosurfactants from Bacillus licheniformis F2.2. Biosci Biotechnol Biochem. 2003;67(6):1239-1244.
Crossref - Pinzon NM, Ju LK. Analysis of rhamnolipid biosurfactants by methylene blue complexation. Appl Microbiol Biotechnol. 2009;82(5):975-981.
Crossref - Buonocore C, Tedesco P, Vitale GA, et al. Characterization of a New Mixture of Mono-Rhamnolipids Produced by Pseudomonas gessardii Isolated from Edmonson Point (Antarctica). Marine Drugs,2020 18(5):269.
Crossref - Ruggeri C, Franzetti A, Bestetti G, et al. Isolation and characterisation of surface active compound-producing bacteria from hydrocarbon-contaminated environments. Int Biodeterior Biodegrad. 2009;63(7):936-942.
Crossref - Pansiripat S, Pornsunthorntawee O, Rujiravanit R, Kitiyanan B, Somboonthanate P, Chavadej S. Biosurfactant production by Pseudomonas aeruginosa SP4 using sequencing batch reactors: Effect of oil-to-glucose ratio. Biochem Eng J. 2010;49(2):185-191.
Crossref - Kuiper I, Lagendijk EL, Pickford R, et al. Characterization of two Pseudomonas putida lipopeptide biosurfactants, putisolvin I and II, which inhibit biofilm formation and break down existing biofilms. Mol Microbiol. 2003;51(1):97-113.
Crossref - Camara JMDA, Sousa MASB, Barros Neto EL, Oliveira MCA. Application of rhamnolipid biosurfactant produced by Pseudomonas aeruginosa in microbial-enhanced oil recovery (MEOR). J Pet Explor Prod Technol. 2019;9(3):2333-2341.
Crossref - Chaida A, Chebbi A, Bensalah F, Franzetti A. Isolation and characterization of a novel rhamnolipid producer Pseudomonas sp. LGMS7 from a highly contaminated site in Ain El Arbaa region of Ain Temouchent, Algeria. 3 Biotech. 2021;11(4):200.
Crossref - Zhao F, Jiang H, Sun H, Liu C, Han S, Zhang Y. Production of rhamnolipids with different proportions of mono-rhamnolipids using crude glycerol and a comparison of their application potential for oil recovery from oily sludge. RSC Adv. 2019;9(6):2885-2891.
Crossref - Gaur S, Gupta S, Jha PN, Jain A. Rhamnolipid production by Pseudomonas aeruginosa (SSL-4) on waste engine oil (WEO): Taguchi optimization, soil remediation, and phytotoxicity investigation. Environ Technol. 2024;45(22):4536-4549.
Crossref - Gaur S, Jujaru M, Vennu R, Gupta S, Jain A. Valorization of waste engine oil to mono- and di-rhamnolipid in a sustainable approach to circular bioeconomy. Biodegradation. 2024;35(5):803-818.
Crossref - Jujaru M, Pradhan K, Gaur S, Jain A, Kumar S. Generation of biosurfactants by P. aeruginosa gi |KP163922| on waste engine oil in a free and immobilized cells system. Can J Chem Eng. 2024;102(11):3776-3786.
Crossref - Aydin DC, Icgen B. Monorhamnolipids Predominance among Kerosene Degraders. Journal of Environmental Engineering. 2020;146(6):0001710.
Crossref - Charles OA, Julius KO, Mishra P, Ravinder SJ, Kumar SA, Singh Cameotra, S., & Oluwasesan Micheal, B. (2017). Characterization and optimization of a rhamnolipid from Pseudomonas aeruginosa C1501 with novel biosurfactant activities. Sustainable Chemistry and Pharmacy, 6, 26–36.
Crossref - Antoniou E, Fodelianakis S, Korkakaki E, Kalogerakis N. Biosurfactant production from marine hydrocarbon-degrading consortia and pure bacterial strains using crude oil as carbon source. Front Microbiol. 2015;6.
Crossref - Zhou J, Xue R, Liu S, et al. High Di-rhamnolipid Production using Pseudomonas aeruginosa KT1115, Separation of Mono/Di-rhamnolipids, and Evaluation of Their Properties. Front Bioeng Biotechnol. 2019;7:245.
Crossref - Phulpoto IA, Yu Z, Li J, et al. Evaluation of di-rhamnolipid biosurfactants production by a novel Pseudomonas sp. S1WB: Optimization, characterization and effect on petroleum-hydrocarbon degradation. Ecotoxicol Environ Saf. 2022;242:113892.
Crossref - Abdel-Mawgoud AM, Aboulwafa MM, Hassouna NAH. Characterization of Rhamnolipid Produced by Pseudomonas aeruginosa Isolate Bs20. Appl Biochem Biotechnol. 2009;157(2):329-345.
Crossref
© The Author(s) 2025. Open Access. This article is distributed under the terms of the Creative Commons Attribution 4.0 International License which permits unrestricted use, sharing, distribution, and reproduction in any medium, provided you give appropriate credit to the original author(s) and the source, provide a link to the Creative Commons license, and indicate if changes were made.