ISSN: 0973-7510
E-ISSN: 2581-690X
The present study was focused to study the production of secondary metabolite by the fungus, F. chlamydosporum on a non-defined medium with less concentration of nitrogen; the organic nitrogen source being peptone and beef extract. In this context, we have been successful in extracting a polyketide pigment from the fungus by using the homogenization technique. The pigments thus extracted were subjected to various purification techniques via thin layer chromatography, column chromatography, UV-visible spectrophotometry, fourier-transform infrared spectroscopy and finally molecular determination by liquid chromatography coupled to tandem quadrupole mass spectrometry (LC-MS-MS). The polyketide red pigment was finally characterized and identified to be fusarubin following which its cytotoxicity was evaluated in vitro by using normal lung fibroblast cell lines (MRC-5). In the verge of researchers identifying novel compounds for various applications, the production of fusarubin by the fungus can be a major breakthrough as fusarubin has been investigated to exhibit many pharmacological activities. Though fusarubin is reported to be produced by other Fusarium species, this is the foremost study on the production of fusarubin by F. chlamydosporum; the composition of the culture medium is also unique. The production of this polyketide probably correlates in the pathogenesis of F. chlamydosporum as studies comment on this fungus as an opportunistic pathogen.
Fusarium chlamydosporum, fusarubin, MRC-5 cell line, in vitro cytotoxicity
Fungi occupy diverse environmental niche where they are constantly challenged by stresses such as extreme pH, temperature, UV exposure and nutrient deprivation. Pigments from fungi are usually referred to as secondary metabolites and are not directly involved in their primary growth; however, it is generally considered that they are likely to protect fungi from a variety of adverse environmental factors.1 Fusarium spp. are reported and studied to a vast extend to produce diverse secondary metabolites like gibberellins, carotenoids and polyketides.
Studies have shown that production of fungal secondary metabolites are subjected to variation on due changes in their culture and nutritional changes. Often the optimization of the yield of a specific compound (active metabolite in a medicinal fungus) or from a drug producing microbe is carried out by the variation of culture conditions2 with reference to the OSMAC (One Strain Many Compounds) approach wherein the biodiversity of small number of microbes are fully exploited to. This classical theory of producing many compounds from a single strain has resulted in the finding of many new secondary metabolites.3 The two accepted and widely used approaches of inducing stress for the growth of any microorganism are broadly classified into nutritional parameters and cultural conditions. The nutritional factors involve the manipulation of the ingredients in the culture medium (carbon, nitrogen, phosphorus etc) whereas physical stress conditions are the manipulation of the external/environmental conditions required for the growth of the microorganism.4
Depending on the growth conditions, different species in the genus Fusarium are known to produce two diverse group of pigments; i.e. terpenoids (eg. carotenoids) and polyketides (eg. bikaverin, fusarins). Production of gibberellin (plant hormone) and neurosporaxanthin by F. fujikuroii,5 lycopene from genetically modified (GM) F. sporotrichioides,6,7 neurosporene, lycopene, gamma-carotene and torulene from F. aquaeductuum,8 neurosporaxanthin and β-carotene by F. oxysporum,9 are the studies reported that are related to carotenoid production in Fusarium species. Production of naphthoquinone polyketides (bikaverin and fusarubin), mycotoxins (fusarin and fumonisin) in Fusarium fujikuroi and F. verticilloides; aflatoxin, sanghasporidins A and B in Aspergillus sp. were all reported to be produced in the medium with decreased nitrogen source.5
Fusarium chlamydosporum which has been selected in this study for the production of pigments is commonly found in soils and rhizosphere of numerous vascular plants.10 Though it is non-pathogenic, there has been a sequence of case studies wherein this particular fungus was involved in opportunistic and nosocomial infections. However, there have been no studies so far in pigment production by this fungus. Since the fungus is found in a common habitat of soil and rhizosphere of plants, they could also sustain the adverse environmental conditions which have been exploited in this study.
Culture and media composition
F. chlamydosporum procured from National Fungal Culture Collection of India with the Accession No. 3020 was grown on a non-defined medium with the following composition (Table 1). The inoculated plates were then incubated at ambient laboratory conditions (28 ± 2°C, light) for 7-10 days and observed for pigment production.
Table (1):
Composition of the Culture Medium.
No. |
Composition |
(Carbon Source – 2%) |
Quantity (g L -1) |
|---|---|---|---|
1. |
Glucose |
(Nitrogen |
20.0 |
2. |
Beef extract |
Source – 0.15%) |
0.75 |
3. |
Peptone |
0.75 |
|
4. |
MgSO4.7H20 |
pH – 6.0 |
0.5 |
5. |
KH2PO4 |
0.5 |
|
6. |
K2HPO4 |
Temperature – |
1.0 |
7. |
Distilled water |
28 ± 2 °C |
1000 mL |
Extraction and quantification of intracellular pigment
The extraction of the intracellular bio pigments from the mycelium was carried out according to the method of Velmurugan et al. and Lebeau et al.11,12 The mycelial mat was subjected to centrifugation followed by filtration using Whatmann No.1 filter paper; the intracellular pigment was extracted in ice cold solvent by homogenization. Following extraction, the quantification of the crude pigment extract was studied for 21 days. The extracts were collected, filtered and followed to dryness in a rotary vacuum evaporator.13 The colored crude extract was weighed and the pigment yield was expressed in mg/g of dried weight of mycelial biomass.14
Isolation and purification of pigment extracts
Thin layer chromatography
The crude pigment extract from the medium was subjected to analytical TLC using commercially available silica TLC plate 20 cm x 20 cm (GF 25460; Merck 250 mm thick) according to the procedure laid by Premalatha et al.15 The Retention Factor (Rf) values of each compound were also calculated.
Column chromatography
The isolation of pure compounds was performed by Column Chromatography according to the procedure by Adorisio et al. and Kaaniche et al.16,17 The purity of the compounds was confirmed by TLC by using two different solvent systems.18
UV-Visible spectrophotometry of the pigment extract
The UV-Visible spectrum of the crude pigment was determined by spectrophotometry at room temperature using a UV-Visible absorption spectrophotometer (Schimadzu UV- 1700, pharmaspec) at a wavelength of 200 nm to 800 nm.
Fourier Transform Infrared Spectroscopy
FTIR analysis of the purified compound was performed using the FT-IR spectrometer Spectrum Two (Perkin- Elmer, USA). The absorbance spectra were acquired over the range 450-4000 cm-1 at a resolution of 16 cm-1 with 32 scans per spectrum.
Liquid Chromatography coupled to Tandem Quadrupole Mass Spectrometry (LC- MS-MS)
The chromatographic separation was carried out using LC-MS 8040 tandem quadrupole mass spectrometer (Shimadzu, Kyoto, Japan). Data acquisition and analyses control was carried out by Labsolutions LCMS software (Shimadzu). The chromatographic run was performed using Agilent Zorbax SB-C18 (4.6 mm ID x 250 mm,5 um) reverse phase column. A gradient elution was carried out starting from 10% acetonitrile and 90% formic acid for 0.01 min followed by 90% acetonitrile and 10% formic acid for another 35 min; reverted to the initial gradient of 10% acetonitrile and 90% formic acid till the end of the run. Intensity response of the compounds was checked in both positive and negative ionization modes over a mass range from 50-1000 Da at 4 GHz high resolution mode.
In vitro cytotoxicity determination by MTT assay
In vitro cytotoxicity of the purified pigment was evaluated in normal human lung fibroblast (MRC-5) cell line procured from National Centre for Cell Sciences (NCCS), Pune, India. The cells were maintained in Dulbecco’s modified Eagles medium (DMEM), Sigma Aldrich, USA.
Cytotoxicity assay by Direct Microscopy
After 24 h of treatment, cytotoxicity of the treated and untreated cells was evaluated in an inverted phase contrast tissue culture microscope (Olympus CKX41 with Optika Pro5 CCD camera).
Cytotoxicity assay by MTT Method
Cytotoxicity was determined by MTT assay.19 Confluent cells (60 – 70%) were treated with 30 µL of MTT solution followed by the measurement of absorbance values at 540 nm. The IC50 values were calculated.
Statistical analysis
The experiments were performed in triplicates and the results are expressed as Mean ± SD (n=3). The results were analyzed for statistical significance using unpaired Student’s T-test (SPSS Inc. 20.0 version). Probability values (P) ≤ 0.05 were considered to be statistically significant.
Pigment production of F. chlamydosporum
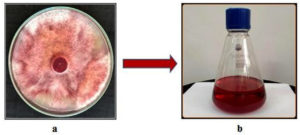
The fungal culture exhibited abundant off-white aerial mycelium interspersed by deep red pigmentation and the reverse culture was intense red or golden brown.
Extraction and quantification of the colored crude extract
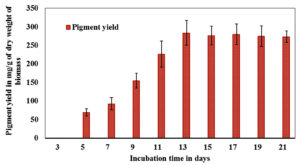
Among the different solvents (hexane, chloroform, dichloromethane, ethyl acetate and methanol) from the non-polar to polar category used for the extraction process, chloroform gave a better result. The pigment extracted was of a red hue (Fig. 1). Following extraction, quantification of the extract was done on all alternative days wherein a higher yield of colored crude extract was recorded on the 13th day of incubation with a yield of 280 mg/g of dry weight of biomass (Fig. 2).
Fig. 2. Effect of incubation time on colored crude extract of F. chlamydosporum. Data shown represent the mean values of three experiments ± SD.
Purification and isolation of crude pigment extract of F. chlamydosporum
Thin Layer Chromatography (TLC)
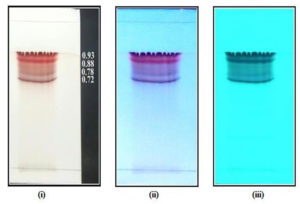
The pigment extracted from the medium was separated on a silica gel TLC plate with standardized mobile phase of chloroform: methanol: formic acid (8.5: 1.5: 0.1 v/v) (Fig. 3) wherein the pigment extract separated into 4 distinct bands. The TLC plates were visualized under Visible light and UV of long and short wavelength. The corresponding Rf values were also recorded.
Fig. 3. Separated pigments from nitrogen limited medium on TLC plate visualized under (i) Visible light; (ii) long length UV light; (iii) short length UV light.
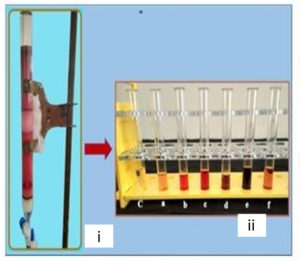
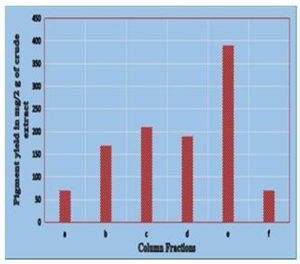
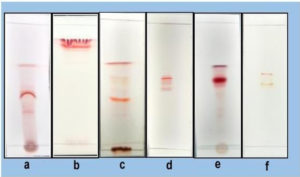
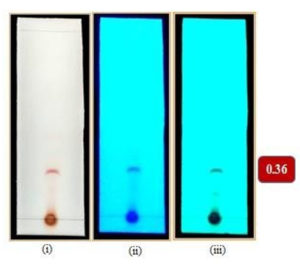
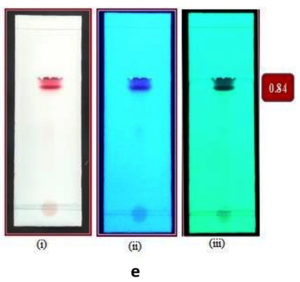
Column Chromatography: The crude pigment extract (2 g) was subjected to column chromatography wherein the gradient elution was carried out on silica gel consisting of chloroform-methanol-formic acid (8.5: 1.5: 0.1 v/v), chloroform-methanol (7: 3 v/v) and finally 100% methanol with gradually increasing the polarity. The pigment extract was separated into 6 fractions (a-f): a (70 mg), b (170 mg), c (210 mg), d (190 mg), e (390 mg), f (70 mg) (Fig. 4a). The quantification of all the eluted fractions was followed by TLC screening for the distinct separation of the compounds (Fig. 4b & 4c). The sub- fractionation of the fractionated compound of the highest yield (fraction ‘e’) was carried out on a silica gel column by isocratic elution with dichloromethane: methanol (9: 1 v/v). Repeated chromatographic purification of fraction ‘e’ afforded 4 major fractions: e1 (30 mg), e2 (60 mg), e3 (190 mg), e4 (30 mg). The sub fractionated compound ‘e3’ was chromatographed using two-way combinations of different solvent systems; i.e. dichloromethane: methanol (9.5: 0.5 v/v) and chloroform: methanol: water: acetic acid (6.5: 2.5: 0.5: 0.1 v/v). In both the solvent systems, fraction ‘e3’ formed a single compact spot on the TLC plate (Fig. 4d and 4e).
Fig. 4a. (i). Separation of compounds from crude extract in nitrogen limited medium (ii) Collected fractions (a-f).
Fig. 4d. TLC chromatogram of subfraction under (i) visible light; UV (ii) long wavelength (iii) short wavelength with the Rf value 0.36; solvent system dichloromethane : methanol (9.5: 0.5).
Fig. 4e. TLC chromatogram of subfraction ‘e3’ under (i) visible light; UV (ii) long wavelength (iii) short wavelength with the Rf value 0.84; solvent system chloroform: methanol: water: acetic acid (6.5: 2.5: 0.5: 0.1).
Characterization of the purified pigment
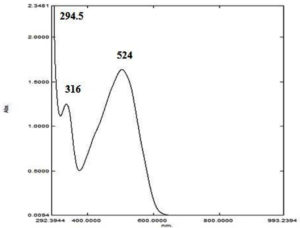
UV-Visible Spectrophotometry: The absorption spectra of the sub-fraction, ‘e3’ over the wavelength range of 200 to 1000 nm yielded peaks at 294.5, 316, and 524 nm (Fig. 5).
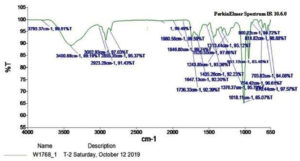
Fourier Transform Infrared Spectroscopy (FTIR) Analysis: Based on the FTIR spectroscopic analysis of subfraction e3, (Fig. 6), the absorption bands comprised in the domain 1018 and 1243 cm-1 corresponded to C=C, the signal frequency obtained between 900 and 951 cm-1 corresponded to aromatic ring system substitutions. The absorption band at 3400 and 3793 cm-1 indicated the presence of an OH group while that at 2923 and 2855 cm-1 correspond to alkyl C-H bonds. The presence of C-C stretching vibration of phenyl groups were confirmed with the obtained absorption at 1313, 1376, and 1435 cm-1. The obtained signal frequency at 1647 and 1736 cm-1 corresponded to carbonyl stretching (C=O) vibration of phenyl groups; 703 cm-1 attributed to the presence of benzene derivative.
Characterization of fraction e3 by LC-MS analysis
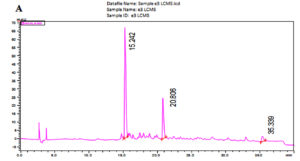
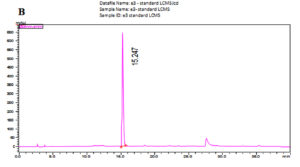
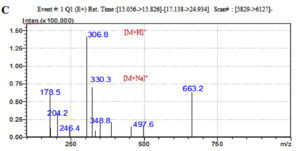
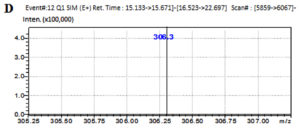
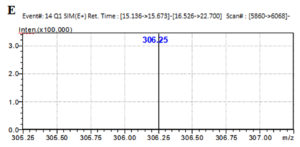
The LC-MS analysis of the subfractionated purified compound e3 of F. chlamydosporum was characterized to be a polyketide naphthoquinone, Fusarubin whose Retention time was observed at 15.242 min with respect to the standard at 15.247 min (Fig. 7A & B). Fusarubin is an aromatic polyketide compound comprising of fused ring polyphenols from a poly-β-ketone backbone with the molecular structure C15H14O7 and molecular weight 306.27 gmol-1. A good mass spectrometric response was obtained in the positive ionization mode; the mass to charge spectral peak was observed at 306.8 (M+H)+ and 330.3 (M+Na)+ which is illustrated in Fig. 7C. The accurate mass of fraction e3 by Selected Ion Monitoring (SIM) was determined to be 306.3 with respect to the standard 306.25 (Fig. 7D & E)
Fig. 7. Chromatogram of (A) Fraction e3- fusarubin with the Rt 15.242 min and (B) Standard fusarubin with the Rt 15.247 min; (C) LC-MS spectrum of e3- fusarubin with the positive ion radical 306.8 (M+H)+ and 330.3 (M+Na)+; (D) LCMS spectrum of e3-fusarubin in SIM mode with m/z of 306.3 and (E) standard fusarubin in SIM mode with m/z 306.25.
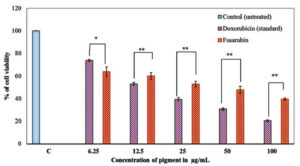
Fig. 8. Cytotoxicity of fusarubin on MRC-5 cell lines. Data shown represent the mean values of three experiments ± SD. *P ≤ 0.05, **P ≤ 0.01, statistically significant in comparison with the standard doxorubicin at different concentrations analyzed by T-test using SPSS for windows (SPSS Inc.) 20.0 version.
Cytotoxicity of fusarubin
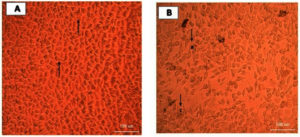
The toxicity of fusarubin was tested on normal human lung fibroblast cell lines (MRC-5) with the anti-cancer compound doxorubicin as the positive control whilst the well without any of the pigments served as the negative control. Upon MTT assay, the IC50 of fusarubin was found to be 40.857 µg/mL; the cytotoxicity of fusarubin was lower to that of the anti-cancer compound doxorubicin with IC50 value of 25.063 µg/mL (Fig. 8). The changes in the cell morphology on pigment treatment in various concentrations are shown in the Fig. 9.
Fig. 9. Microscopic examination of untreated and treated MRC-5 cells with fusarubin under 40x magnification; A. Untreated control cells exhibiting spindle shaped morphology; B. Arrows indicate (a) rounding of cells and (c) granulation and vacuolization in the cytoplasm of the cells which are considered as indicators of cytotoxicity.
The source of nitrogen in the culture media plays a very significant role in the growth and pigment production of fungi. With respect to this, peptone and beef extract have been used in our study as the nitrogen source (organic) in the culture medium for pigment production. This finding was in consistent with the previous studies wherein induction of nitrogen limitation paved the way for the synthesis of different secondary metabolites (gibberellins, bikaverin, fusarubin) by Fusarium spp. through a complex regulatory network.8,20
The production of fusarubin is favoured in nitrogen limited conditions as reported by Atanasova et al. and Avalos et al.22,21 which holds good also in this study wherein fusarubin was produced by F. chlamydosporum in a nitrogen scarce medium, wherein the C: N ratio was 2: 0.15.
In the present characterization study of F. chlamydosporum pigment, the UV-spectrum analysis with the absorbance values 294.5, 316, and 524 corresponded to that of a polyketide wherein the absorbances were characteristic of a naphthoquinone chromophore.23-25 The analysis of the purified pigment in two distinct solvent systems of the Rf value within the range 0.31-0.37 and 0.79-0.85 were similar to the Rf values of fusarubin in previous studies.18,26 The functional group analysis of fusarubin by FTIR was also supported by the previous studies reported by Gerber et al., Premalatha et al. and Khan et al.23,15,25
The summary of chemical characterization of Fusarubin is shown below:
Compound e3 (Fusarubin)
Dark red color; soluble in chloroform, dichloromethane, ethyl acetate; sparingly soluble in methanol and insoluble in water; UV lmax 294.5, 316 and 524 nm; TLC CH2Cl2: CH3OH (9.5: 0.5) Rt- 0.36; IR: 3793, 3400 (O-H), 3002, 2923, 2855 (C-H), 2144 (C=C=O), 1980,1846,1736, 1647 (C=O), 1520, 1435, 1376, 1313, 1243, 1048 (C=C), 814, 754, 670 cm-1(C-Hbending); MS: m/z 306.8 (M+H)+, 330.3 (M+Na)+, SIM mode m/z 306.3).
ACKNOWLEDGMENTS
The authors would like to thank Department of Microbiology, Bangalore University for carrying out the current work. The authors would also like to thank NMIMS College of Pharmacy, for allowing us for carried out the LCMS and Biogenix Research Centre, Trivandrum for the cytotoxic study.
CONFLICT OF INTEREST
The authors declare that there is no conflict of interest.
AUTHORS’ CONTRIBUTION
Both the authors listed have made a substantial, direct and intellectual contribution to the work, and approved it for publication.
FUNDING
None.
ETHICS STATEMENT
This article does not contain any studies with human participants or animals performed by any of the authors.
AVAILABILITY OF DATA
Not applicable.
- Fouillaud M, Venkatachalam M, Llorente M, Magalon H, Cuet P, Dufosse L. Biodiversity of pigmented fungi isolated from marine environment in La Reunion Island, Indian ocean: New resources for colored metabolites. J Fungi. 2017;3(3):36.
Crossref - VanderMolen KM, Raja HA, Elimat T, Oberlies NH. Evaluation of culture media for the production of secondary metabolites in a natural products screening program. Amb Express. 2013;3(1):71.
Crossref - Craney A, Ahmed S, Nodwell J. Towards a new science of secondary metabolism. J Antibiot. 2013;66(7):387-400.
Crossref - Benavente-Valdes JR, Aguilar C, Contreras-Esquivel, Mendez-Zavala A, Montanez J. Strategies to enhance the production of photosynthetic pigments and lipids in chlorophycae species. Biotechnol Rep. 2016;10:117-125.
Crossref - Tudzynski B. Nitrogen regulation of fungal secondary metabolism in fungi. Front Microbiol. 2014;5:656.
Crossref - Dufosse L. Microbial production of food grade pigments. Food Technol Biotechnol. 2006;3:313-323.
- Kirti K, Amita S, Priti S, Mukesh Kumar A, Jyoti S. Colorful world of microbes: carotenoids and their applications. Adv Biol. 2014;2014:837891.
Crossref - Avalos J, Prado-Cabrero A, Estrada AF. Neurosporaxanthin production by Neurospora and Fusarium. Methods Mol Biol. 2012;898:263-274.
Crossref - Parra-Rivero O, Pardo-Medina J, Guttierez G, Limon M, Avalos J. A novel Inc RnA as positive regulator of carotenoid biosynthesis in Fusarium. Sci Rep. 2020;10(1):1-14.
Crossref - Guarro J. Fusariosis, a complex infection caused by a high diversity of fungal species refractory to treatment. Eur J Clin Microbiol Infect Dis 2013;32(12):1491-1500.
Crossref - Velmurugan P, Lee YH, Venil CK, Lakshmanaperumalsamy P, Chae JC, Oh BT. Effect of light on growth, intracellular and extracellular pigment production by five pigment- producing filamentous fungi in synthetic medium. J Biosci Bioeng. 2010;109(4):346-350.
Crossref - Lebeau J, Venkatachalam M, Fouillaud M, et al. Production and new extraction method of polyketide red pigments produced by ascomycetous fungi from terrestrial and marine habitats. J Fungi. 2017;3(3):34.
Crossref - Narendrababu BN, Shishupala S. Spectrophotometric detection of pigments from Aspergillus and Penicillium isolates. J Appl Biol Biotechnol. 2017;1:53-58.
Crossref - Soumya K, Narasimha Murthy, Sreelatha GL, Tirumale S. Characterization of a red pigment from Fusarium chlamydosporum exhibiting selective cytotoxicity against human breast cancer MCF 7 cell lines. J Appl Microbiol. 2018;125(1):148-158.
Crossref - Premalatha B, Pradeep FS, Pradeep BV, Palaniswamy M. Production and characterization of naphthoquinone pigment from Fusarium moniliforme MTCC6985. World J Pharm Res. 2012;4:1126-1142.
- Adorisio S, Fierabracci A, Muscari I, et al. Fusarubin and anhydrofusarubin isolated from a Cladosporium species inhibit cell growth in human cancer cell lines. Toxins. 2019;11(9):503.
Crossref - Kaaniche F, Hamed A, Abdel-Razek AS, et al. Bioactive secondary metabolites from new endophytic fungus Curvularia. sp isolated from Rauwolfia macrophylla. PLoS One. 2019;14(6):e0217627.
Crossref - Marcinkowska J, Kraft J, Marquis L. Phytotoxic effects of cell-free cultural filtrates of Fusarium solani isolates on virulence, host specificity and resistance. Can J Plant Sci. 1982;62(4):1027-1035.
Crossref - Talarico LB, Zibetti RG, Faria PC, Scolaro LA, Duarte ME, Damonte EB. Anti-herpes simplex virus activity of sulfated galactans from the red seaweeds Gymnogongrus griffithsiae and Cryptonemia crenulata. Int J Biol Macromol. 2004;34(1-2):63-71.
Crossref - Bell AA, Wheeler MH, Liu J, Orta H. United States Department of Agriculture – Agricultural Research Service studies on polyketide toxins of Fusarium oxysporum f sp vasinfectum: Potential targets for disease control. Pest Manage Sci. 2003;6:736-747.
Crossref - Avalos J, Pardo-Medina, Parra-Rivero O, et al. Carotenoid biosynthesis in Fusarium. J Fungi. 2017;3:39.
Crossref - Atanasova L, Knox BP, Kubicek CP, Baker SE. The polyketide synthase gene pks4 of Trichoderma reesei provides pigmentation and stress resistance. Eukaryot Cell. 2013;12(11):1499-1508.
Crossref - Gerber NN, Ammar MS. New antibiotic pigments related to fusarubin from Fusarium solani (mart.). J Antibiot. 1979;32(7):685-688.
Crossref - Kurobane I, Vining LC, Mcinnes AG, Gerber NN. Metabolites of Fusarium solani related to dihydrofusarubin. J Antibiot. 1980;33(11):1376-1379.
Crossref - Khan N, Afroz F, Begum MN, et al. Endophytic Fusarium solani: A rich source of cytotoxic and antimicrobial napthaquinone and aza-anthraquinone derivatives. Toxicol Rep. 2018;5:970-976.
Crossref - Parisot D, Devys M, Barbier M. 5-Deoxybostrycoidin, a New Metabolite Produced by the Fungus Nectria haematococca Wr. Zeitschrift fur Naturforschung B. 1989;11:1473-1474.
Crossref
© The Author(s) 2022. Open Access. This article is distributed under the terms of the Creative Commons Attribution 4.0 International License which permits unrestricted use, sharing, distribution, and reproduction in any medium, provided you give appropriate credit to the original author(s) and the source, provide a link to the Creative Commons license, and indicate if changes were made.


