

ISSN: 0973-7510
E-ISSN: 2581-690X
Laccases are multi copper oxidases having wide substrate specificity for phenolic compounds, amines, inorganic compounds like iodine, using oxygen and producing water as by product. The aim of this study is to produce, characterize and purify laccase from yeast isolated from different samples. Yeast isolates were screened for laccase production using tannic acid, catechol, hydroquinone and acetaminophen. Two isolates from soil were selected for further study based on their positive response to screening compounds. Maximum laccase production was achieved with glucose as the best carbon source (10g/l) for Kluyveromyces sp.Dw1 and maltose for Pichia sp.Dw2; Sodium nitrate (3g/l) as the best nitrogen source, optimum pH of 6.0, optimum temperature of 30°C and 35°C for Kluyveromyces sp.Dw1 and Pichia sp.Dw2 respectively. Rice bran supported the highest laccase production of 88.625U/L in Kluyveromyces sp.Dw1 and cane bagasse (79.107U/L) in Pichia sp.Dw2. The addition of inducers like copper sulphate and acetaminophen stimulated maximum laccase production. Maximum activity recorded at pH 9.0, 30°C and 50°C temperature for Kluyveromyces sp.Dw1 and Pichia sp.Dw2 respectively. Laccase activity was retained in the presence of Ca2+, K+, Hg+, EDTA and Benzoic acid. Kluyveromyces sp.Dw1 had Km value of 0.08mM and 0.13mM for Pichia sp.Dw2 using ABTS as substrate. From this study, Kluyveromyces dobzhanskii Dw1 and Pichia manshurica Dw2 produced laccase that oxidized ABTS with higher laccase production using agro wastes and inducers.
Kluyveromyces dobzhanskii, Pichia manshurica, ABTS, Oxidation, lignocellulosic substrates.
Laccases are multi copper oxidases of oxidoreductase family with EC 1.10.3.2. They mostly occur in higher plants and fungi 1,2(Mayer and Staples, 2002; Thurston, 1994), but recently some bacterial laccases have also been characterized from Streptomyces lavendulae 3(Suzuki et al., 2003), Azospirillum lipoferum 4(Givaudan et al., 1993), Bacillus subtilis 5(Martins et al., 2002), and S. cyaneus 6(Arias et al., 2003). Most of the laccases studied thus far are of fungal origin, especially from white-rot fungi, such as Phlebia radiata 7(Niku-Paavola et al., 1988), Pleurotus ostreatus 8(Palmieri et al., 2000) and Trametes versicolor 9(Bourbonnais et al., 1995). These fungal laccases carry out many physiological roles including degradation of lignocellulosic materials, pigment production and plant pathogenesis 2(Thurston, 1994). It is misleading to conclude that laccases are extracellular enzymes generally present in most fungal species. Although laccase activity has been demonstrated in many fungal species and the enzyme has already been purified from most of these species, however, there are many taxonomic or physiological groups of fungi that typically do not produce significant amounts of laccase or where laccase is only produced by a few species 10(Baldrian, 2004).
Unlike most enzymes that are substrate specific, laccases oxidize a surprisingly wide variety of organic and inorganic compounds, including diphenols, polyphenols, substituted phenols, diamines and aromatic amines, with concomitant reduction of molecular oxygen to water 2(Thurston,1994). This attribute confers many biotechnological applications on laccases and thus make research on laccase production to be intensified. Indeed, for industrial applications, efforts are channelled towards discovering laccases with different substrate specificities and improved stabilities from other microbial sources that are previously not reported. Furthermore, large variety of potential substrates has raised interest in the use of laccases in several industrial applications, such as pulp delignification, textile dye bleaching, effluent detoxification, biopolymer modification and bioremediation 11,12(Gianfreda et al., 1999; Xu, 1999). Modern application is in nanobiotechnology due to their ability to catalyse electron transfer reactions without additional cofactor 13(Shraddha et al., 2011).
So far, the only yeast laccase purified was from the human pathogen Cryptococcus (Filobasidiella) neoformans; a true laccase capable of oxidation of phenols and aminophenols but not tyrosine 14(Williamson, 1994). This cell wall bound enzyme contributes to the resistance of the organism to fungicides 15,16(Zhu et al., 2001; Ikeda et al., 2003). There are some records of low laccase-like activity in some yeast species isolated from decayed wood 17(Jimenez et al., 1991). Also, plasma membrane-bound multicopper oxidase Fet3p from Saccharomyces cerevisiae which shows both sequence and structural homology with fungal laccase was demonstrated in ascomycetous yeasts. Attempt to produce laccase from yeasts, which even yielded a low amount, has been with the use of recombinant engineering. Few of such demonstrations were done for heterologous expression in the yeasts Pichia pastoris 18(Jonsson et al., 1998) and S. cerevisiae 19(Cassland and Jonsson. 1999).
Due to the usefulness of laccase, the technical interest of this research is to investigate whether the methods used for enhancing laccase production can be applied to wild strains of yeasts. This aims at reducing production cost, boost enzyme yield and in turn increase the diversity of laccase-producing microorganisms. This will be geared towards optimizing growth conditions: modifying culture media, adjusting environmental parameters (e.g. temperature, pH) and by incorporating inducer molecules (e.g. copper, catechol, tannic acid). This method has been achieved successfully in filamentous fungi 20(Terron et al., 2004) since satisfying heterologous over-expression and production of ligninolytic enzymes is still a challenge 21,22(Couto and Herrera, 2006; 2007).
The screening of microbes for laccase production have been done either on solid media containing coloured indicator compounds that enable the visual detection 23,24,25(Nishida et al., 1988; De Jong et al., 1992; Barbosa et al., 1996) or with liquid cultivations monitored with enzyme activity measurements 26(Luterek et al., 1997). Various screening methods have been employed to discover promising producers of ligninolytic enzymes in many classes of fungi, some of which will be employed for yeasts in this work.
Sources of Isolation
The yeast isolates used for this study were isolated from decomposing saw dusts and decaying soils from different locations in Ibadan, South West Nigeria (Longitude 4.0o 58´ 50´´E, Latitude 5.0o25´ 43´´N). The samples were collected in sterile containers and brought to the laboratory for further processing.
Isolation of yeasts
The samples from the above sources of isolation were serially diluted tenfold 27(Harrigan and MacCance, 1966). One millilitre of higher dilutions of each sample was inoculated into sterile glucose yeast extract agar to which streptomycin sulphate antibiotic (Shanxi Zhendong, China) at 100mg/L concentration has been added to prevent bacterial contamination. The inoculated glucose yeast extract agar medium (glucose- 10.0, yeast extract- 3.0, peptone- 5.0, and agar- 15.0 in gram/litre) plates were gently swirled for even spread and incubated at 30±2oC for 48 hours under aerobic condition. Representative colonies of yeast growth were randomly selected and sub-cultured 2-3 times on sterile glucose yeast extract agar plates, till pure colonies of isolates were obtained.
Screening of laccase-producing yeasts
Qualitative screening of laccase in solid medium
The yeast isolates obtained were screened qualitatively in the following indicator compounds; 0.5% (w/v) tannic acid 28(Kiiskinen et al., 2004), hydroquinone, acetaminophen and catechol (0.02% w/v). All except tannic acid were sterilized with the agar medium using autoclave (LAB1220 model). Tannic acid was sterilized separately at 121oC using autoclave for 15 minutes and allowed to cool for 5 minutes before addition to the agar medium while ABTS was membrane filter- sterilized (Minisart®). The isolated pure yeast strains were inoculated by stabbing on the cooled, sterile, laccase screening medium prepared and incubated aerobically at 30±2oC for 48hours. Observation of the formation of coloured halo around the yeast colonies signifies the production of laccase.
Production of laccase in liquid medium
The isolates with the best potential for laccase production based on their response to qualitative screening were used. The glucose yeast extract peptone-copper sulphate broth medium used contained the following in gram/litre: glucose (10.0), yeast extract (5.0), peptone (3.0) and copper sulphate (0.1) dissolved in citrate phosphate buffer of pH 5.0 29, 30(Cavallazzi et al., 2005; Raghunathan, 2011). This was sterilized using autoclave (LAB 1220 model), followed by inoculation with 1ml of 48-hour old yeast culture and incubated at 30±2°C for 8 days. 2ml of growth culture was aseptically withdrawn every 48 hour and centrifuged using micro-centrifuge (MIKRO 220R, Hettich) at 13,000rpm for 15 minutes at 4oC after the introduction of sterile glass beads (5% w/v). The supernatants were collected and used for enzyme assay. This procedure was followed in this research for subsequent enzyme production.
Quantification of Laccase activity
Laccase assay was carried out using the modified method of 31Mongkolthanaruk et al (2012). It involved the spectrophotometric measurement of the oxidation of 2, 2′-azino-bis (3-ethylbenzthiazoline-6-sulfonic acid) (ABTS; SIGMA, St. Louis, USA) at 30oC. The reaction mixture contained 280µL enzyme extract, 180µL sodium acetate buffer pH 5.0 (0.1 M) and 60µL ABTS solution (1mM). The reaction was stopped using 20µl of 5% Trichloroacetic acid (TCA) after 10minutes. In each assay (except otherwise stated), the blank contained all the reaction mixture components except enzyme extract which was replaced with corresponding volume of sterile distilled water. Oxidation was followed via the increase in absorbance at 420nm (e420 = 36,000 M-1 cm-1) using spectrophotometer (JENWAY, 6405 UV/VIS). One unit of enzyme activity was defined as the amount of enzyme oxidizing 1mmol of ABTS per minute.
Laccase enzyme production under different environmental conditions
Effect of carbon source on laccase enzyme production
Different carbon sources (glucose, sucrose, maltose, fructose and starch) were added at the concentration of 1% (w/v) to yeast extract peptone-copper sulphate broth medium. The medium was sterilized and inoculated with1mL of 48-hour old yeast culture. 2mL of growth culture was withdrawn every 48 hour and assayed using modified method of 31Mongkolthanaruk et al (2012) as earlier described.
Effect of nitrogen source on laccase enzyme production
Basal medium containing glucose- 10, copper sulphate- 0.1 in (g/L) dissolved in citrate phosphate buffer at pH 5.0 was used. Various nitrogen sources including peptone, yeast extract, ammonium sulphate, sodium nitrate and potassium nitrate were added singly to basal medium at the concentration of 0.3% (w/v) as sole nitrogen source, sterilized and inoculated with1mL of 48-hour old yeast culture. 2mL of growth culture was withdrawn every 48 hour and assayed using modified method of 31Mongkolthanaruk et al. (2012).
Effect of different pH on laccase enzyme production
The effect of different pH values (3.0, 4.0, 5.0 and 6.0) on laccase production was monitored. The best carbon and nitrogen sources obtained above were used in the preparation of new laccase production medium which contained the following in g/L; glucose- 10, sodium nitrate- 3, copper sulphate- 0.1. The composition was dissolved in citrate phosphate buffer prepared at the above pH values. The medium was sterilized before inoculation with yeast culture. 2mL of growth culture was withdrawn every 48 hour and assayed using modified method of 31Mongkolthanaruk et al (2012).
Effect of different temperature on laccase enzyme production
The effect of different incubation temperatures (25oC, 30oC, 35oC and 37oC) on laccase production was carried out in a sterile medium with composition as stated above. The medium was inoculated with 1mL of 48-hour old yeast culture and incubated at above temperatures. 2mL of growth culture was withdrawn every 48 hour and assayed using modified method of 31Mongkolthanaruk et al (2012).
Effect of different Agro wastes on enzyme production
Various complex organic carbon sources (lignocellulosic agro wastes) including plantain peel, wheat bran, rice bran, sugarcane bagasse, corn cob and maize stover were used as sole carbon source at 1% concentration (w/v). These were introduced into the basal medium (sodium nitrate- 3g/L, copper sulphate- 0.1g/L, dissolved in citrate phosphate buffer at pH 5.0). This was sterilized and inoculated with yeast cell culture. 2mL of growth culture was withdrawn every 48 hour and assayed using modified method of 31Mongkolthanaruk et al (2012).
Effect of different inducers on laccase enzyme production
The effect of various laccase inducers like copper sulphate, tannic acid, catechol, hydroquinone, acetaminophen and pyrogallol on laccase production was carried out by adding 0.02% (w/v) concentration of each into the production medium separately. The medium (glucose- 10g/L, sodium nitrate- 3g/L, copper sulphate- 0.1g/L, dissolved in citrate phosphate buffer at pH 5.0) was sterilized and inoculated with yeast cell culture. 2mL of growth culture was withdrawn every 48 hour and assayed using modified method of 31Mongkolthanaruk et al (2012).
Optimization studies for laccase enzyme production and activity
After the screening of the various parameters, the best carbon source and nitrogen source for laccase production by the yeast isolates were optimized. These were glucose and sodium nitrate.
The effect of different concentrations of glucose on laccase production
Different glucose concentrations (0.1%, 0.5%, 1.0%, 1.5% and 2.0% w/v) were added to the basal medium (sodium nitrate- 0.3%, copper sulphate- 0.01%, dissolved in citrate phosphate buffer at pH 5.0). After sterilization, yeast culture was added to the medium and incubated at 30oC. 2mL of growth culture was withdrawn every 48 hour and assayed using modified method of 31Mongkolthanaruk et al (2012).
The effect of different concentrations of sodium nitrate on laccase production
Different concentrations (0.1%, 0.2%, 0.3%, 0.4% and 0.5% w/v) of sodium nitrate were added to the basal medium (glucose-1%, copper sulphate- 0.01%, dissolved in citrate phosphate buffer at pH 5.0). After sterilization, yeast culture was added to the medium and incubated at 30oC. 2mL of growth culture was withdrawn every 48 hour and assayed using modified method of 31Mongkolthanaruk et al (2012).
Characterization of crude laccase enzyme
The optimum pH determination and pH stability studies of the crude laccase
The optimum pH was determined by measuring laccase activity over a pH range of 3.0 to 9.0 using ABTS as substrate. The pH gradient was obtained by citrate phosphate buffer (3.0 to 8.0) and citrate carbonate buffer (9.0). The assay mixture which contained equal volume of the crude enzyme and each buffer at various pH values was incubated at room temperature for 10 minutes, and the determination of laccase activity was done using modified method of 31Mongkolthanaruk et al (2012).
To investigate the effect of pH on enzyme stability, equal volume of the crude enzyme and each of the buffers of various pH values was incubated at room temperature for 60 minutes and then residual laccase activity assay was determined using the method of 31Mongkolthanaruk et al (2012).
The optimum temperature determination and temperature stability studies of the crude laccase
To determine the optimum temperature, laccase activity was measured over a temperature range of 300C to 90°C. This was done by incubating the assay components at the various temperature values using water-bath (MRC, England) for 10 minutes. After incubation, laccase activity assay was determined using modified method of 31Mongkolthanaruk et al (2012).
To investigate the effect of temperature on laccase stability, laccase activity was determined at the following incubation time intervals: 10, 15, 30, 45 and 60 minutes using ABTS as substrate according to modified method of 31Mongkolthanaruk et al (2012) at optimal pH over a temperature range of 300 to 900C 32(Ding et al., 2012).
Effect of different metal ions and surfactant concentrations on the enzyme activity
The effect of different metals, surfactants and chelating agents at different concentrations on laccase activity was investigated. These materials include Ba2+, Ca2+, Hg2+, Li2+, K+, Na2+, Fe3+, benzoic acid, urea, Dinitrophenol and ethylene diamine tetrachloroacetic acid (EDTA) were prepared at different concentrations (0.1mM, 0.5mM, 1mM and 5mM) and each was included as component of enzyme-substrate mixture i.e. one concentration of each per vial. The mixture was incubated at room temperature for 60 minutes 33(Saito et al., 2004). Laccase activity was determined according to modified method of 31Mongkolthanaruk et al. (2012).
Effect of different enzyme volumes on laccase enzyme activity
To determine the effect of enzyme concentration on laccase activity, different volumes (180-980µL) of the crude enzyme were used for the assay. The blank was prepared by adding ABTS to equal volume (as the enzyme) of distilled water and subjected to same condition as the experimental. Laccase activity was done according to modified method of 31Mongkolthanaruk et al. (2012).
Kinetic properties of laccase
To determine the Michaelis-Menten constant (Km) of laccase, varying concentrations of ABTS substrate solution were mixed with the crude laccase. Laccase activity was determined according to the modified method of 31Mongkolthanaruk et al. (2012). The enzyme affinity (Km; a ratio of slope to intercept) and the maximum velocity (Vmax; the reciprocal of intercept) were derived from the graph of the reciprocal of laccase activity (1/V) against that of substrate concentration (1/S).
Purification of laccase enzyme
The purification of laccase enzyme was done according to the method of 32Ding et al (2012). The crude laccase was purified using Ammonium sulphate (NH4)2SO4 precipitation in which the salt (NH4)2SO4 was used to remove hybrid proteins from the fermentation broth at two levels of saturation: 40% first, followed by 80%. On each occasion, the precipitate was obtained by centrifugation at 5,000rpm for 10 minutes. Obtained filtrate was utilised for the second step.
The pooled protein precipitate from first and second steps was made up to the initial crude enzyme volume by addition of sodium acetate pH 5.0. It was dialyzed in the same buffer solution to remove (NH4)2SO4 and other non-enzymic materials. The precipitate was dispensed into dialysis tube, well tightened at both ends to create tugor pressure in the tube and submerged in citrate phosphate buffer (pH 5.0) for 24hours in refrigerated condition. The desalted enzyme solution (dialysate) was applied to a Sepharose gel G-100 Fast Flow column pre-equilibrated with pH 5.0 citrate phosphate buffer solution. The absorbed proteins were eluted using 0.2mol/L NaCl in citrate phosphate buffer at flow rate of 0.5 ml/min 32(Ding et al., 2012).
Determination of the effect of purification on laccase activity and protein content
Laccase activity and the total protein content of the enzyme were done at each stage of purification (i.e. the crude, ammonium sulphate precipitate, dialysed and the column purified enzymes) to determine the effect of purification of the enzyme. The assay was done using 280µL of the enzyme collected at each stage of purification according to the method of 31Mongkolthanaruk et al (2012).
The total protein content was determined using Lowry’s method as described by 34Aruna et al. (2012). A standard graph was plotted with concentration of bovine serum albumin (BSA) on X-axis and optical activity on Y-axis. 0.5mL of test solution in a test tube was taken and this was made up to 1ml with distilled water. 5mL of alkaline copper reagent (Reagent I) was added to test tubes and kept for 10mins at room temperature. Then 0.5mL of Folins-Ciocalteau reagent (reagent II) was added to the tubes, well mixed and incubated at 37oC in dark for 30 minutes. The blue colour developed was read at 660nm.
Molecular characterization of the isolates
DNA Extraction
The actively growing cultures were scraped off the solid media using a sterile scalpel into Eppendorf tube with blue pellet pestles, mixed properly and about 500µL of hot extraction buffer (containing 0.15M NaCl, 50nM Tris (pH 8.0), 50mM EDTA, 1% SDS) was added. The set up was placed in 65°C heat block for about 60 minutes accompanied with occasional mashing with the pestle. Appropriate aliquot of equal volumes of phenyl-chloroform was then added as extraction buffer and mixed several times to form emulsion.
The content of the Eppendorf tube was then transferred to corex tube and span for 10 minutes in microfuge. The aqueous upper layer (containing DNA) was carefully removed and transferred into a new tube. To this aqueous upper layer, 0.1 volumes 3M sodium acetate and 1.8 volumes cold 95% ethanol and mixed gently. With the appearance of a visible precipitate, the tubes were span down immediately for about 10 minutes. The 95% ethanol was then drawn off, followed by the addition of the same volume of 70% ethanol and the whole content mixed gently for about 1 minute. Then content was span down for a period of 5 minutes immediately followed by the drawing off of the 70% ethanol. The DNA pellets were then air dry.
Polymerase Chain Reaction Amplification
Amplification of the internal transcribed spacer (ITS1/ITS2) region of the fungal genome was done using the forward primer- ITS1 5’-CTTGGTCATTTAGAGGAAGTAA -3’ and reverse primer ITS4 5’-TCCTCCGCTTATTGATATGC -3’ 35(Bakri et al., 2010). Purification of the PCR amplicon so as to remove free primers and unincorporated dNTP was done using the GeneClean kit. The clean PCR product was transferred into a new tube and frozen until used for sequencing.
Sequencing
Sequencing of the purified PCR amplicon was done using ABI Bigdye 3.1 cycle sequencing kit (Applied Biosystems, California, USA) on ABI 3730XL and the nucleotide sequence determined by automated sequencer (Laragen Inc., Culver City California). The nucleotide sequences (see appendix) of ITS1/ITS2 of the isolates were aligned and analyzed by using Basic Local Alignment Search Tool (BLAST) program available at http://www.ncbi.nlm.nih.gov.
Alignment and Phylogenetic analysis
The nearest fungus with similar sequence was evaluated with GenBank database using BLAST with the isolates sequence as the query sequence 36(Altschul et al., 1997). Alignment with the similar sequences was carried out using ClustalW 37(Thompson et al., 1994). Phylogenetic tree was structured by neighbor tree joining method with MEGA 4 software 38(Tamura et al., 2007).
Isolation of yeasts
The result of the qualitative screening for laccase production of the fifty-five (55) yeasts isolated from different sample sources showed the extent of growth and laccase production on the screening medium. Growth was determined and rated from no visible growth (none) to dense or spread growth (excellent). The formation of dark brown colouration on the medium (laccase production) by the isolates was indicated with the increasing shade of the colour ranging from poor to complete while negative sign shows no colour formation. Yeast isolates that showed positive response with more than one laccase screening substrates are presented in Table 1 while other isolates that showed no response with all the substrates or weak response with just one substrate were discarded. Similarly, isolates with strong response with just one substrate were not considered. Only isolate Dw1 showed positive response with all the substrates while Dw2 and Mg2 were negative on tannic acid. PL3, PL6 and Rf3 showed similar positive response with hydroquinone and acetaminophen.
Table (1):
Qualitative plate screening of laccase enzyme production by yeast isolates in yeast extract peptone dextrose (YPD) agar incorporated with the different screening indicators
| Isolate code | Tannic acid | Hydroquinone | Acetaminophen | Catechol | ||||
|---|---|---|---|---|---|---|---|---|
| Growth | Col. | Growth | Col. | Growth | Col. | Growth | Col. | |
| Dw1 | + | + | ++ | + | ++ | +++ | + | ++ |
| Dw2 | + | – | ++ | ++ | ++ | ++ | + | + |
| PL3 | ++ | – | + | + | + | ++ | + | – |
| PL6 | – | – | + | + | + | + | + | – |
| Mg2 | – | – | + | + | + | + | + | + |
| Rf3 | + | – | + | + | + | + | + | – |
key |
Growth |
Dark-brown Colourization |
|---|---|---|
++++ |
Excellent |
Complete |
+++ |
Good |
Good |
++ |
Average |
Average |
+ |
Poor |
Poor |
– |
None |
None |
The result of quantitative screening of the yeast isolates is shown in Table 2. The quantitative laccase activity using 1mM ABTS (2, 2′-azino-bis (3-ethylbenzthiazoline-6-sulfonic acid)) showed that Dw1 yeast isolate had the highest activity of 9.643U/L followed by Dw2 yeast isolate (6.964U/L). The least activity was by PL3 isolate with a value of 3.929U/L.
Table (2):
Quantitative liquid screening of laccase producing yeast isolates with ABTS
Isolate code |
Activity in U/L |
|---|---|
Dw1 |
9.643 |
Dw2 |
6.964 |
PL3 |
3.929 |
PL6 |
4.643 |
Mg2 |
5.179 |
Rf3 |
4.643 |
From the results of both qualitative and quantitative screening, the best two (2) isolates taken for further studies were Dw1 and Dw2 isolated from decaying wood. These two (2) isolates (Dw1 and Dw2) were identified based on morphological, microscopic and physiological characteristics. Both isolates showed similarity in most of the morphological characteristics observed except in colony colour and elevation. Isolate Dw1 was creamy and elevated while isolate Dw2 was white and flat. The sugar fermentation pattern showed that isolates Dw1 and Dw2 differed in the fermentation of galactose and raffinose. The probable identity of isolates Dw1 and Dw2 was Kluyveromyces sp and Pichia sp. respectively.
The effect of different carbon sources on laccase activity by the yeast isolates (Fig. 1) showed that the highest activity by the two yeast (Kluyveromyces sp.Dw1 and Pichia sp.Dw2) isolates was recorded at 192hr incubation time for all the carbon sources except for sucrose where Kluyveromyces sp.Dw1 had its highest laccase activity at 144hrs. At all sampling times, sucrose had the least activity in Kluyveromyces sp.Dw1 except at 144hrs while enzyme activity varies with carbon source and incubation time in Pichia sp.Dw2. Kluyveromyces sp.Dw1 had its highest laccase activity (56.34U/L) from maltose, followed by glucose (52.23U/L) and the least activity was from sucrose (0.27U/L) at 96hrs. The highest enzyme activity by Pichia sp.Dw2 was obtained in glucose (29.55U/L), followed by sucrose (23.57U/L) and the least from maltose (14.29U/L) at 192hrs. Statistical analysis revealed that there are significant differences (P£0.05) between the carbon sources in Kluyveromyces sp.Dw1 at all the sampling times, except at 144hrs, when starch and maltose did not significantly differ whereas, in Pichia sp.Dw2, glucose and fructose did not significantly differ (P≥0.05) at 96hrs, so also starch and maltose at both 96hrs and 144hrs sampling time.

Fig. 1. Effect of different carbon sources on laccase activity
The effect of different nitrogen (both organic and inorganic) sources on laccase activity by Kluyveromyces sp.Dw1 and Pichia sp.Dw2 (fig. 2) showed that the inorganic sources (NaNO3, KNO3, and (NH4)2SO4) had better effect than the organic nitrogen sources (peptone and yeast extract). The best two (2) of the three inorganic sources were the nitrates of sodium and potassium. From the table, highest laccase activity by Kluyveromyces sp.Dw1 was recorded between 144 and 192hr incubation time for all the nitrogen sources except for (NH4)2SO4 where Kluyveromyces sp.Dw1 had its highest at 48hrs whereas Pichia sp.Dw2 had its highest laccase activity recorded between 96 and 144hrs except for (NH4)2SO4 in 192hrs. At all sampling times, yeast extract had the least activity by Kluyveromyces sp.Dw1 except at 192hrs while (NH4)2SO4 had the least activity in Pichia sp.Dw2. The maximum enzyme activity was obtained in sodium nitrate by both Kluyveromyces sp.Dw1 (95.27U/L) and Pichia sp.Dw2 (45.18U/L), followed by potassium nitrate (86.52U/L at 144hrs for Kluyveromyces sp.Dw1 and 42.95U/L at 96hrs for Pichia sp.Dw2). Statistically, there were significant differences (P£0.05) between the nitrogen sources in Kluyveromyces sp.Dw1 at all the sampling times, whereas, in Pichia sp.Dw2, yeast extract and ammonium sulphate did not differ significantly (P≥0.05) at 96hrs.
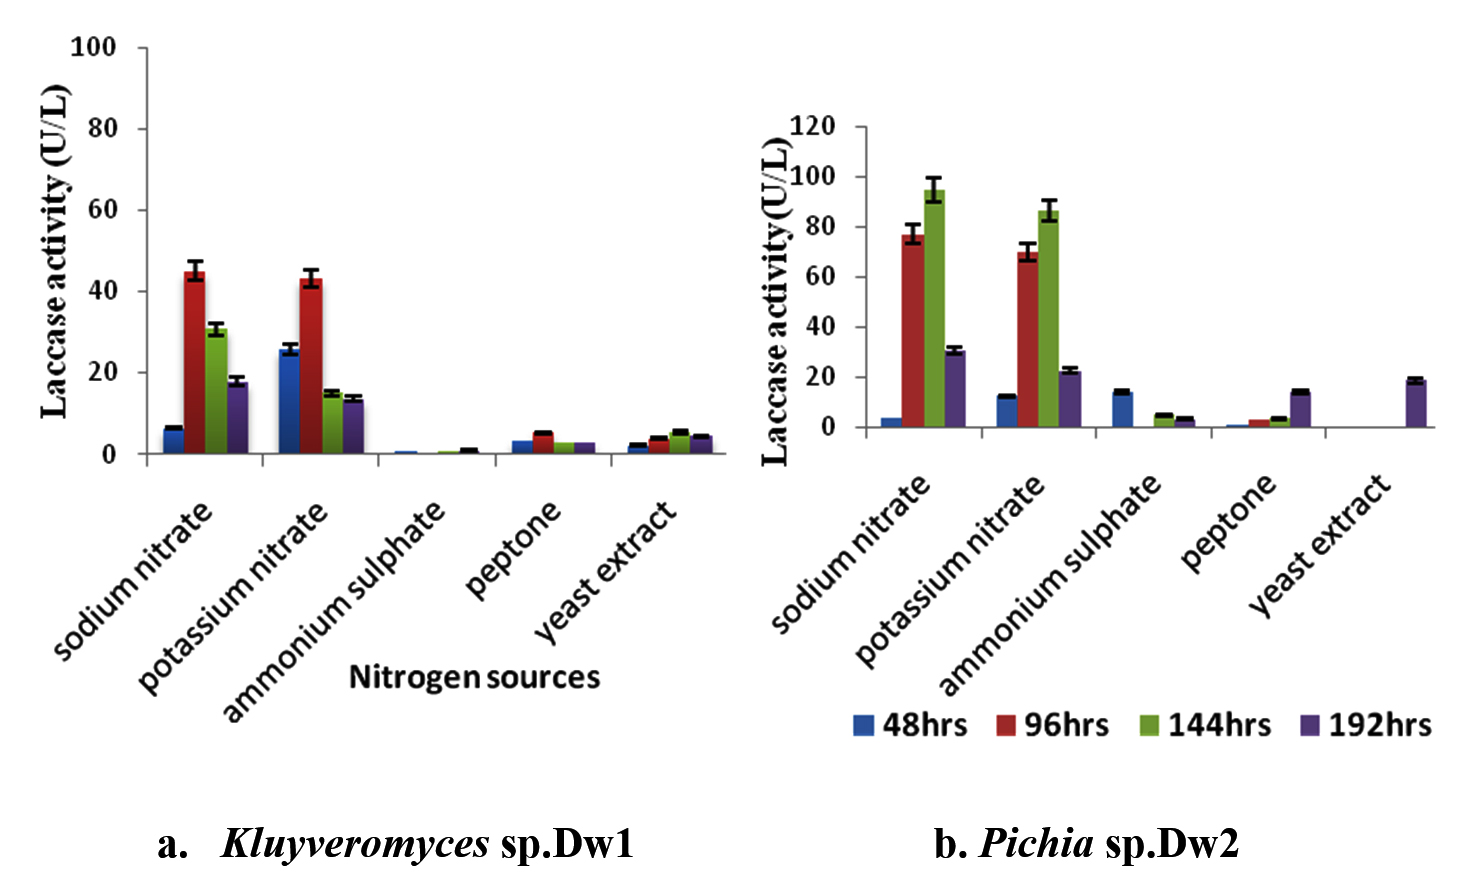
Fig. 2. Effect of different nitrogen sources on laccase activity
The effect of different pH of the medium on laccase activity of the isolates was shown in fig. 3. The highest activity was recorded at pH 6.0 by Kluyveromyces sp.Dw1 at all sampling time. Similar trend was observed for Pichia sp.Dw2 within the first 96hrs. Enzyme activity increased within 96hrs incubation time by Kluyveromyces sp.Dw1 and decreased thereafter till 192hrs. For Pichia sp.Dw2, activity increased within 96hrs at pH 3 and 6 and thereafter decreased while it increased till 144hrs at pH 4 and 5. Kluyveromyces sp.Dw1 had its highest laccase activity at pH 6 (99.29U/L at 96hrs) and the least activity at pH 5 (22.98U/L at 48hrs) while Pichia sp.Dw2 had its highest activity of 71.61U/L at the same pH and incubation time as in Kluyveromyces sp.Dw1 and pH 3 had the least activity (13.66U/L at 192hrs). Statistical analysis revealed that there are significant differences (P£0.05) between the initial pHs in Kluyveromyces sp.Dw1 at all the sampling times, except pH 3 and pH5 at 144hrs, also pH4 and pH5 at 192hrs, where there was no significant difference (P≥0.05), whereas, Pichia sp.Dw2, there are significant differences (Pd”0.05) between the pHs at all the sampling times.
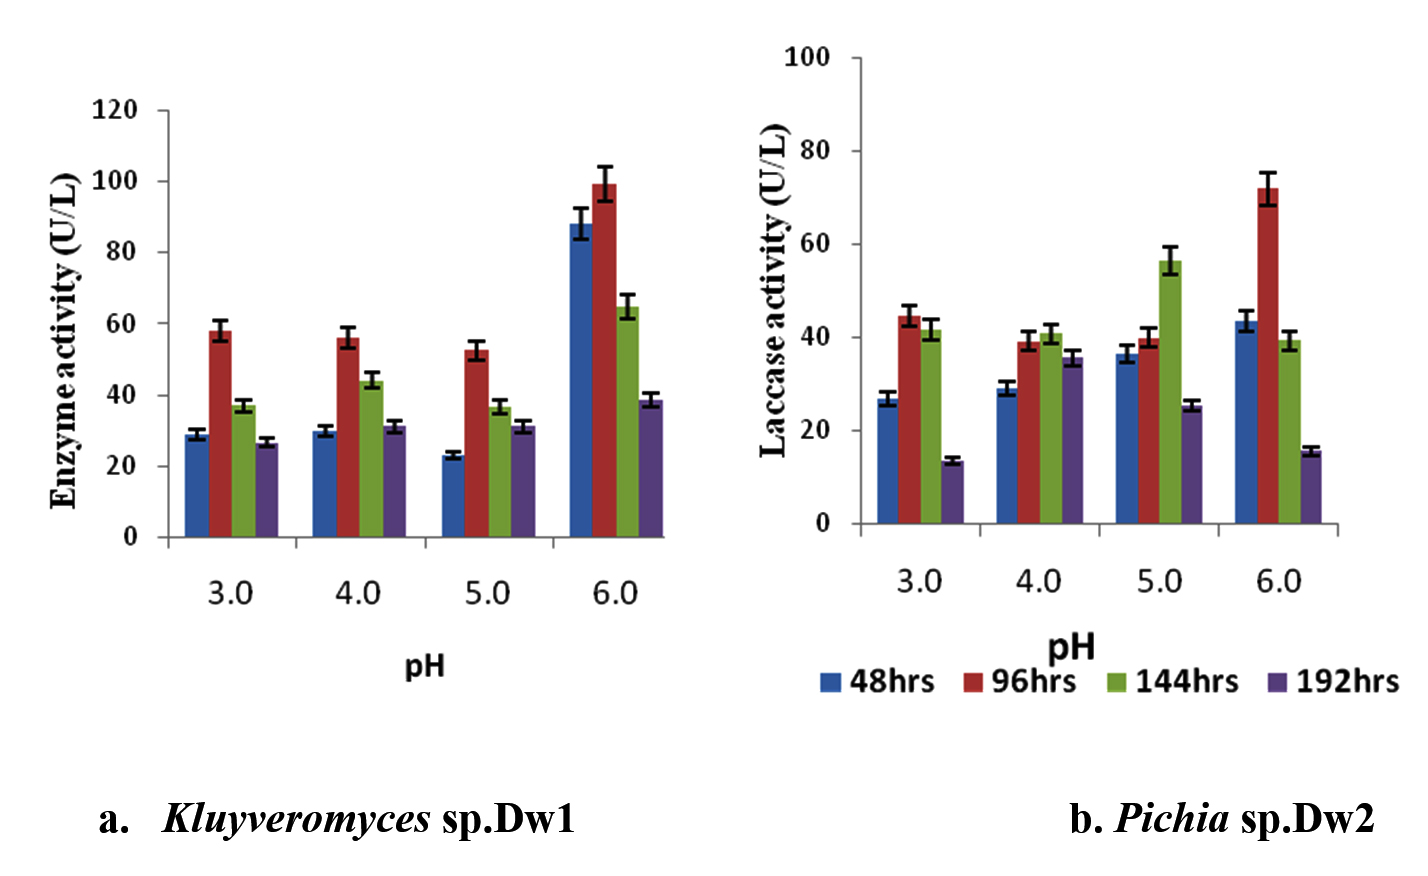
Fig. 3. Effect of different pH on laccase activity
The effect of different incubation temperature on laccase activity of the isolates showed that there was a decrease in laccase activity after 96hr incubation time at all temperature in Kluyveromyces sp.Dw1 (fig. 4). Highest laccase activity was recorded at all incubation temperatures for Kluyveromyces sp.Dw1 at 96hrs. The least laccase activity by Kluyveromyces sp.Dw1 was recorded at 192hrs, at all incubation temperatures. Enzyme activity varied with temperature and incubation time in Pichia sp.Dw2, but the least activity was recorded for all temperature at 192hrs. Kluyveromyces sp.Dw1 had its highest activity at 30oC (80.02U/L) and the least recorded at 25oC (1.98U/L). For Pichia sp.Dw2, the highest activity was at 35oC (33.09U/L at 48hrs) and the least activity at the same temperature but at 192hr incubation time. Statistically, there are significant differences (P£0.05) in laccase activities between the incubation temperature in Kluyveromyces sp.Dw1 at all the sampling times, whereas, in Pichia sp.Dw2, 35oC and 37oC incubation temperature did not differ significantly (P≥0.05) at 144hrs incubation.
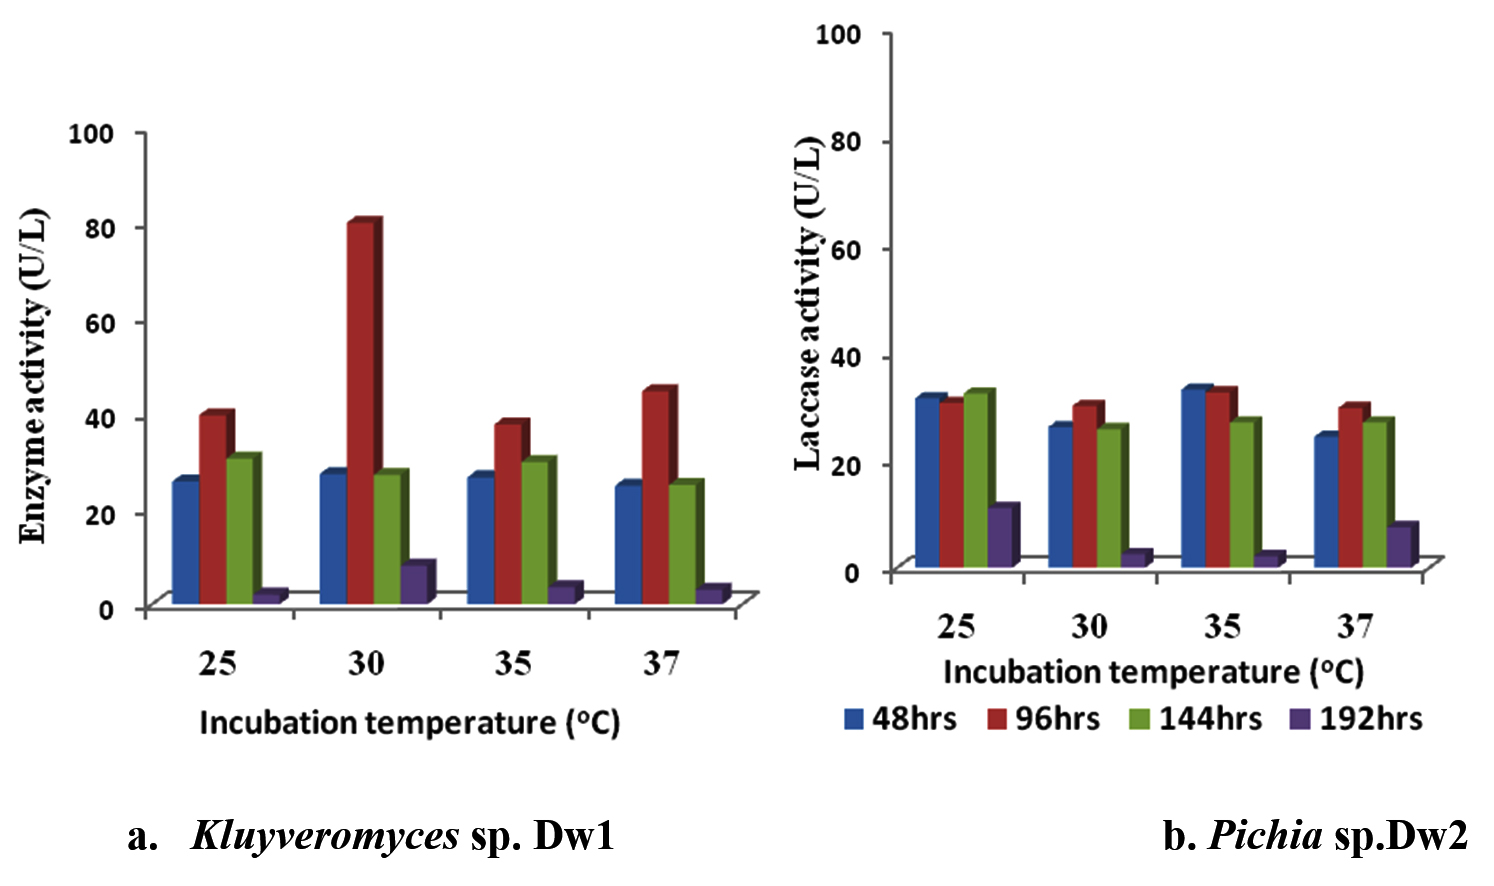
Fig. 4. Effect of different incubation temperature on laccase activity
Figure 5 shows the result of glucose optimization studies. The effect of the different glucose concentrations on laccase activity of Kluyveromyces sp.Dw1 increased up to 0.5% (w/v) glucose concentration of 87.856U/L at 96hrs incubation time but drastically decreased at higher concentrations. From figure 5, the glucose concentration optimum for Pichia sp.Dw2 was obtained at 1.0% (68.928U/L at 96hrs) followed by gradual decrease as glucose concentration increases. Least activity at all time was recorded at 0.1% glucose concentration
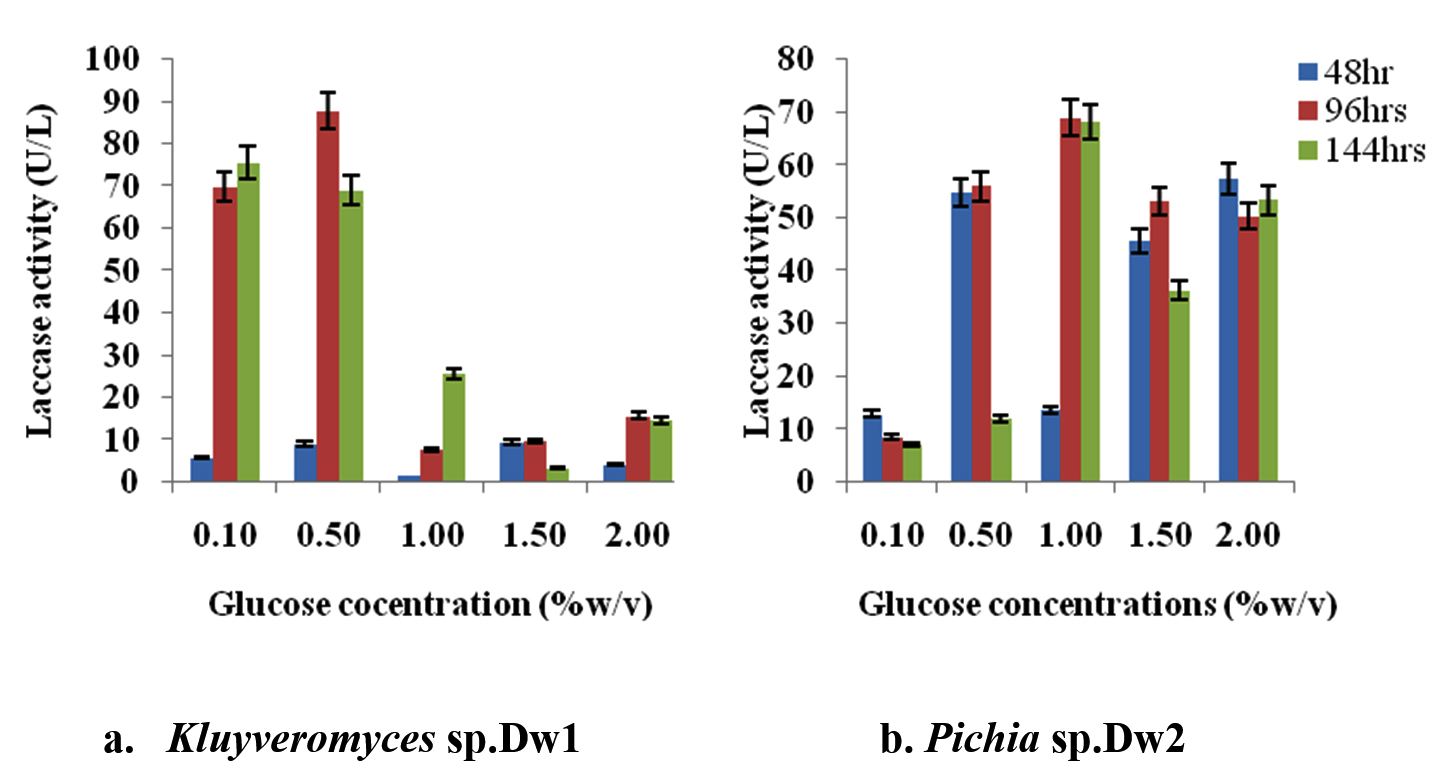
Fig. 5. Effect of different glucose concentrations on laccase activity
The result of the effect of different nitrogen (NaNO3) concentrations on isolates Kluyveromyces sp.Dw1 and Pichia sp.Dw2 laccase activity is shown in figure 6. At all concentrations, highest enzyme activity was recorded at 96hrs with highest at 0.5% (89.642U/L) and least at 0.2% (8.571U/L) NaNO3 for Kluyveromyces sp.Dw1 (fig. 6a). At all sampling time, 0.2% NaNO3 had the least laccase activity. From figure 6b, Pichia sp.Dw2 laccase activity decreases as NaNO3 concentrations increased at 96hrs. At all concentrations of NaNO3, highest activity was obtained at 96hrs except at 0.4% (48hrs) and 0.5% (144hrs). Highest enzyme activity by Pichia sp.Dw2 was recorded at 0.1% NaNO3 (69.99U/L) and the least activity (2.5U/L) at 0.5% concentration. Laccase activity of Pichia sp.Dw2 decreased with time at 0.4% NaNO3 concentration while it increased at 0.5% concentration.
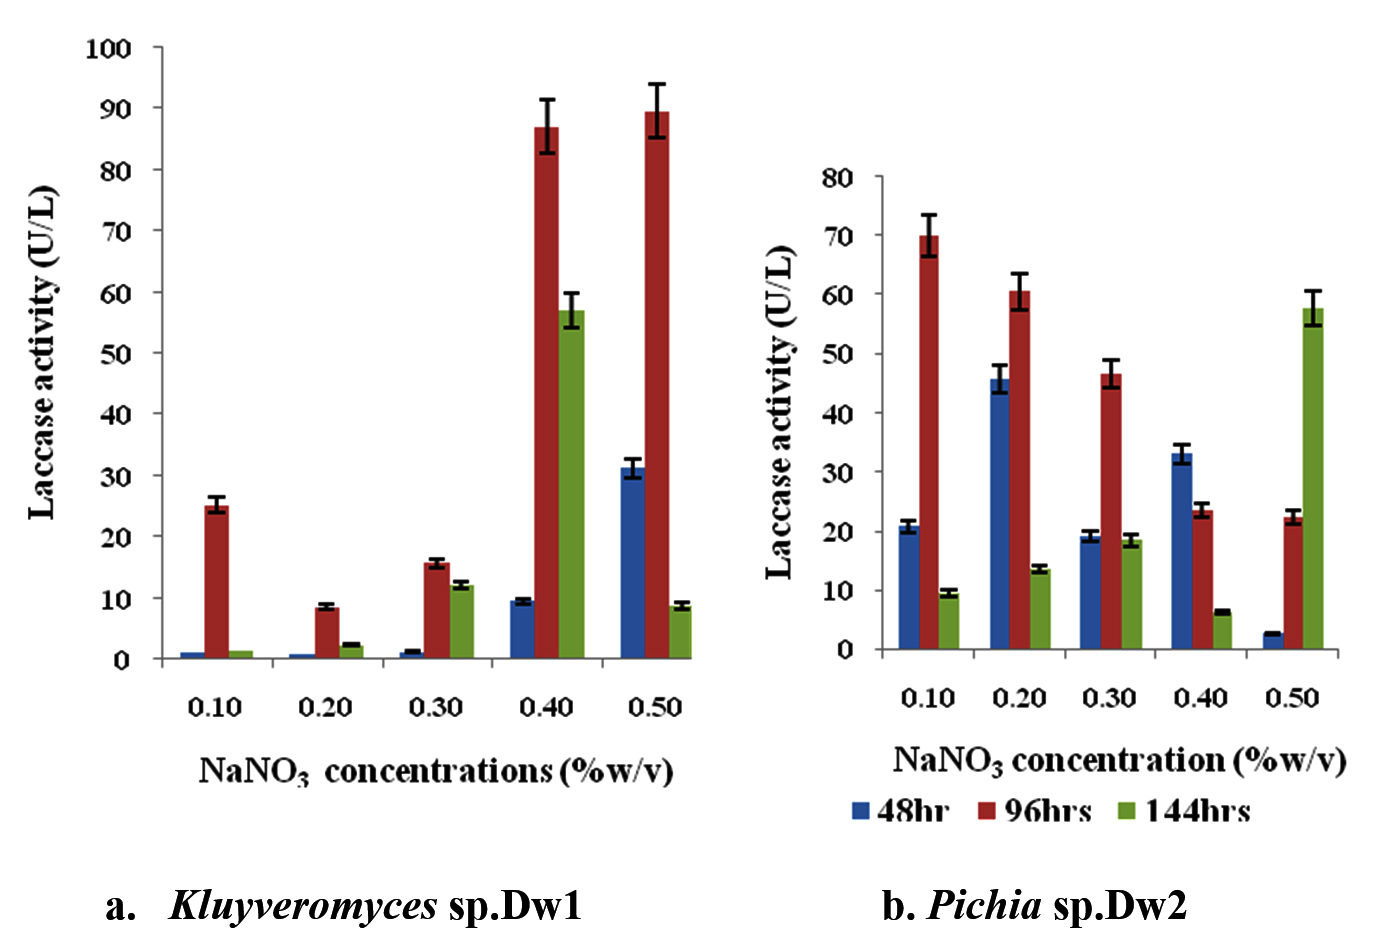
Fig. 6. Effect of different NaNO3 concentrations on laccase production
The laccase activity of induced isolates ranged from 102.14U/L in Acetaminophen at 96hrs incubation time to 138.93U/L in CuSO4 at 144hrs (Figure 7). Highest activity by Kluyveromyces sp.Dw1 was obtained at 144hrs in CuSO4 (138.93U/L), followed by Hydroquinone (136.25U/L) then Catechol (133.04U/L) and least activity in Tannic acid (103.39U/L). At all sampling time, highest activity by Pichia sp.Dw2 was recorded in Acetaminophen except at 144hrs (figure 8). Its highest enzyme activity was obtained in Tannic acid (163.21U/L) at 144hrs and least activity (109.29U/L) at 96hrs in pyrogallol.
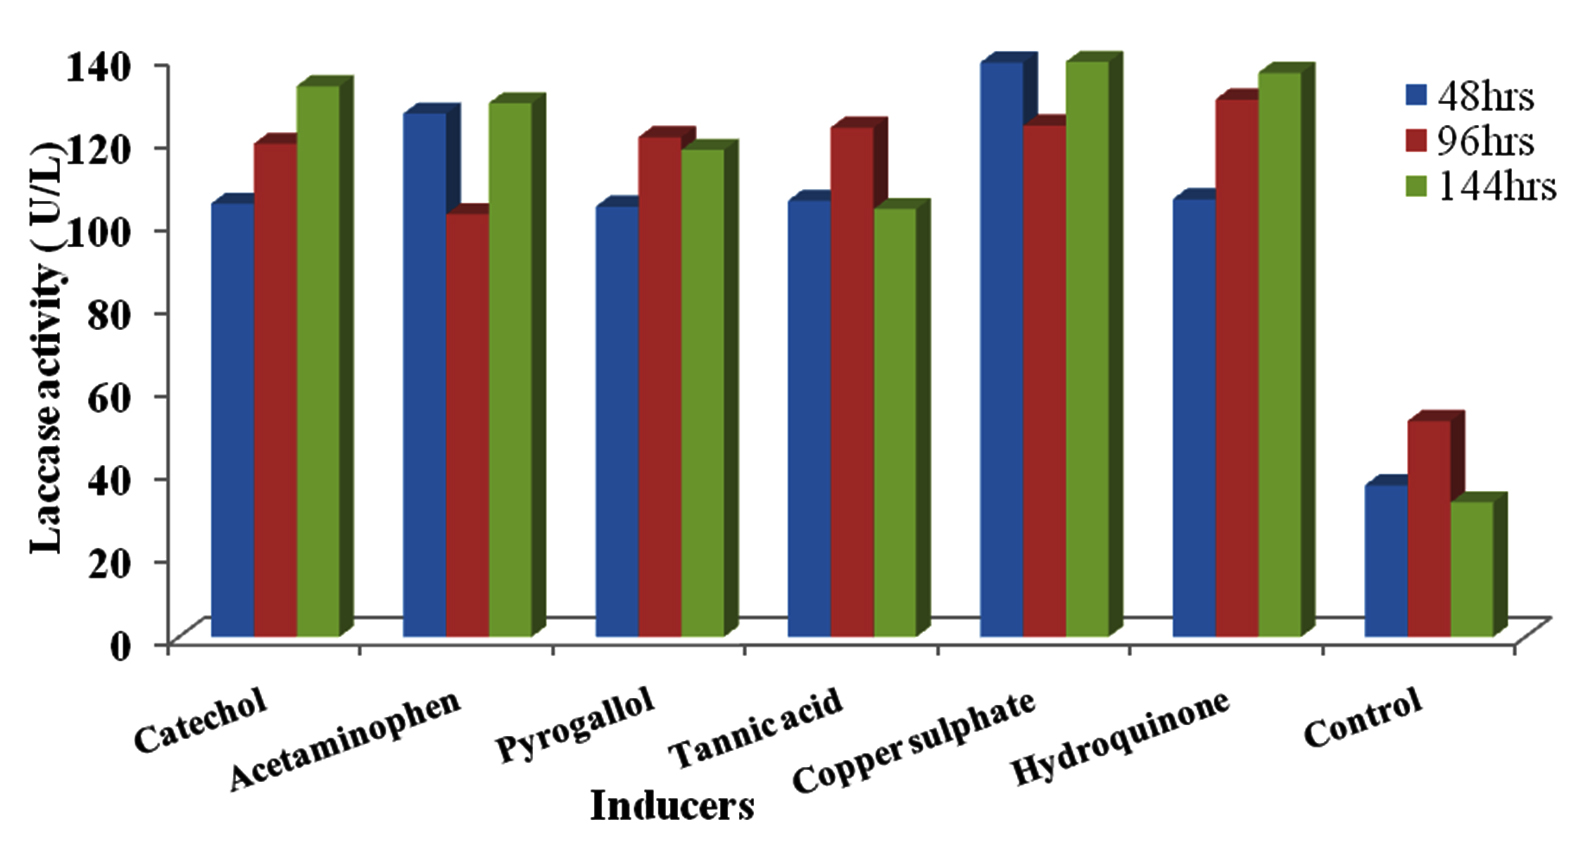
Fig. 7. Effect of different inducers on laccase production by Kluyveromyces sp.Dw1
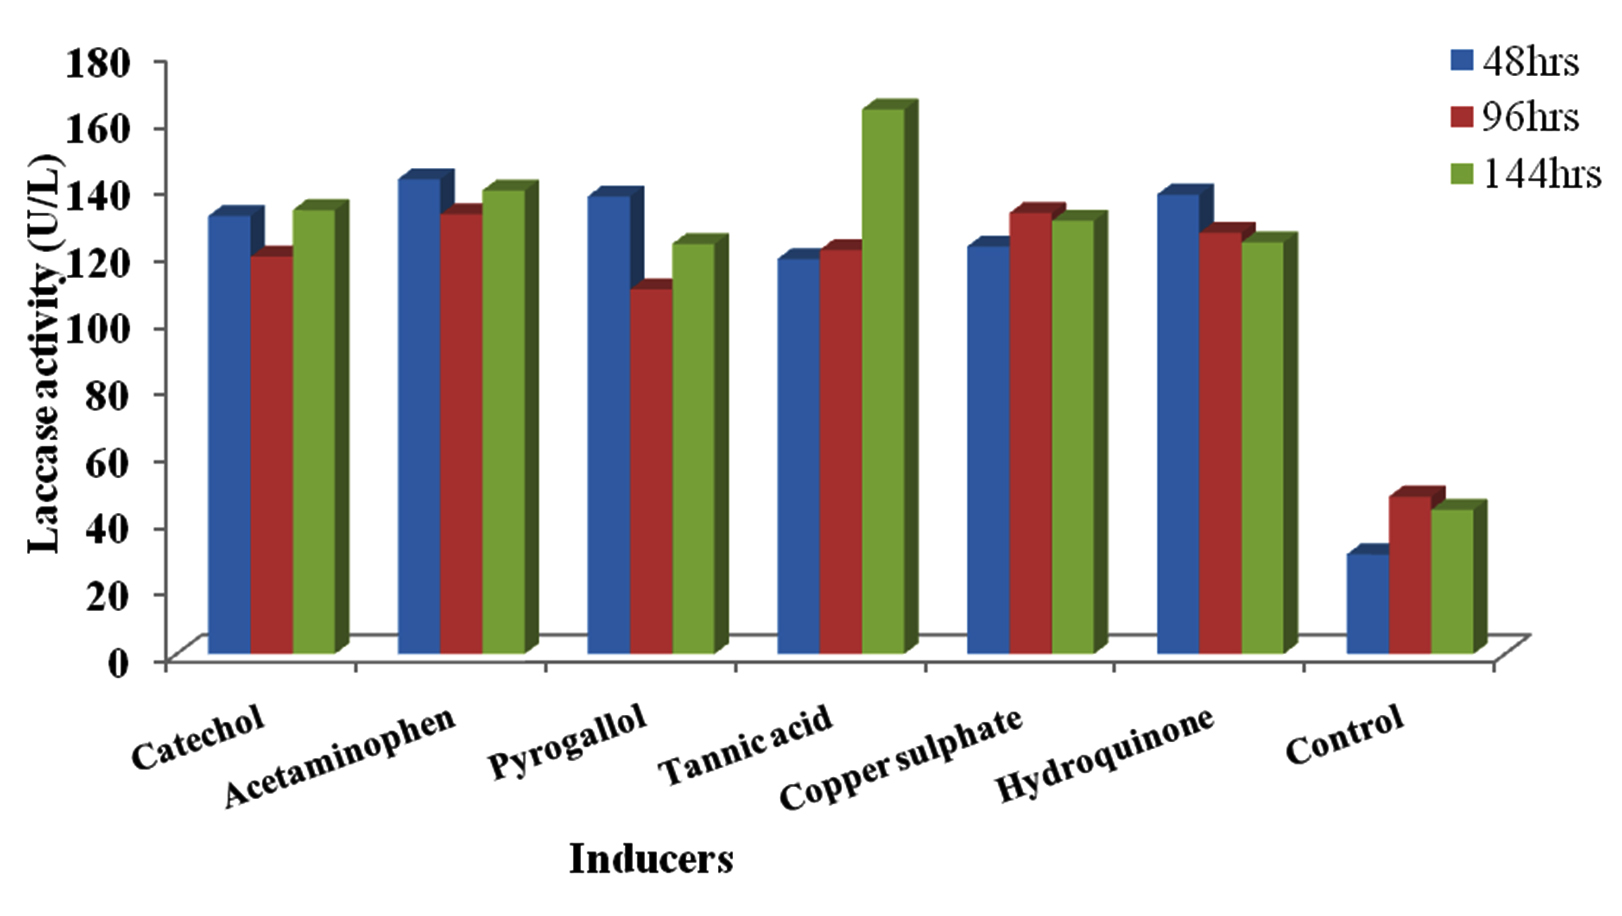
Fig. 8. Effect of different inducers on laccase production by Pichia sp.Dw2
Figure 9 shows the result of analysis of the effect of various lignocellulosic substrates on laccase activity of Kluyveromyces sp.Dw1. Highest laccase activity by all the lignocellulosic substrates was recorded at 192hr incubation time and the least at 240hrs except for cane bagasse and maize stover which had their least activities at 48hrs. Laccase activity was highest (88.63U/L) in rice bran followed by maize stover (82.26U/L) and the lowest was recorded in plantain peel (20.80U/L) at 192hrs of incubation. Statistical analysis revealed that there are significant differences (P£0.05) between the laccase produced by the substrates at all the sampling times, except at 240hrs, while cane bagasse, rice bran and maize stover did not significantly (P<0.05) differ.
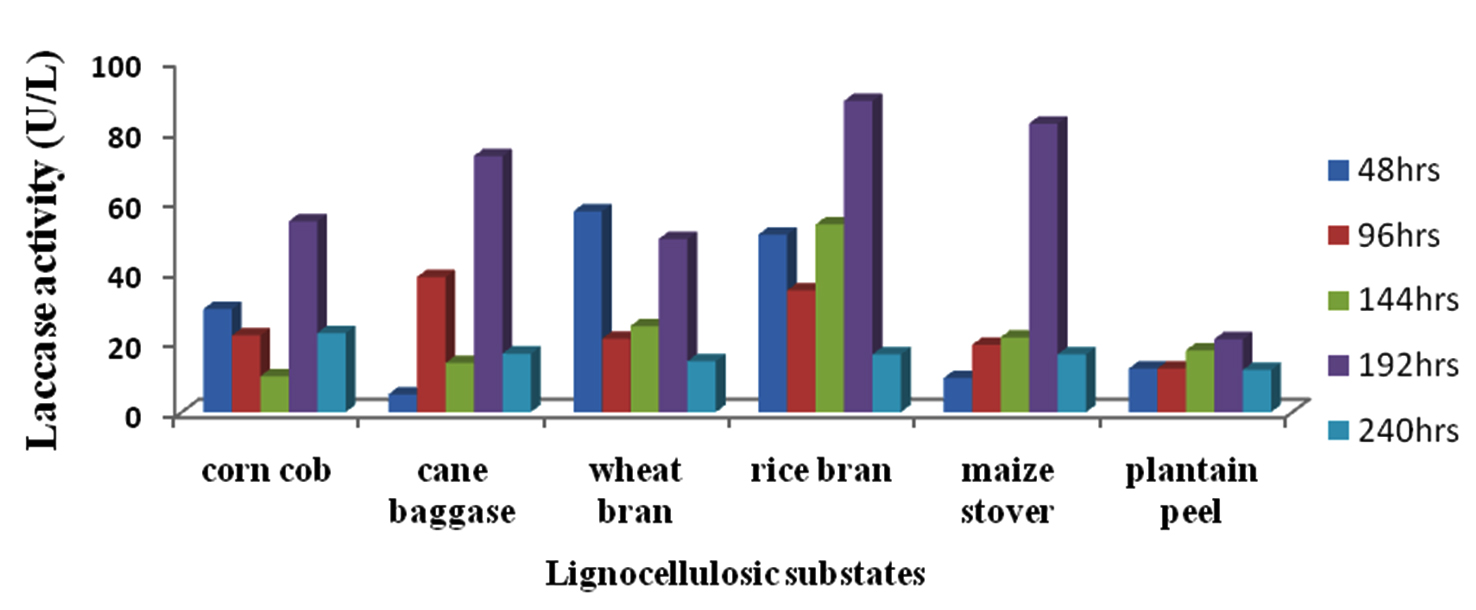
Fig. 9. Effect of different lignocellulosic substrates on laccase production by Kluyveromyces sp.Dw1
The result of analysis of the effect of various lignocellulosic substrates on laccase activity of Pichia sp.Dw2 is presented in figure 10. All the substrates had the highest activity at 192hrs of incubation except maize stover (144hrs). Laccase activity was highest (79.11U/L) in cane bagasse followed by corn cob (77.80U/L) while the lowest activity was recorded in banana peel (52.41U/L) at 192hrs of incubation. Statistical analysis revealed that substrate types significantly affect (P£0.05) the laccase activity of the yeast isolates.
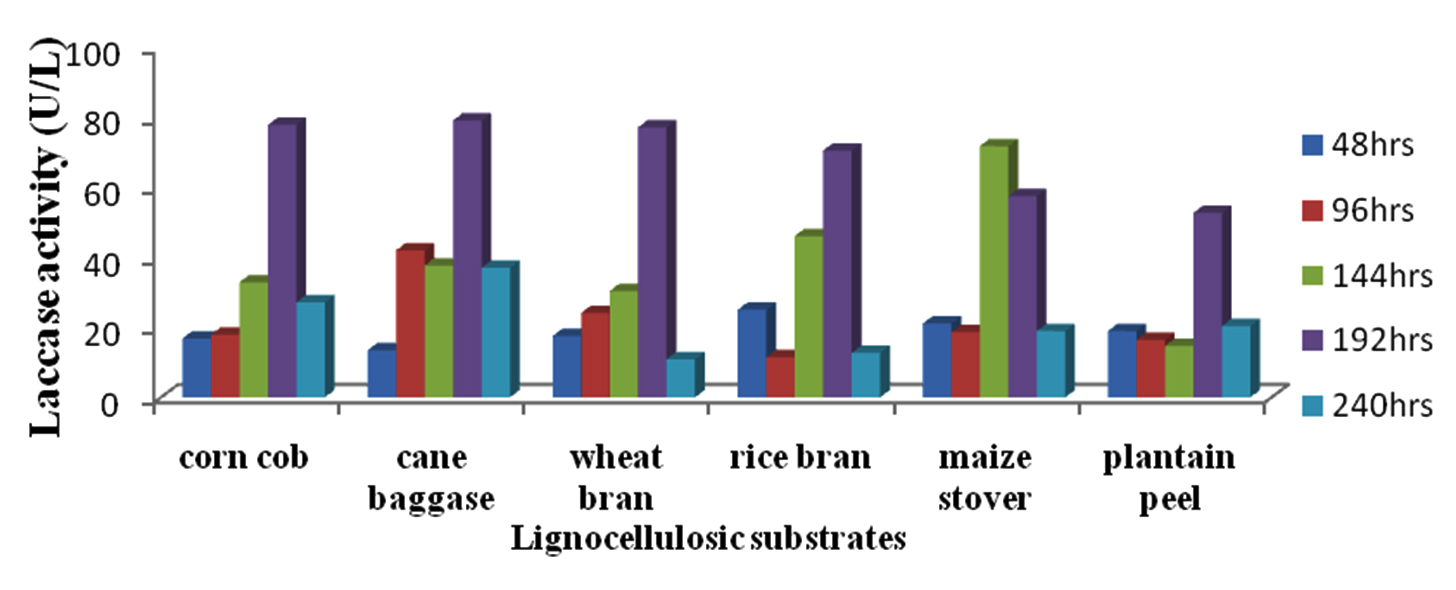
Fig. 10. Effect of different lignocellulosic substrates on laccase production by Pichia sp.Dw2
The result of the determination of the optimum pH of Kluyveromyces sp.Dw1 enzyme in table 3 showed that at all sampling times, pH 9 had the highest laccase activity. At all pH’s, highest laccase activity was recorded at 60minutes incubation time except at pH 6 and 7 where the highest activity was observed at 30 minutes. At all incubation time, pH 9 had the highest laccase activity which is significantly different (P£ 0.05) from other pH’s. For Pichia sp.Dw2 laccase (table 4), at all sampling times, pH 9 had the highest laccase activity except at 60 minutes. The highest laccase activity (28.937U/L) was recorded at pH 9 within 10 minutes of incubation followed by 27.578U/L laccase activity at pH 7 (60 minutes incubation) and the least activity (0.259U/L) recorded at pH 7 at 15 minutes incubation time. At all incubation time, except at 60 minutes (pH 7), pH 9 had the highest laccase activity which is significantly different (P£ 0.05) from other pH’s.
Table (3):
Determination of Optimum pH for Kluyveromyces sp. Dw1 laccase
| Incubation time (min) | |||||
|---|---|---|---|---|---|
| pH | 10 | 15 | 30 | 45 | 60 |
| 3 | *1.340±0.090f† | 6.697±0.268b | 5.982±0.089d | 6.429±0.179c | 11.339±0.089c |
| 4 | 0.804±0.090g | 5.090±0.090c | 6.965±0.179c | 8.393±0.179b | 9.554±0.268d |
| 5 | 2.768±0.089e | 5.000±0.179c | 7.143±0.179c | 8.661±0.090b | 14.643±0.179b |
| 6 | 7.232±0.089b | 4.286±0.179d | 7.858±0.179b | 7.679±0.179b | 5.895±0.002f |
| 7 | 4.465±0.179d | 5.447±0.089c | 6.965±0.179c | 3.393±0.179d | 3.018±0.018g |
| 8 | 6.429±0.179c | 4.464±0.357d | 3.572±0.179e | 6.072±0.179c | 6.875±0.089e |
| 9 | 17.411±0.089a | 17.321±0.357a | 13.036±0.179a | 13.304±0.090a | 17.491±0.170a |
*Values are average of duplicate readings ± standard deviation. †Means of values on the same column with the same superscript are not significantly different (P≥0.05) from each other.
Table (4):
Determination of Optimum pH for Pichia sp.Dw2 laccase
| Incubation time (min) | |||||
|---|---|---|---|---|---|
| pH | 10 | 15 | 30 | 45 | 60 |
| 3 | *16.161±0.090c† | 7.304±0.161c | 11.509±0.098b | 5.629±0.094d | 5.090±0.090d |
| 4 | 3.920±0.009e | 7.026±0.063c | 8.589±0.161c | 5.812±0.099d | 1.982±0.018g |
| 5 | 3.125±0.089f | 11.366±0.116b | 11.196±0.054b | 12.83±0.027b | 3.956±0.027e |
| 6 | 5.447±0.089d | 1.027±0.134e | 3.839±0.089e | 3.732±0.018e | 10.232±0.054c |
| 7 | 2.410±0.081g | 0.259±0.080f | 0.268±0.089f | 6.866±0.080c | 27.578±0.101a |
| 8 | 16.545±0.062b | 6.295±0.134d | 6.902±0.116d | 7.072±0.107c | 3.108±0.072f |
| 9 | 28.937±0.009a | 21.634±0.152a | 15.661±0.125a | 16.741±0.045a | 19.214±0.250b |
*Values are average of duplicate readings ± standard deviation. †Means of values on the same column with the same superscript are not significantly different (P≥0.05) from each other.
At all incubation time, the highest laccase activity for Kluyveromyces sp.Dw1 laccase was recorded at 30oC incubation temperature (table 5), and the least activity at 90oC except at 10 minutes incubation time. Kluyveromyces sp.Dw1 laccase activity at 30oC is significantly different (P£0.05) from other temperature at all time except at 10 minutes where it was not significantly different (P>0.05) from 50oC activity. Enzyme activity for Pichia sp.Dw2 laccase (table 6) decreases with increase in time within the first 45 minutes at most temperature except at 60oC and 90oC. Higher enzyme activity at most incubation times was recorded at 50oC. Enzyme activity at 50oC is significantly different (P£0.05) from other temperature at all time except at 10 and 15 minutes. Also at 90°C, laccase activity is significantly different (P£0.05) from other temperature at all time except at 45 minutes.
Table (5):
Determination of optimum Temperature for Kluyveromyces sp. Dw1 laccase
| Temp.(°C) | Incubation time (min) | ||||
|---|---|---|---|---|---|
| 10 | 15 | 30 | 45 | 60 | |
| 30 | *9.572±0.072a† | 12.607±0.071a | 9.636±0.008a | 10.277±0.080a | 10.715±0.179a |
| 40 | 7.599±0.081bc | 8.518±0.053d | 9.241±0.134b | 8.679±0.072b | 5.634±0.098d |
| 50 | 9.375±0.089a | 10.554±0.018b | 7.554±0.125e | 7.536±0.215c | 7.983±0.054b |
| 60 | 6.340±0.090d | 6.831±0.313f | 6.277±0.027f | 7.384±0.241c | 6.884±0.080c |
| 70 | 7.617±0.063bc | 7.964±0.107e | 8.634±0.063c | 7.607±0.107c | 7.063±0.099c |
| 80 | 7.411±0.090c | 9.759±0.063c | 8.072±0.143d | 8.830±0.259b | 7.795±0.116b |
| 90 | 7.724±0.044b | 0.322±0.143g | 1.304±0.054g | 2.063±0.099d | 1.000±0.071e |
*Values are average of duplicate readings ± standard deviation. †Means of values on the same column with the same superscript are not significantly different (P≥0.05) from each other.
Table (6):
Determination of optimum Temperature for Pichia sp.Dw2 laccase
| Temp. (°C) | Incubation time (min) | ||||
|---|---|---|---|---|---|
| 10 | 15 | 30 | 45 | 60 | |
| 30 | *12.054±0.090a† | 10.062±0.116b | 8.491±0.080c | 5.054±0.054d | 6.152±0.098d |
| 40 | 11.697±0.090b | 11.232±0.018a | 10.759±0.134a | 9.625±0.161b | 9.937±0.116b |
| 50 | 11.946±0.018a | 10.982±0.089a | 10.474±0.063b | 11.402±0.027a | 12.241±0.098a |
| 60 | 6.563±0.045e | 4.911±0.090f | 3.867±0.063e | 4.938±0.063d | 3.884±0.134f |
| 70 | 8.661±0.090c | 7.357±0.143d | 6.375±0.054d | 4.527±0.116e | 2.063±0.099g |
| 80 | 7.590±0.090d | 8.590±0.161c | 8.420±0.026c | 7.759±0.080c | 7.973±0.116c |
| 90 | 3.938±0.009f | 5.804±0.089e | 2.527±0.027f | 4.590±0.054e | 4.563±0.099e |
*Values are average of duplicate readings ± standard deviation. †Means of values on the same column with the same superscript are not significantly different (P≥0.05) from each other.
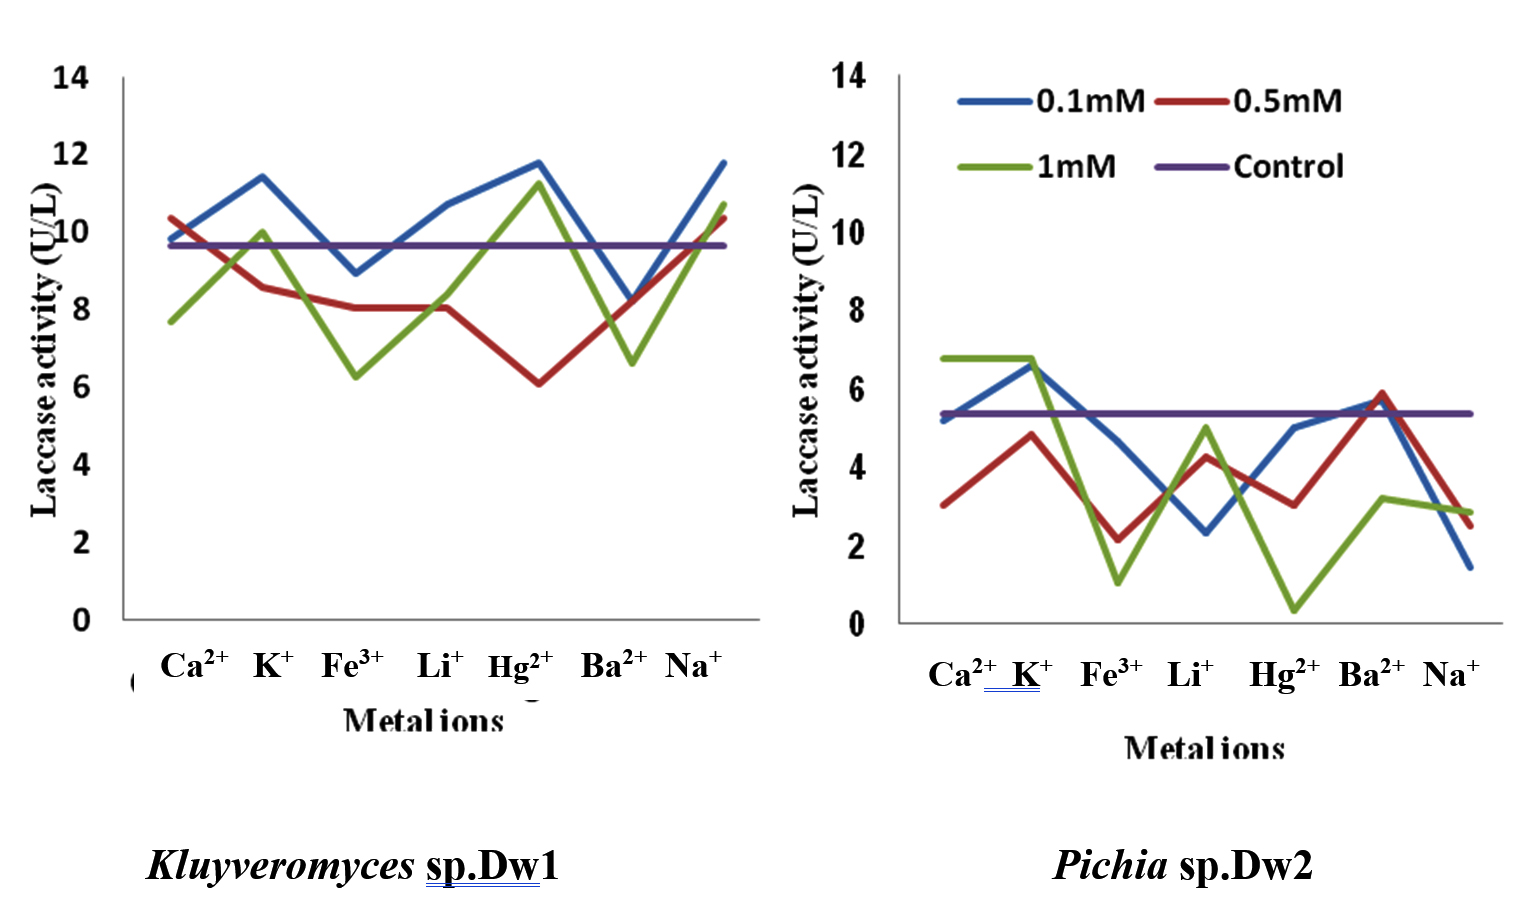
Fig. 11. Effect of different metal ions on laccase activity produced by the Isolates
Figure 11 shows the result of the effect of different metal ions on laccase activity from Kluyveromyces sp.Dw1. Compared to the control, 0.1mM metal ions enhanced the laccase activity of Kluyveromyces sp.Dw1 enzyme except Fe3+ and Ba2+ ions. At all metal ion concentrations, Ba2+ had lower enzyme activity compared to the control enzyme while Na+ had higher activity. Highest enzyme activity by Kluyveromyces sp.Dw1 was recorded at 0.1mM Hg2+ ion concentration. The enzyme activity of Kluyveromyces sp.Dw1 laccase is significantly different (P£0.05) from each other at different metal ion concentration and by different metal ions.
The activity of laccase enzyme produced by Pichia sp.Dw2 enzyme, compared to the control enzyme, was higher at higher concentration of Ca2+(1.0mM and 5.0mM) and at lower concentration of Ba2+(0.1mM and 0.5mM). Higher activity was observed with K+ at 0.1mM concentration (6.646U/L) and 1.0mM (6.670U/L). Addition of Fe3+, Hg2+, Li+ and Na+ has no significant effect on laccase activity of Pichia sp.Dw2 except at highest concentration of Li+ (5.0mM). The enzyme activity of Dw2 laccase is significantly different from each other (P£0.05) at different metal ions and at different concentrations except at 0.5mM concentration where there was no significant difference (P>0.05) between Li+ and K+, and Ca2+ and Hg+.
The result of the effect of different surfactants on laccase activity of from Kluyveromyces sp.Dw1 showed an increase in the concentration of surfactants from 0.1 to 0.5mM had a resultant increase in laccase activity while further increase to 1.0mM concentration was observed to decrease the activity except for urea. Among all the surfactants and at all concentrations, EDTA had the highest activity, which is significantly different (P£0.05) from the activities of other surfactants and the least activity was observed in urea. 0.5mM and 5.0mM concentrations of EDTA and Benzoic acid enhanced laccase activity of Kluyveromyces sp.Dw1 enzyme because of higher value than the control. The effect of different surfactants on laccase activity of enzyme from Pichia sp.Dw2 shows that increase in concentration of EDTA resulted in a decrease in the laccase activity while an increase in Benzoic acid concentration resulted in increased activity except at 0.5mM concentration. Both in the least (0.1mM) and the highest (5.0mM) concentration of surfactants, Benzoic acid had the highest activity which is higher than the control and significantly different (P£0.05) from activities of other surfactants. Urea and DNP at all concentrations had no significant effect (P>0.05) on activity of laccase produced by Pichia sp.Dw2 except for DNP at 1.0mM concentration.
The effect of different ABTS substrate concentrations on enzyme activity of laccase enzymes from Kluyveromyces sp.Dw1 and Pichia sp.Dw2 showed an increase in activity with increase in substrate concentration up to 0.5mM for Dw1 and 0.4mM for Dw2 which were the optima for both but decrease with further increase in substrate concentration. Both enzymes had the same activity at 0.3mM concentration. The kinetic parameters of the laccase from Kluyveromyces sp.Dw1 and Pichia sp.Dw2 showed that the enzyme affinity (Km) values were 0.08mM and 0.13mM while the maximal velocity values (Vmax) were 48U/L and 55U/L.
The result of the effect of different laccase volumes on the activities of laccase enzymes showed that there was a corresponding increase in activity with enzyme volume up to 480µl and 580µl for both Kluyveromyces sp.Dw1 (14.286U/L) and Pichia sp.Dw2 (13.750U/L) enzymes respectively. These were the optimum concentrations for both enzymes, above which there was decrease in activity of both enzymes.
Table (7):
Purification steps for laccase produced by yeast isolates (Kluyveromyces sp.Dw1 and Pichia sp.Dw2)
| Enzyme | Purification step | Total protein (mg/ml) | Total Activity (U/ml) | Specific Activity (U/mg of protein) | Purification fold | % Yield |
|---|---|---|---|---|---|---|
| Dw1 | Crude | 0.343 | 0.067 | 0.197 | 1.000 | 100 |
| (NH4)2SO4 precipitation | 0.120 | 0.083 | 0.694 | 3.521 | 87.5 | |
| Dialysis | 0.119 | 0.076 | 0.639 | 3.245 | 82.8 | |
| Sephadex G-100 chromatography | 0.083 | 0.034 | 0.410 | 2.079 | ||
| Dw2 | Crude | 0.418 | 0.056 | 0.134 | 1.000 | 100 |
| (NH4)2SO4 precipitation | 0.159 | 0.080 | 0.500 | 3.743 | 88.8 | |
| Dialysis | 0.157 | 0.079 | 0.505 | 3.776 | 83.2 | |
| Sephadex G-100 chromatography | 0.131 | 0.059 | 0.450 | 3.369 |
Table 7 shows the result of the purification of laccase from Kluyveromyces sp.Dw1 and Pichia sp.Dw2 and the effect on the total protein content and the total laccase activity. The specific activity of the enzyme, which is the ratio of the total activity to total protein content, is also shown. Total protein content reduced in each purification step from 0.343 mg/ml to 0.083mg/ml which subsequently enhanced the specific activity of the enzyme up to the highest value of 0.694U/mg of protein by ammonium sulphate precipitation with a purification fold of 3.52. Similar trend of protein content reduction from 0.418 mg/ml to 0.131mg/ml was observed in the purification of Pichia sp.Dw2 laccase (table 3). The highest specific activity and purification fold of 0.505U/mg of protein and 3.776 respectively were recorded after dialysis.
Table (8):
Isolate code, Phenotypic identity, Molecular identity, Percentage similarity and Accession number
Isolate Code |
Phenotypic Identity |
Molecular Identity |
Percentage Similarity |
Accession Number |
|---|---|---|---|---|
DW1 |
Kluyveromyces sp |
Kluyveromyces dobzhanskii |
100 |
KP420029 |
DW2 |
Pichia sp |
Pichia manshurica |
99 |
KP420030 |
The result of the molecular characterization confirmed the real identities of the isolated yeasts. Table 8 shows the Isolate code, Phenotypic identity, Molecular identity, Percentage similarity and Accession number of the two identified yeast isolates. Based on the BLAST search of the complete sequence of ITS region the two yeast strains used for this research work, DW1 strain was found to be in closest homology of 100% with Kluyveromyces dobzhanskii and DW2 strain in closest homology of 99% with Pichia manshurica. The sequences of the two yeast isolates were deposited in the GenBank database and assigned with respective accession numbers. The selected isolates were identified as Kluyveromyces dobzhanskii DW1 with Accession number – KP420029 and Pichia manshurica DW2 with Accession number – KP420030.
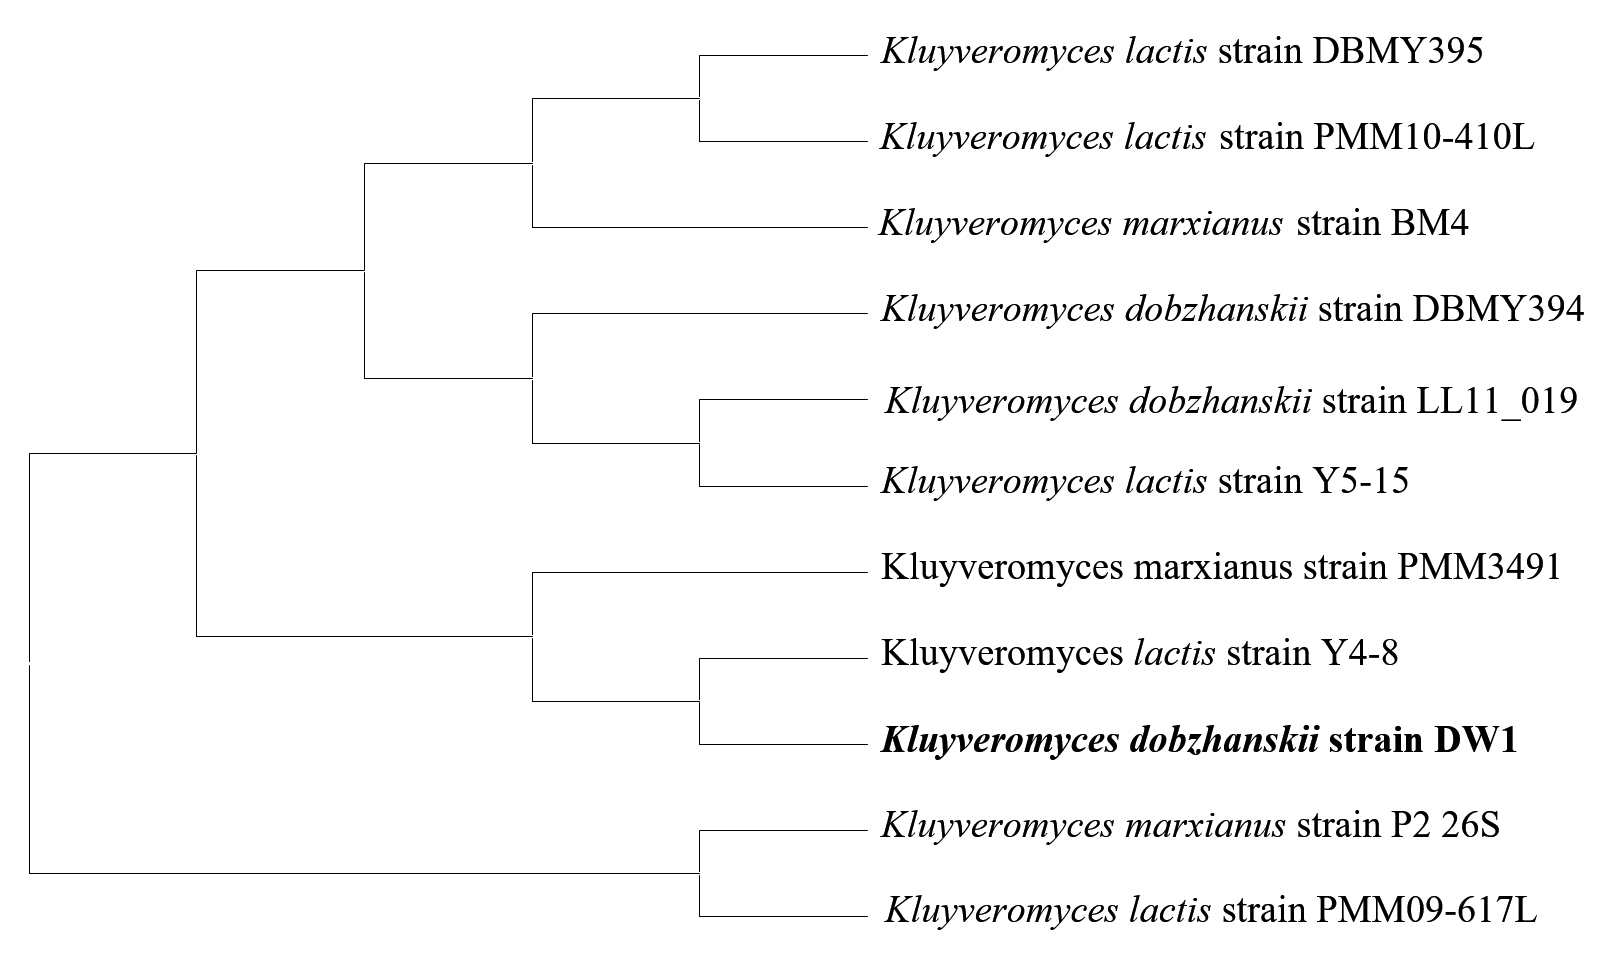
Fig. 12. Phylogenetic tree of Kluyveromyces dobzhanskii DW1 based on sequences of the ITS1/ITS2 region of the 18S rDNA gene. The tree shows the position of Kluyveromyces dobzhanskii with respect to closely related Kluyveromyces species
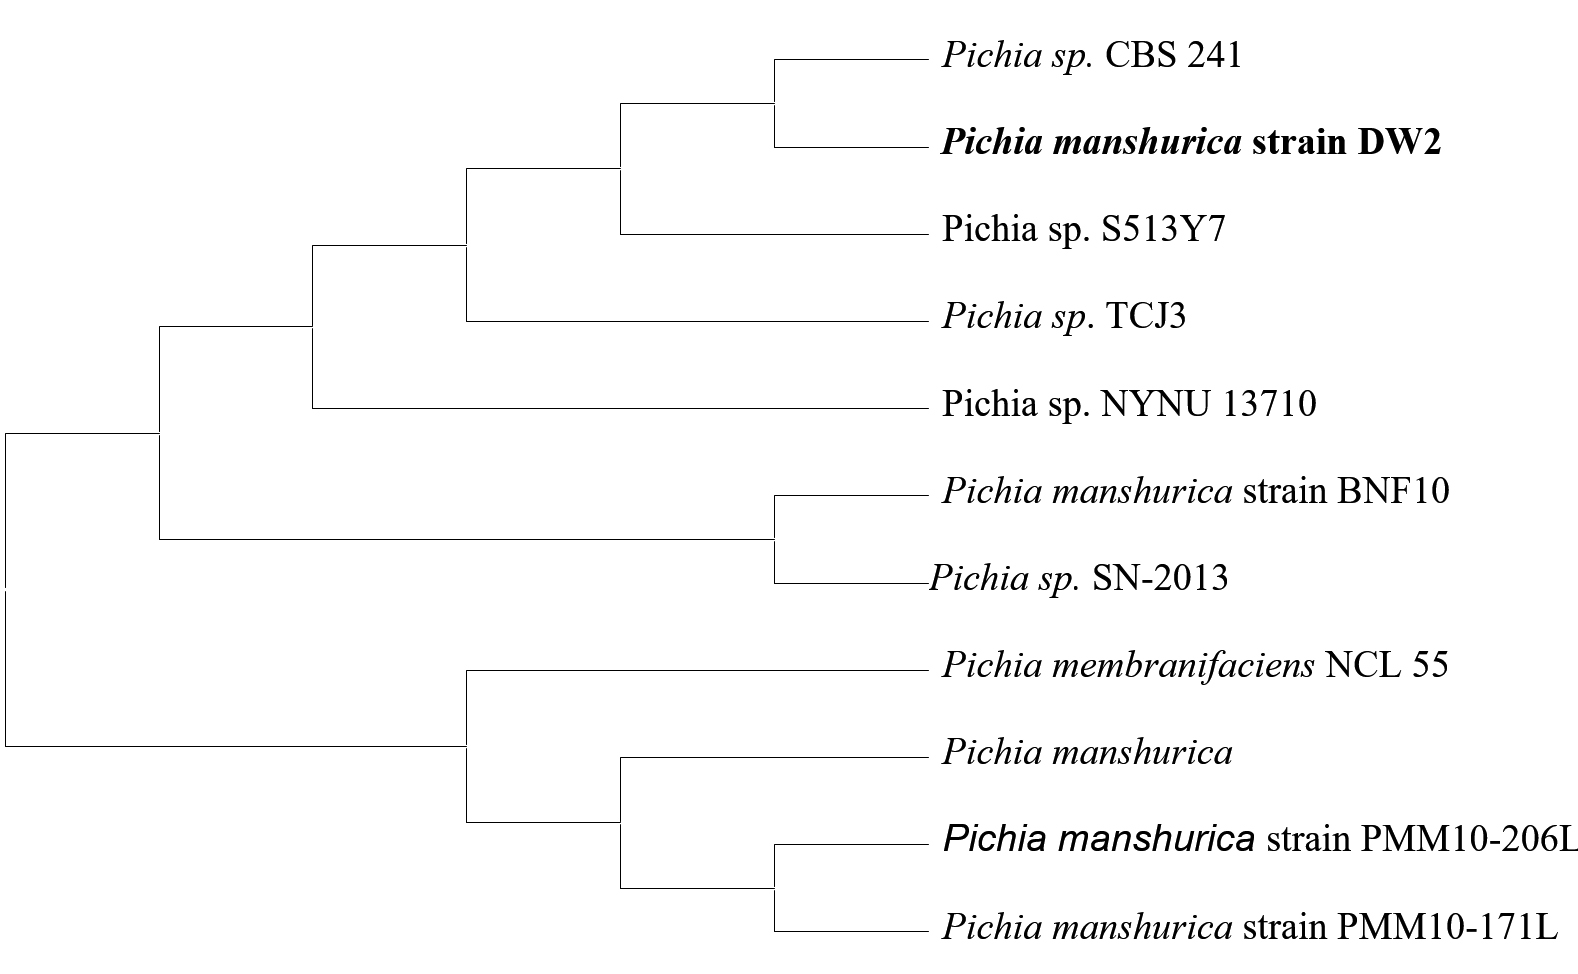
Fig. 13. Phylogenetic tree of Pichia manshurica DW2 based on sequences of the ITS1/ITS2 region of the 18S rDNA gene. The tree shows the position of Pichia manshurica with respect to closely related Pichia species
Figures 12 and 13 shows the phylogenetic tree generated from the 18S rDNA sequences of 11 taxa show the relationship of the 2 cultures with the reference taxa. The phylogenetic tree was structured by the neighbor joining method from the distance data generated by alignment of the nucleotide sequences.
The yeast isolates with the best laccase potential in this work were isolated from decaying wood soil samples which may be due to the intensive ligninolytic activities taking place in the soil synergistically with other soil fungi. Microbes showed variability in their response with several indicators compounds which was in accordance with the report of 10Baldrian (2004), who attributed this, to preferential affinity towards the various groups of substrates (ortho- and para-diphenols). Positive response of all the microbes in this study to hydroquinone and acetaminophen was in agreement with the finding of 2Thurston (1994) that, simple diphenols are good substrates for most laccases. The dark brown colour formation of the positive microbes was reported to have been due to the reactive quinone product generated during reaction, which will often spontaneously polymerise to form dark brown or black melanoid pigments 39(Ferrar et al., 1995).
Low glucose concentration was observed to be the optimal carbon source for laccase production, an observation similar to that reported for Ganoderma lucidum 32(Ding et al., 2012). Enzyme activity was observed to sharply increase when glucose concentration depleted indicating laccase production to be a part of secondary metabolism.
Inorganic nitrogen (NaNO3) was found to be the best nitrogen source for laccase production. This is in agreement with the report that an inorganic nitrogen source, ammonium nitrate favoured high laccase production in white rot fungi like Lentinula edodes 40(Buswell et al., 1995). In addition, 41Staji et al. (2006) showed best activity of laccase by Pl. ostreatus HAI 493 and Pleurotus eryngii with ammonium sulphate as nitrogen source 41. From this study, it can be deduced that nitrogen limitation is required for the optimal production of laccase which is in concordance to reports of 42Eggert et al., (1996) and 43Vasconcelos et al. (2000).
The enzyme production that was found to be increasing gradually with the increase in initial pH reached the maximum at 6.0. Sivukamar et al. (2010)44 gave a similar report of pH 6.0 as suitable for the maximum laccase production by Ganoderma sp. Contrary to this, an alkaline range of 7.5 was reported for a mangrove isolate, S. psammoticus 45(Niladevi and Prema, 2007). The optimum pH was found to be dependent also on the environment of the microorganisms involved rather than on the enzyme only 46(Shulter and Kargi, 2000) as the pH was the optimum for growth in Ganoderma and Streptomyces reported above.
The effect of various incubation temperatures also indicated that, by increasing the incubation temperature above 30oC for Kluyveromyces sp.Dw1 and 25oC for Pichia sp.Dw2, a gradual decrease in laccase production was observed. Similar reports were given: 31oC was the optimum temperature for laccase production in Marasmius sp.47(Risdianto et al., 2010), 28oC for laccase production in the edible mushroom, Schizophyllum commune 48(Adejoye and Fasidi, 2010) and Pleurotus ostreatus HP-1 49(Patel et al., 2009). This was in line with the report of Zadrazil and others 50(1999) that temperatures higher than 30oC caused reduction in ligninolytic enzymes production which could be due to the alteration of cell membrane composition and stimulation of protein catabolism.
Rice bran and cane bagasse were found to be the best lignocellulosic substrates for laccase production, this was supported by the report of 51Chawachart et al. (2004) that rice bran was the most efficient substrate for laccase production by Coriolus versicolor strain RC3. This was in contrast with the report of 52Elsayed and others (2012) when rice bran gave the least laccase activity in Pleurotus ostreatus ARC280 and also cane bagasse in Streptomyces psammoticus. Generally, reports have shown that most of these wastes increased laccase activity more than defined medium due to the water-soluble aromatic or phenolic compounds derived from different lignocellulosic substrates that substantially increase the production of ligninolytic enzymes in white-rot fungi 53,54(Crestini et al., 1996; Kapich et al., 2004).
The results of the studies on different laccase inducers indicated that all the inducers used in this study were capable of enhancing laccase production in both isolates. Similar result was found in S. psammoticus 45(Niladevi and Prema, 2007). The best inducer for yeast Kluyveromyces sp.Dw1 was copper sulphate which agrees with the report of 8Palmieri et al., (2010) on S. psammoticus, and tannic acid for Pichia sp.Dw2. This may be due to the presence of copper as a laccase cofactor which presents four cupric ions, each associated with one single polypeptide chain 2(Thurston, 1994) but evidence has also shown that this element may play an important role in laccase genes regulation at transcription level as shown in many fungi like Trametes versicolor 56(Collins and Dobson, 1997) while tannic acid induction may be due to increase in the phenolic compounds of the medium which increase laccase activity 57(Boerner and Brinkman, 2003).
Laccase from Kluyveromyces sp.Dw1 and Pichia sp.Dw2 had the optimum pH, for which the enzyme activity is maximum with ABTS as substrate within the slightly alkaline range (8-9). In this pH optimum domain, the proton acceptor and proton donor groups of the active centre are in ionized state necessary for the enzyme to be active. The laccase activity within this range was stable although the pH stability domain doesn’t necessary coincide with reaction rate optimum domain according to 58Xu, (1997). This stability was reported in laccases from Melanocarpus albomyces 59(Kiiskinen et al., 2002), Pleurotus ostreatus 60(Palmieri et al., 2003) and Perenniporia tephropora 61(Ben Younes et al., 2007) that have good stability at neutral and slightly alkaline pH values. This was contrary to the findings of 62Holker et al. (2002) on Chalara (syn. Thielaviopsis) paradoxa CH 32 with the optimal pH range of 4.0 to 6.0. These differences in pH optimum of the laccases from the different organisms may be due to the report of 58Xu (1997) that the optimum pH values are characteristic for each enzyme and that this depends on the environment composition, temperature and enzyme stability in acidic and alkaline environment.
The optimum temperatures for activity of Kluyveromyces sp.Dw1 and Pichia sp.Dw2 laccases were 30°C and 50°C respectively, within which they retained their high activity. Laccase enzymes with these optimum temperatures for activity have been described, for example, the laccase from G. lucidum with the highest activity at 25°C 63(Ko et al., 2001), the laccase from Daedalea quercina was very stable below 45°C (Baldrian, 2004)10. However, 64Liers et al. (2007) found that the highest activity of Xylaria polymorpha laccase enzyme was observed between 55° and 60°C. 65Dias et al. (2003) reported that Phanerochaete chrysosporium ATCC 24725 laccase enzyme displayed maximum activity at 50–60°C with the standard ABTS assay65. The difference in thermal stability at different temperatures may depend on the different sources of the microorganisms. The temperature stability varies considerably 55(Baldrian, 2006).
The laccases retained their activity in the presence of the different metal ions even at the highest concentration (5.0mM) used except for Ba2+ and Li+. This agrees with 66Sadhasivam et al. (2008) who showed that the metals at a concentration of 1.0mM had no significant effect over Trichoderma harzianum WL1 laccase activity 66. In contrast to this study, the purified laccase from the edible mushroom Lentinula edodes was inhibited in the presence of 1mM of most of the metal ions used in this work 67(Nagai et al., 2002). Laccases from both Kluyveromyces sp.Dw1 and Pichia sp.Dw2 were slightly affected by the inhibitors (EDTA, urea, dinitrophenol and benzoic acid) except Kluyveromyces sp.Dw1 laccase that was markedly inhibited by urea and dinitrophenol even at the lowest concentration. Similar mild inhibition was reported by 66Sadhasivam et al. (2008). T. atroviride laccase also was not sensitive to EDTA 68(Chakroun et al., 2010). Bollag and Leonowicz (1984)69 showed that these inhibitors bind to the type 2 and type 3 copper, resulting in an interruption of the internal electron transfer and activity inhibition69.
The kinetic studies of the laccases showed there was an increase in activity with increasing laccase concentration with fixed concentration of ABTS substrate up to 480µl for Kluyveromyces sp.Dw1 and 580µl for Pichia sp.Dw2 laccase after which there was a decrease in activity. Km for Kluyveromyces sp.Dw1 and Pichia sp.Dw2 laccases were 0.08mM and 0.12mM with ABTS substrate at pH 5.0. 70Robles et al. (2002) reported that the Km of laccase from Chalara (syn. Thielaviopsis) paradoxa CH 32 by using ABTS as a substrate at pH 4.5 was 0.77 mM while Ceriporiopsis subvermispora at pH 3.5 had Km value of 1.6 mM using Guaiacol 71(Fukushima and Kirk, 1995). This observation of the different Km values confirms the suggestion of 72Banerjee and Vohra (1991) that attributed these differences to be due to alteration of culture conditions, pH and substrate used.
The laccase enzymes from the isolates were purified between 2.08 to 3.78 fold using DEAE Sepharose G-100 column chromatography. In agreement with this report, laccases from Ganoderma lucidum 63(Ko et al., 2001) and Coriolus hirsutus 73(Shin and Lele, 2000) were purified to 2.6 and 3.3 fold respectively using DEAE Sepharose column chromatography while a higher 7.19 purification fold of G. lucidum laccase was obtained by 32Ding and others (2011) using Sephacryl S-100 HR column.
There have been quite a number of researches on heterologous expression of laccase gene from basidiomycetes in ascomycetes (which serve as the host), however none has shown the production of laccase enzyme from the yeast strains. Although 74Faramarzi and Forootanfar (2011) conducted a similar study and isolated a laccase producing ascomycetes Paraconiothyrium variabile. 75Nishibori et al. (2013) evaluated the heterologous expression of laccase gene from Trametes versicolor in Pichia pastoris75. Also, in yeast research by 76Ranieri et al. (2009) they reported the production of the lcc1 laccase of Trametes trogii in strains of Kluyveromyces lactis, using the pyruvate decarboxylase promoter as an expression system76.
From this study, Kluyveromyces dobzhanskii Dw1 and Pichia manshurica Dw2 had the potential of producing laccase that oxidized ABTS when grown in a slightly acidic medium using glucose (10g/l) and nitrate of sodium (3g/l) at incubation temperature of 30° and 35°C respectively. Higher laccase activity was observed with the use of agro wastes and inducers like copper sulphate and acetaminophen.
- Mayer, A.M., Staples, R.C. Laccase: new functions for an old enzyme. Phytochem.,2002; 60: 551–65.
- Thurston, C.F. The structure and function of fungal laccase. Microbiol., 1994; 140: 9- 26.
- Suzuki, T., Endo, K., Ito, M., Tsujibo, H., Miyamoto, K., Inamori, Y. A. thermostable laccase from Streptomyces lavendulae REN-7: purification, characterization, nucleotide sequence, and expression, Biosci. Biotech. Biochem.,2003; 67: 2167-75.
- Givaudan, A., Effosse, A., Faure, D., Potier, P., Bouillant, M.L., Bally, R. Polyphenol oxidase in Azospirillum lipoferum isolated from rice rhizosphere: evidence for laccase activity in non-motile strains of Azospirillum lipoferum. FEMS Microbiol. Lett.,1993; 108: 205–10.
- Martins, L.O, Soares, C.M, Pereira, M.M, Teixeira, M, Costa, T, Jones, G.H., Henriques, A.O. Molecular and biochemical characterization of a highly stable bacterial laccase that occurs as a structural component of the Bacillus subtilis endospore coat. J. Biol. Chem., 2002; 277: 18849–59.
- Arias, M.E., Arenas, M., Rodr1´guez, J., Soliveri, J., Ball, A.S., Herna´ndez, M. Kraft pulp bio-bleaching and mediated oxidation of a non-phenolic substrate by laccase from Streptomyces cyaneus CECT 3335. Appl. Environ. Microbiol., 2003; 69: 1953–58.
- Niku-Paavola, M.L., Karhunen, E., Salola, P., Raunio, V. Ligninolytic enzymes of the white-rot fungus Phlebia radiata. Biochem., 1988; 254: 877–84.
- Palmieri, G, Giardina, P, Bianco, C, Fontanella, B., Sannia, G. Copper induction of laccase isoenzymes in the ligninolytic fungus Pleurotus ostreatus. Appl. Environ. Microbiol., 2000; 66: 920–24.
- Bourbonnais, R., Paice, M.G., Reid, I.D., Lanthier, P., Yaguchi, M. Lignin oxidation by laccase isozymes from Trametes versicolor and role of the mediator 2,2-azinobis(3-ethylbenzthiazoline-6-sulfonate) in kraft lignin depolymerization. Appl. Environ. Microbiol. 1995; 61: 1876–80.
- Baldrian, P. Purification and characterization of laccase from the white rot fungus Daedalea quercina and decolourization of synthetic dyes by the enzyme. Appl. Microbiol. Biotech., 2004; 63: 560–563.
- Gianfreda, L., Xu, F., Bollag, J.M. Laccases: a useful group of oxido-reductive enzymes. Bioremediation, 1999; 3: 1–25.
- Xu F. Recent progress in laccase study: properties, enzimology, production and applications. In: Flickinger MC, Drew SW, editors. The encyclopedia of bioprocessing technology: fermentation, biocatalysis and bioseparation. New York: John Wiley and Sons; 1999; 1545–54.
- Shraddha, Shekher, R., Sehgal, S., Kamthania, M., Kumar, A. Laccase: Microbial Sources, Production, Purification, and Potential Biotechnological Applications. Enzy. Res., 2011; 2011: 1-11.
- Williamson, P.R. 1994. Biochemical and molecular characterization of the diphenol oxidase of Cryptococcus neoformans– identification as a laccase. J. Bacteriol., 1994; 176: 656–64.
- Zhu, X.D., Gibbons, J., Garcia-Rivera, J., Casadevall, A., Williamson, P. R. Laccase of Cryptococcus neoformans is a cell wall-associated virulence factor. Infect. Immunol., 2001; 69: 5589–96.
- Ikeda, R., Sugita, T., Jacobson, E.S., Shinoda, T. Effects of melanin upon susceptibility of Cryptococcus to antifungals. Microbiol. Immunol., 2003; 47: 271–77.
- Jimenez M, Gonzalez A.E, Martinez M.J, Martinez, A.T., Dále, B. E. Screening of yeasts isolated from decayed wood for lignocellulose degrading enzyme activities. Mycol. Res., 1991; 95: 1299–1302.
- Jo¨nsson, L. J., E. Palmqvist, Nilvebrant, N.O., Hahn-Ha¨gerdal, B. Detoxification of wood hydrolysates with laccase and peroxidase from the white-rot fungus Trametes versicolor. Appl. Microbiol. Biotech., 1998; 49: 691– 97.
- Cassland, P., Jo¨nsson, L. J. Characterization of a gene encoding Trametes versicolor laccase A and improved heterologous expression in Saccharomyces cerevisiae by decreased cultivation temperature. Appl. Microbiol. Biotech., 1999; 52:393–400.
- Terron M.C., Gonzalez T., Carbajo J.M., Yagu¨ e S., Cuenca A.A., Tellez, A. Structural close related aromatic compounds have different effects on laccase activity and on lcc gene expression in the ligninolytic fungus Trametes sp. I-62, Fungal Gen. Biol., 2004; 4: 954– 62.
- Couto, S.R., Toca Herrera, J.L. Industrial and biotechnological applications of laccases: a review. Biotech. Adv., 2006; 24 (5), 500–13.
- Couto, S.R., Toca-Herrera, J. L.”Laccase production at reactor scale by filamentous fungi,” Biotech. Adv.,2007; 25, (6), 558–69.
- Nishida, T., Yoshinori, K., Mimura, A., Takahara, Y. Lignin biodegradation by wood-rotting fungi I. Screening of lignin degrading fungi. Mokuzai Gakkaishi, 1988; 34: 530–36.
- De Jong, E., de Vries, F.P., Field, J.A., van der Zwan, R.P., de Bont, J.A.M. 1992. Isolation and screening of basidiomycetes with high peroxidative activity. Mycol. Res., 1992; 12: 1098–1104.
- Barbosa, A.M., Dekker, R.F.H., Hardy, G.E. Veratryl alcohol as an inducer of laccase by an ascomycete, Botryosphaeria sp., when screened on the polymeric dye Poly R-478. Lett. Appl. Microbiol., 1996; 23: 93–96.
- Luterek, J., Gianfreda, L., Wojtas-Wasilewska, M., Rogalski, J., Jaszek, M., Malarczyk, E., Dawidowicz, A., Finks-Boots, M. Screening of the wood-rotting fungi for laccase production: induction by ferulic acid, partial purification, and immobilization of laccase from the high laccase-producing strain, Cerrena unicolor. Acta Microbiol. Pol., 1997; 46: 297–311.
- Harrigan, W. F, MacCance, M. E (1966). Laboratory methods in Microbiology. AP London. p 342.
- Kiiskinen, L.L., Kruus, K., Bailey, M., Ylosmaki, E., Siika-aho, M., Saloheimo M. Expression of Melanocarpus albomyces laccase in Trichoderma reesei and characterization of the purified enzyme. Microbiol., 2004; 150: 3065-3074.
- Cavallazzi, J.R.P., Kasuya, C.M., Soares, M.A. 2005. Screening of inducers for laccase production by Lentinula edodes in liquid medium. Brazillian J. Microbiol., 2005; 36: 383-87.
- Raghunathan, D., Arunachalam, K. D. Optimization of laccase enzyme Production through submerged and solid state fermentation of agro Wastes by the fungi isolated from saw mill wastes and its application in the Biodegradation of lignin, cypermethrin and biodecolourization of azo dyes. Thesis. 2011; 1-338.
- Mongkolthanaruk, W., Tongbopit, S and Bhoonobtong, A. Independent behaviour of bacterial laccases to inducers and metal ions during production and activity. Afr. J. Biotech., 2012; 11(39): 9391-98.
- Ding, Z., Peng, L. Chen, Y., Zhang, L., Guiyang Shi, Z., Zhang, K. Production and characterization of thermostable laccase from the mushroom, Ganoderma lucidum, using submerged fermentation. Afr. J. Microbiol. Res., 2012; 6(6):1147-1157.
- Saito, T., Hong, P., Kato, K., Okazaki, M., Inagaki, H., Maeda, S., Yokogawa, Y. Purification and characterization of an extracellular laccase of a fungus (family Chaetomiaceae) isolated from soil. Enzy. Microb. Technol., 2003; 33: 520–26
- Aruna S., Gangatharaprabhu B., Prabhakaran S. Screening, Production and Partial Purification of Laccase Enzyme from White Rot Fungi. Inter. J. Interdiscipl. Res. Rev., 2012; 1:51-57
- Bakri, Y., Masson, M., Thonart, P. Isolation and Identification of Two New Fungal Strains for Xylanase Production. Appl. Biochem. Biotech., 2010; 162: 1626–1634.
- Altschul, S.F., Madden, T.L., Schaffer, A.A., Zhang, J., Zhang, Z., Miller, W., Lipman, D.J. Gapped BLAST and PSI-BLAST: a new generation of protein database search programs. Nucleic Acids Res., 1997; 25: 3389-3402.
- Thompson, J.D., Higgins, D.G., Gibson, T.J. CLUSTAL W: improving the Sensitivity of progressive multiple sequence alignment through sequence weighting, position-specific gap penalties and weight matrix choice. Nucleic Acids Res., 1994; 22: 4673–80.
- Tamura, K.J., Dudley, M. Nei; Kumar, S. MEGA 4: Molecular Evolutionary Genetics Analysis (MEGA) software version 4.0. Mol. Biol. Evol., 2007; 24: 1596-99.
- Ferrar, P.H., Barberel, S.l., Ginger, M.R., Walker, R.L. Laccase – new roles for an old enzyme. New Zealand Biosci., 1995; 3: 7-13.
- Buswell, J. A.; Cai, Y., Chang, S. T. “Effect of nutrient nitrogen and manganese on manganese peroxidase and laccase production by Lentinula (Lentinus) edodes,” FEMS Microbiol. Lett., 1995; 128(1), 81–88.
- Stajic, M., L. Persky, D. Friesem, Y. Hadar, S. P. Wasser, Nevo, E., Vukojevic, J. Effect of different carbon and nitrogen sources on laccase and peroxidases production by selected Pleurotus species. Enzy. Microbiol. Tech., 2006; 38: 65–73.
- Eggert, C., Temp, U., Eriksson, K. L. The ligninolytic system of the white rot fungus Pycnoporus cinnabarinus: Purification and characterization of the laccase. Appl. Environ. Microbiol., 1996; 62(4): 1151-58.
- Vasconcelos, A. F. D., Barbosa, A. M., Dekker, R. F. H., Scarminio, I. S., Rezende, M. I. Optimization of laccase production by Botryosphaeria sp. in the presence of veratryl alcohol by the response-surface method. Biochemistry, 2000; 35(10): 1131-38.
- Sivakumar, R., Rajendran, R., Balakumar, C., Tamilvendan, M. Isolation, screening and optimization of production medium for thermostable laccase production from Ganoderma sp. Inter. J. Eng. Sci. Tech., 2010; 2(12): 7133-41.
- Niladevi, K.N., Prema, P. Effect of inducers and process parameters on laccase production by Streptomyces psammoticus and its application in dye decolourization. Biores. Tech., 2007; 99: 4583-89.
- Shulter, M.L., Kargi, F. 2000. Bioprocess engineering basic concept. Prentice Hall of India Pvt Ltd, New Delhi, India.
- Risdianto, H., Harjati, M., Suhardi, S., Budhi, Y. Setiadi, T. Production of laccase by Marasmius sp. grown in rice straw using a packed bed bioreactor. Conference proceeding 19th Regional symposium of Chemical Engineering (RSCE 2012), November, 2012. Bali, Indonesia.
- Adejoye, O.D. and Fasidi, I.O. Effect of cultural conditions on biomass and laccase production in submerged medium by Schizophyllum commune (Fries), a Nigerian edible mushroom. Elec. J. Environ. Agric. Food Chem., 2010; 9(3): 600-609.
- Patel, H., Gupte, A., Gupte, S. Effect of different cultural conditions and inducers on production of laccase by a basidiomycete fungal isolate Pleurotus ostreatus HP-1 under solid state fermentation. Biores., 2009; 4(1): 268-284.
- Zadrazil, F., Gonser, A., Lang, E. Influence of incubation temperature on the secretion of extracellular ligninolytic enzymes of Pleurotus sp. and Dichomitus squalens into soil. Proceedings of the Conference on Enzymes in the Environment. Activity, Ecology and Applicants, 12-16, July, 1999. Granada, Spain.
- Chawachart, N., Khanongnuch, C., Watanabe, T. and Lumyong, S. Rice bran as an efficient substrate for laccase production from thermotolerant basidiomycete Coriolus versicolor strain RC3. Fungal Diversity, 2004; 15: 23-32.
- Elsayed, M.A., Hassan, M.M., Elshafei, A.M., Haroun, B.M., Othman, A.M. Optimization of Cultural and Nutritional Parameters for the Production of Laccase by Pleurotus ostreatus ARC 280. British Biotech. J. 2012; 2(3): 115-32.
- Crestini, C., D’Annibale, A., Giovannozzi-Sermani, G. Aqueous plant extracts as stimulators of laccase production in liquid cultures of Lentinus edodes. Biotech. Tech., 1996; 10: 243–48.
- Kapich, A.N., Prior, B.A., Botha, A., Galkin, S., Lundell, T., Hatakka, A. Effect of lignocellulose-containing substrate on production of ligninolytic peroxidases in submerged cultures of Phanerochaete chrysosporium ME-446. Enzy. Microbiol. Tech., 2004; 34: 187–95.
- Baldrian, P. Fungal laccases-occurrence and properties. FEMS Microbio. Rev. 2006; 30: 215–42.
- Collins, P.J. Dobson, A.D.W. Regulation of laccase gene transcription in Trametes versicolor. Appl. Environ. Microbiol., 1997; 63: 3444– 50.
- Boerner R.E.J., Brinkman, J.A. Fire frequency and soil enzyme activity in southern Ohio oak-hickory forests. Appl. Soil Ecol., 2003; 23: 137-46
- Xu, F. “Effects of redox potential and hydroxide inhibition on the pH activity profile of fungal laccases,” J. Biol. Chem., 1997; 272(2), 924–28.
- Kiiskinen L.L, Viikari, L., Kruus, K. Purification and characterisation of a novel laccase from the ascomycete Melanocarpus albomyces. Appl. Microbiol. Biotech., 2002; 59: 198–204.
- Palmieri, G., Cennamo, G., Faraco, V., Amoresano, A., Sannia, G., Giardina, P. Typical isoenzymes from copper supplemented Pleurotus ostreatus cultures. Enzy. Microbiol. Tech., 2003; 33: 220–30.
- Ben Younes, S., Mechichi, T., Sayadi, S. Purification and characterization of the laccase secreted by the white rot fungus Perenniporia tephropora and its role in the decolourization of synthetic dyes. J. Appl. Microbiol., 2007; 102: 1033–42.
- Holker, U., Dohse, J., Hofer, M. Extracellular laccases in ascomycetes Trichoderma atroviride and Trichoderma harzianum. Folia Microbiol., 2002; 47: 423–27.
- Ko, E.M., Leem, Y.E., Choi, H.T. Purification and characterization of laccase isozymes from the white-rot basidiomycete Ganoderma lucidum. Appl. Microbiol. Biotech., 2001; 57: 98–102.
- Liers, C., Ullrich, R., Pecyna, M., Schlosser, D., Hofrichter, M. Production purification and partial enzymatic and molecular characterization of a laccase from the wood-rotting ascomycetes Xylaria polymorpha. Enzy. Microbiol. Tech., 2007; 41: 785–93.
- Dias, A.A., Bezerra, R.M., Lemos, P.M., Pereira, A.N. In vivo and laccase- catalysed decolourization of xenobiotic azo dyes by a basidiomycetous fungus: characterization of its ligninolytic system. World J. Microbiol. Biotech., 2003; 19: 969–75.
- Sadhasivam, S., Savitha, S., Swaminathan, K., Lin, F. Production, purification and characterization of mid-redox potential laccase from a newly isolated Trichoderma harzianum WL1. Process Biochem., 2008; 43: 736–42.
- Nagai, M., Sato, T., Watanabe, H., Saito, K., Kawata, M., Enei, H. Purification and characterization of an extracellular laccase from the edible mushroom Lentinula edodes and decolourization of chemically different dyes. Appl. Microbiol. Tech., 2002; 60: 327–35.
- Chakroun, H., Mechichi, T., Martinez, M.J., Dhouib, A., Sayadi, S. Purification and characterization of a novel laccase from the ascomycete Trichoderma atroviride: application on bioremediation of phenolic compounds. Process Biochem., 2010; 45: 507–13.
- Bollag, J.M., Leonowicz, A. Comparative studies of extracellular fungal laccases. Appl. Environ. Microbiol., 1984; 48: 849–54.
- Robles, A., Lucas, R., Mart1´nez-Canamero, M., Omar, N.B., Pe´rez, R., Ga´ lvez, A. Characterisation of laccase activity produced by the hyphomycete Chalara (syn. Thielaviopsis) paradoxa CH32. Enzy. Microbiol. Tech., 2002; 31: 516–22.
- Fukushima, Y., Kirk, T. Laccase component of the Ceriporiopsis subvermispora lignin degrading system. Appl. Environ. Microbiol., 1995; 61(3): 872–76.
- Banerjee, U.C., Vohra, R.M. Production of laccase by Curvularia sp. Folia Microbiol., 1991; 36: 343–46.
- Shin, K.S., Lee, Y.J. Purification and characterization of a new member of the laccase family from the white-rot basidiomycete Coriolus hirsutus. Arch Biochem. Biophys., 2000; 384: 109–15.
- Faramarzi, M.A., Forootanfar, H. Biosynthesis and characterization of gold nanoparticles produced by laccase from Paraconiothyrium variabile. Colloids and Surfaces B, 2011; 87: 23–27.
- Nishibori, N., Masaki, K., Lefuji, H. Comparison of laccase production levels in Pichia pastoris and Cryptococcus sp. S-2. J. Biosci. Bioeng., 2013; 115(4): 394-99.
- Ranieri, D., Colao, M.C., Ruzzi, M., Romagnol, G., Bianchi, M. 2009. Optimization of recombinant fungal laccase production with strains of the yeast Kluyveromyces lactis from pyruvate decarboxylase promoter. FEMS, Yeast Res., 2009; 9(6): 892-902.
© The Author(s) 2017. Open Access. This article is distributed under the terms of the Creative Commons Attribution 4.0 International License which permits unrestricted use, sharing, distribution, and reproduction in any medium, provided you give appropriate credit to the original author(s) and the source, provide a link to the Creative Commons license, and indicate if changes were made.