

ISSN: 0973-7510
E-ISSN: 2581-690X
The focus of present study is to explore cotton stalk as potential source for bioethanol production. In this context, cotton stalk was subjected to series of treatment includes dual stage acid hydrolysis, followed by detoxification and fermentation subsequently. Detoxified hydrolysate obtained after first two treatment, having a sugar concentration of 11 g/L corresponds to yield of 0.396 g/g of biomass was exposed to fermentation by co-culture of Saccharomyces cerevisiae MTCC 36 and Pachysolen tannophilus MTCC 1077. Parametric optimization study reveals that test organisms in association utilized 93.84% of total available sugars in semi aerobic mode of fermentation having pH 5.5, inoculated with 10% (v/v) co culture inoculum, incubated with 120 rpm for first 24 h and then kept in static mode at 30oC till 48 h, produced maximum ethanol concentration of 4.96 g/L with fermentation efficiency of 87.52%. The obtained yield was recorded as 0.446 g/g of available sugar for fermentation (0.179 g/g of biomass).
Cotton stalk, Saccharomyces cerevisiae, Pachysolen tannophilus, Co-culture, Fermentation, Bioethanol.
Over the last few decades, progressive energy demand, inevitable depletion of fossil reservoir, negative impact of fossil fuel and consequent of greenhouse gasses; diverts the concentration of research towards an alternative energy sources. Many alternative fuel sources have been explored, and among them production of fuel ethanol from biomass seems to be an interesting alternative to traditional fossil fuel.1 Ethanol can be produced from variety of biomasses and among them; lignocellulosic biomass is a plentiful and economical resource for fermentable sugar that can serve as a source for ethanol production on a large scale.2
Global cotton production during 2015-16 has been estimated at 23.68 million metric tons. According to United State Department of Agriculture (USDA), India is expected to emerge as largest cotton producer in the world, estimated cotton area in country in 2015-16 (August to July) is 11.26 million hectors and cotton production is estimated as 6.3 million metric tons.3 The lignocellulosic nature and potential availability of cotton stalk open its way as renewable raw material for various commercial applications including ethanol production.4
Prior to ethanol fermentation by organisms; the feedstock needs to be process by scarification technology in order to retain fermentable sugars. In this regards acid hydrolysis is consider as simple and easy method to perform and is prominently used for depolymerization of biomass into fermentable sugar. However, the acid hydrolysis of lignocellulosic biomass was carried out in two stages including concentrated acid decrystallization followed by dilute acid hydrolysis with steam and heat treatment 5. Detoxification of acid hydrolysate was the next key step in series after hydrolysis. Since no separate delignification prior to acid treatment; and acid hydrolysis itself generates toxic compounds which negatively impact on fermentation process. To overcome these inhibitors, detoxification with over liming followed by charcoal treatment was applied on hydrolysate.6,7 The obtained hydrolysate of cotton stalk used as sole source of carbon (containing both hexose and pentose) for bioethanol production by using co culture of Saccharomyces cerevisiae and Pachysolen tannophilus (pentose fermenting yeast).8,9
Saccharomyces cerevisiae is the main species of yeast employed for ethanol production at industrial level since this microorganism is easy to handle, shows no high nutritional needs, can easily withstand 10-15% ethanol.10 Its robustness makes it a suitable organism for fermentation of lignocellulosic hydrolysate. However, the main disadvantage of this organism is lacking of mechanisms to take up pentose sugars as substrate. Therefore, Pachysolen tannophilus is used as pentose fermenting organism in co culture fermentation. Pachysolen tannophilus was the first yeast identified to have a significant capacity to convert xylose to ethanol. It ferments glucose, mannose, xylose, galactose, and even glycerol to ethanol except L-arabinose.11 Physiological behavior of Pachysolen tannophilus for ethanol production was quite different from Saccharomyces cerevisiae. It was revived that Pachysolen tannophilus first assimilate D- glucose before xylose, until total consumption and exhibits diauxic lag in growth and fermentation process. This suggests that, glucose repress induction of xylose reductase, xylose dehydrogenase and perhaps other enzyme involve in xylose metabolism. The cell cannot metabolize the xylose until they have consumed the glucose and before complete consumption small concentration of D-glucose disappears the blocking of xylose metabolism.12 Despite lots of research available for the conversion of pentose sugars into ethanol by Pachysolen tannophilus, it is still challenging to get the desired yield of ethanol utilizing pentose sugars at large scale.13
The main objective of the present study was to optimize different bioprocess parameters including, temperature, pH, aeration, agitation, inoculum size, and optimum time require for fermentation process using co culture of Saccharomyces cerevisiae and Pachysolen tannophilus, to achieve maximum ethanol concentration from cotton stalk hydrolysate. Moreover, work has also been performing in a direction to make a comparative account in between mono culture and co culture fermentation.
Raw Material
The cotton stalk of spp. Gossypium hirsutum NHH44 used in this research work was collected from the field of Marathwada region. The unwanted residues removed mechanically by shredding with knife, sundried, debarked, bailed and ground to 1 mm particle size and stored in tightly sealed plastic bags at room temperature for further studies.
Microorganism
The lyophilized cultures of Saccharomyces cerevisiae MTCC 36 and Pachysolen tannophilus MTCC 1077 were procured from Microbial Type Culture Collection, IMTECH-Chandigarh, India. The cultures were activated and maintained on Yeast and Malt Extract Agar (YM medium). The medium was prepared by adding 0.3% yeast extract, 0.3% malt extract, 0.5% peptone and 1 % glucose in distilled water. pH of the medium was adjusted to 6.5.
Compositional analysis
Holocelluloses, alpha cellulose and klason (acid insoluble) lignin content were determined by method adopted by Teramoto et al.14 Ash and moisture content of sample was determined by Laboratory Analytical Procedure number 001 (LAP # 001) and 005 (LAP # 005) respectively, from National Renewable Energy Laboratory (NREL) protocol. The individual monomer carbohydrate content was determined by the method of LAP # 002 of NREL using HPLC (Zodiac. Ltd), equipped with sugar monosaccharide column with RI detector (25 cm × 4.6 mm) using degassed Milli Q water as mobile phase in CFRD (Central Facilities for Research and Development) laboratory of Osmania University, Hyderabad, India.
Acid hydrolysis
Cotton stalk was subjected to dual stage sulfuric acid treatment. During its first stage 75% H2SO4 was used to decrystallize the biomass under specific sample acid ratio of 1:2 (by weight) at 4oC followed by dilution up to 1 N in second stage, then employing steam under pressure at 121oC in an autoclave for 30 minutes and four hour heat treatment at 90oC in water bath. During overall process aliquots were taken at regular interval of time for analysis of total fermentable sugars and glucose content by DNSA and GOD-POD method respectively.15
Neutralization and detoxification
The acid hydrolysate of cotton stalk was detoxified by addition of dried lime up to pH 10 for an hour and then filtration and by readjustment of pH up to 6 with acid. This is followed by 4% (w/v) charcoal treatment for half an hour with stirring and filtered. Aliquots were taken after each treatment and were checked for sugars, furans and phenolics. The detoxified hydrolysate was then used for fermentation studies 16.
Fermentation studies
Inoculum development
Preparation of cell mass
Cell mass required for inoculum development was obtained by growing each culture separately on YM medium in Erlenmeyer flask aerobically at 30ºC on rotary shaker incubator with 150 rpm for 48 h. After incubation, completely activated yeast cells were harvested by centrifugation with 4000 rpm at 4ºC for 10 min, repeatedly washed with distilled water and used as cell mass for inoculum development.
Inoculum preparation
Inoculum was prepared in detoxified hydrolysate solution of cotton stalk, supplemented with 0.5% yeast extract, 1% peptone and pH was adjusted to 5.5%. The yeast cells, harvested by centrifugation were added in inoculum and incubated on rotary shaker incubator with 150 rpm at 30ºC for 24 h and grown aerobically to promote healthy growth of yeast cells in hydrolysate and used as an inoculum for fermentation studies.
Quantification of cell mass
1 mL aliquot from each suspension was taken and performed serial dilution up to 10,5 from this, 100 µL of diluted culture was spread-plated on to YM agar plates and were incubated at 30ºC for 48 h and yeast colonies were counted to ensure that each time the inoculation stayed at approximately 6.0 × 10⁷cfu/mL corresponding to 10 g dry w/L.17
Fermentation
The detoxified hydrolysate of cotton stalk was employed as sole carbon source for fermentation. The hydrolysate was supplemented with 0.1% yeast extract, peptone, NH4Cl, KH2PO4 and 0.05% of MgSO4.7H2O, MnSO4, CaCl2.2H2O, FeCl3.2H2O and ZnSO4 in 250 mL Erlenmeyer flasks, adjusting the pH 5.5 and autoclaved at 110ºC for 20 min.18 Fermentation was initiated by transferring separately developed 10 % (v/v) inoculum of Saccharomyces cerevisiae MTCC 36 and Pachysolen tannophilus MTCC 1077. Proportion of Saccharomyces cerevisiae and Pachysolen tannophilus in each inoculum was in the ratio of 60:40 respectively, as was optimized by Sharma et al.8 Flasks were sealed with aluminum foil for development of anaerobic condition required for ethanol production and incubated at 30ºC on rotary shaker incubator with 100 rpm for first 18 h for utilization of oxygen in flask and then in static mode for 72 h. No air was supplied externally during process.
Parametric optimization of co culture
The different parameters evaluated in the current study were temperature, pH, aeration, inoculum size, agitation, and optimum time period for maximum ethanol production. Temperature and pH were optimized by varying it from 20oC to 40oC, and 4.0 to 6.5 respectively. Aeration level was optimized by following the method described by Chandel et al.19 In this process 250 mL of Erlenmeyer flasks were used for fermentation, and categorization was made as; Highly aerobic (50 mL of fermentation medium), Aerobic (100 mL of fermentation medium), Semi aerobic (150 mL of fermentation medium), Semi anaerobic (200 mL of fermentation medium), Anaerobic (250 mL of fermentation medium). Inoculum size was adjusted by varying the concentrations of co-culture form 6 % to 16 % (v/v). The agitation rate was optimized by stirring the flasks by varying the rotation speed from 60 rpm to 160 rpm on rotary shaker incubator followed by stirring the flasks from zero hour to 48 h with pre optimized agitation speed. Finally the optimum time period for fermentation was evaluated by keeping the entire obtained parameters constant and running the experiment up to 96 h.
Comparison of ethanol production by monoculture and co culture fermentation
The comparative account was studied to evaluate the efficiency of each culture i.e. Saccharomyces cerevisiae and Pachysolen tannophilus separately and combination of both.
Analytical methods
Determination of Cell mass
Sample obtained during fermentation was transferred to pre weighted centrifuged tube and were centrifuged at 10000 rpm for 10 min at 4ºC. The supernatant was collected and analyzed for concentration of ethanol and residual sugars in broth while pellet was repeatedly washed with distilled water and dried in hot air oven at 60ºC till constant weight. The difference between initial and final weight was recorded as cell biomass and expressed in g/L 20.
Sugars estimation by 3, 5, Di nitro salicylic acid (DNSA) method
The DNSA method of Miller,21 was adopted to quantify the amount of reducing sugars present in the sample.
Glucose estimation by GOD-POD method
Glucose oxidase method is an enzymatic assay for determination of glucose present in solution. The analysis was performed by following the guideline given by Bergmeyer et al.22
Determination of phenolic compounds
Total content of phenolic compound in hydrolysate was determined by Folin-Ciocalteus (FC) method.23
Furans estimation
Furans (furfural and hydroxy methyl furfural) were estimated with spectophotometric method as described by Martinez et al.6
Ethanol estimation by Gas Chromatography (GC)
Ethanol estimation was carried out after each experiment by taking part of supernatant of fermentation broth and filtered by 0.22 µm cellulose acetate filter for analysis by Gas Chromatography (Shimadzu Japan). All analysis was carried out according to NREL procedure LAP # 011, using ZB-Wax column (30 mm × 0.25 mm) with Flame Ionization Detector (FID).17
Fermentation efficiency
Fermentation efficiency was calculated as
Practical yield is the ethanol produced and theoretical yield is 0.511 gram per gram of sugar consumed.
Cell density
Cell density was measured turbido-metrically at 600 nm by using UV-VIS spectrophotometer.
Chemical composition of cotton stalk
The major components of any lignocellulosic materials are cellulose, hemicellulose and lignin and their concentration varies depending on growing location, season, harvesting methods, as well as analysis procedures.24 Cotton stalk used in the current study found to contain 24.18% of klason lignin, 3.05% of moisture, 0.95% of ash and 65.32% total holocellulose in which 40.60% ±-cellulose was detected. The results obtained in the current study are similar to the results of Silverstein et al.;25 reported 30 % cellulose, 13 % hemicellulose and 31% lignin in cotton stalk. Moreover, carbohydrate analysis by HPLC in the current study showed 42.40% glucan and 23.20% xylan is present in cotton stalk whereas, Binod et al.26 reported 33.3 % glucans and 14.8% xylan along with very small proportion of arabinan in the cotton stalks. Literature reports indicate that the lignin content of herbaceous plant materials were ranges from 10 % to 20 %, for hardwoods it ranges from 18 % to 25 % and soft wood contains 26 % to 34%. Moreover, 40% to 55% of total lignin is only present in bark of soft wood.27 In present investigation, klason lignin was reported to be less as expected which might be due to debarking of cotton stalk before use. Above finding concluded that, in cotton stalk, glucan is the dominant polysaccharide and xylan is identified as the second most abundant sugar.
Acid hydrolysis of cotton stalk
The effect of acid on cotton stalk was studied by performing two-step acid treatment including concentrated acid decrystallization followed by dilute acid hydrolysis. Cotton stalk when treated with 75% (v/v) sulphuric acid for decrystallization under specific sample acid ratio of 1:2 (by weight) at 4oC followed by dilution up to 1 N and steam under pressure at 121oC for 30 min and lastly four hour heat treatment at 90oC, yielded total sugar and specifically glucose of 0.49 g/g 0.36 g/g biomass. These results were in agreement with those of Liao et al.5 yielded glucose at a yield of 84% and hemicellulose at a yield of 80 % from fibers of dairy manure by using 75% (v/v) H2SO4 and upon results he reported that acid concentration was the most important factor to alter the sugar components (cellulose and hemicellulose) in dairy manure. The similar results were also reported by Romero et al.,28 yielded 92% hemicellulose fractions from dilute acid hydrolysis (0.75 N) of olive tree pruning.
Neutralization and detoxification
The byproducts of hydrolysis such as furans and phenolics were also formed with a concentration of 1.971 mg/L and 4.909 g/L respectively. Fermentation using these inhibitors is characterized by slow kinetics, with limited yield and productivity. To overcome this problem, the obtained hydrolysate was over limed which gives maximum reduction in furans from 1.971 mg/L to 0.312 mg/L (84.17 % reduction), while comparatively less amount of phenolics were reduced i.e. from 4.90 g/L to 4.18 g/L (14.68 % reduction) as shown in Fig. 1. It was noticed that over liming has drastically affects the furans reduction while other inhibitors such as phenolics are comparatively less affected by it as was already reported by Martinez et al.6 After over liming, efforts were taken to remove phenolics compounds by exposing it with activated charcoal and resultant data showed that the concentration of phenolics were removed from 4.181 g/L to 0.545 g/L (86.97% reduction). These findings were also in agreement with Miyafugi et al.29 No doubt 19.84% of total fermentable sugar (in which 15.49% glucose was present) losses were also be reported during the process. The detoxified hydrolysate achieved having sugar concentration of 11 g/L corresponds to a yield of 0.396 g/g of biomass, is then exposed to fermentation for ethanol production.
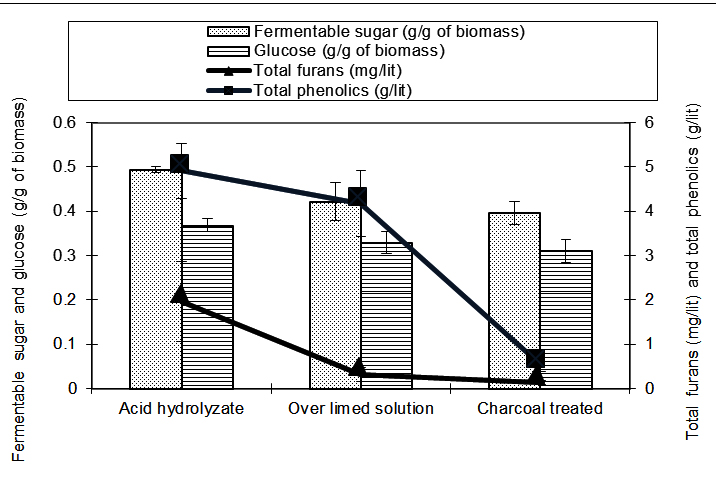 Fig. 1. Concentration of sugars, furans and phenolics, present before and after neutralization and detoxification process
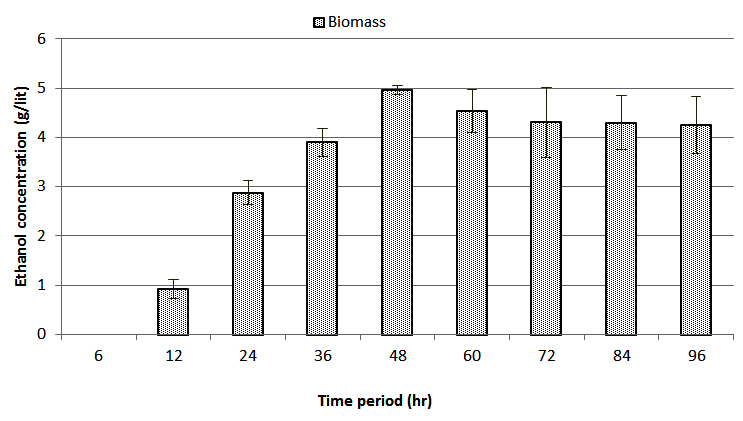 Fig. 2a. Ethanol concentration (g/L) obtained after optimized parameter using co culture of S. cerevisiae and P. tannophilus
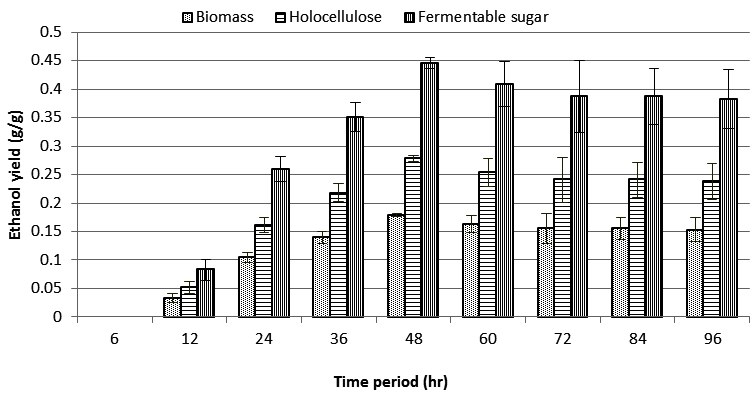 Fig. 2b. Ethanol yield (g/g) obtained after optimized parameter using co culture S. cerevisiae and P. tannophilus
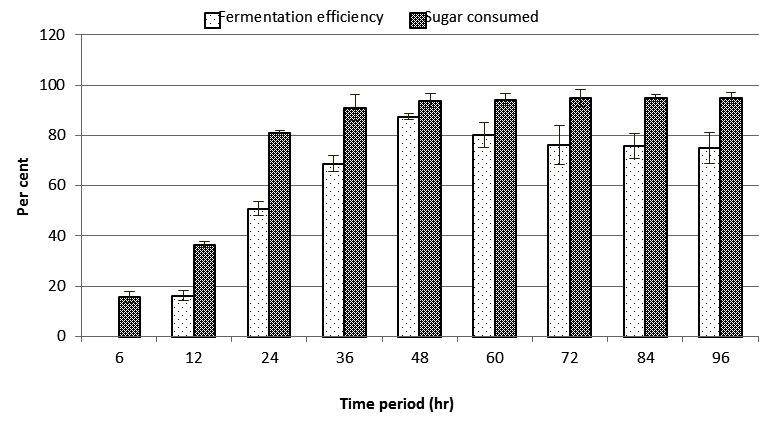 Fig. 2c. Sugar consumption and fermentation efficiency (%) during ethanol production using co culture of S. cerevisiae and P. tannophilus
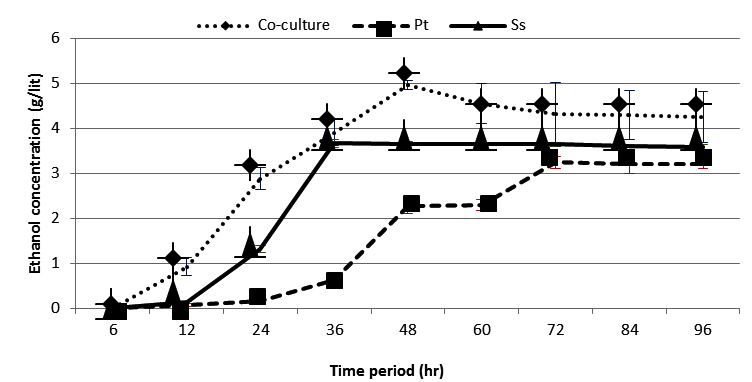 Fig. 3a. Ethanol concentration (g/L) using monoculture of S. cerevisiae and P. tannophilus each and with co culture of both
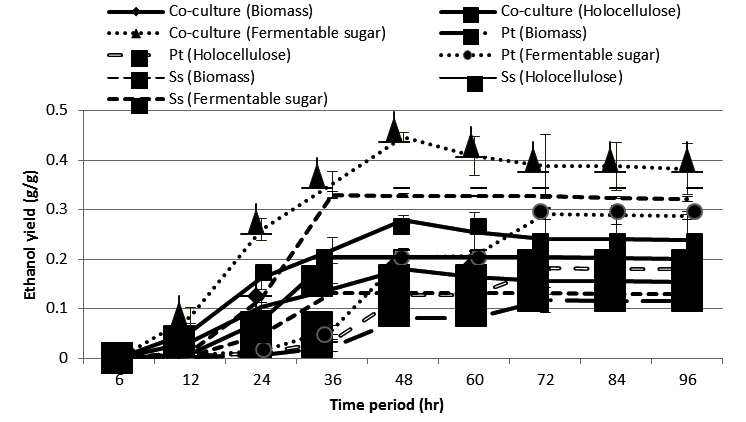 Fig. 3b. Ethanol yield (g/L) using monoculture of S. cerevisiae and P. tannophilus each and with co culture of both
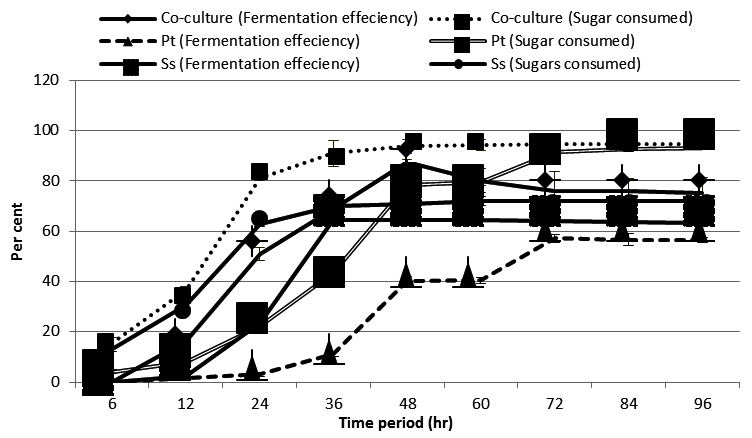 Fig. 3c. Sugar consumption and fermentation efficiency (%) using monoculture of S.cerevisiae and P.tannophilus each and with co culture of both
Fermentation studies
Effect of temperature
Temperature variations are gradually influence on ethanol production by affecting cell metabolism. During first stage of parametric optimization, suitable temperature condition was evaluated by producing ethanol at various temperature conditions, ranging from 20oC to 40oC by keeping all parameters constant including pH 5.5, agitation rate 100 rpm for first 18 h and 10% inoculum level. The results obtained (Table 1a) shows that ethanol concentration was increased with increase in temperature from 20oC (3.12 g/L) to 30oC (4.23 g/L) and thereafter gradually decreased at 35oC (4.14 g/L) and 40oC (3.42 g/L). Simultaneously sugar consumption was also increased up to 30oC with an average of 91 % sugar utilization were noticed, however above 35oC, no significant change was observed. This might be due to destroying of enzymatic reaction at higher temperature which indicates the mesophylic nature of cells. From the results obtained it can be inferred that, fermentation at 30oC was found to be an optimum temperature for fermentation of cotton stalk hydrolysate gives an ethanol concentration of 4.23 g/L with a yield of 0.152 g/g of biomass (native cotton stalk) corresponds to 0.237 g/g of total holocelluloses, and 0.381 g/g of fermentable sugar, available for yeast cell while fermentation efficiency and sugar consumed were recorded as of 74.64 % and 91% respectively. Any deviation of this optimum condition severely affected ethanol yield. The most probable reasons may be excessive enzyme degradation and loss of viability at high temperature and reduce activity of glycolytic / fermentative enzyme at low temperatures.30 These results are consistent with the results of Sathesh-Prabu, and Murugesan,9 who reported that Pachysolen tannophilus grew well at 26oC while 30oC showed better growth and fermentation of Saccharomyces cerevisiae.
Table (1a):
Effect of temperature variations on ethanol fermentation by co-culture of Saccharomyces cerevisiae and Pachysolen tannophilus.
| Temperature (oC) | Ethanol conc. (g/L) | Ethanol yield (g/g) | Fermentation efficiency (%) | Sugar consumed (%) | ||
|---|---|---|---|---|---|---|
| Biomass | Holocellulose | Fermentable Sugar | ||||
| 20 | 3.12 | 0.112 | 0.175 | 0.281 | 55.06 | 62.64 |
| 25 | 3.49 | 0.142 | 0.221 | 0.354 | 69.52 | 85.36 |
| 30 | 4.23 | 0.152 | 0.237 | 0.381 | 74.64 | 91.00 |
| 35 | 4.14 | 0.149 | 0.232 | 0.373 | 73.06 | 90.09 |
| 40 | 3.42 | 0.123 | 0.192 | 0.308 | 60.35 | 86.27 |
| SEM + | 0.11 | 0.007 | 0.008 | 0.025 | 03.96 | 03.00 |
| CD at 5% | 0.35 | 0.023 | 0.024 | 0.081 | 11.29 | 09.45 |
Effect of pH
Yeast has an ability to maintain a relative stable pH, which in turn leads to inactivation of toxic compound in the hydrolysate.31 Therefore in the present study ethanol production, yield and fermentation efficiency was calculated at various pH ranging from 4 to 6.5 at optimized temperature of 30oC. The results obtained shows that, as pH increased both sugar utilization and ethanol productivity also increases and was detected from pH 4.0 (1.16 g/L), gives 0.042 g/g of biomass, 0.065 g/g of holocelluloses and 0.104 g/g of fermentable sugar yield which corresponds to 20.47% fermentation efficiency and continued to increase up to pH 5.5 and then gradually dropped till pH 6.5 (Table 1b). From the results obtained it was observed that pH 5.5 was found to be an optimum pH for both growth of yeasts and fermentation of cotton stalk hydrolysate, which shows maximum ethanol concentration of 4.47 g/L, with a yield of 0.161 g/g of biomass (native cotton stalk), 0.250 g/g of holocelluloses and 0.402 g/g of fermentable sugar by consuming 91.45 % of total available sugar with a fermentation efficiency of 78.88 %. These findings were also an agreement with Chandel et al.19 during bioconversion of De-Oiled Rice Bran by Pichia stipites who reported maximum ethanol yield (0.44 g/g) at pH 5.5 at 30oC; and Sathesh-Prabu, and Murugesan,9 who reported that pH 6 and 5.5 were found to be optimum pH for Pachysolen tannophilus and Saccharomyces cerevisiae respectively.
Table (1b):
Effect of pH variations on ethanol fermentation by co-culture of Saccharomyces cerevisiae and Pachysolen tannophilus.
| pH | Ethanol conc. (g/L) | Ethanol yield (g/g) | Fermentation efficiency (%) | Sugar consumed (%) | ||
|---|---|---|---|---|---|---|
| Biomass | Holocellulose | Fermentable Sugar | ||||
| 4 | 1.16 | 0.042 | 0.065 | 0.104 | 20.47 | 29.91 |
| 4.5 | 2.08 | 0.075 | 0.116 | 0.187 | 36.71 | 61.63 |
| 5.0 | 3.87 | 0.139 | 0.217 | 0.348 | 68.29 | 82.00 |
| 5.5 | 4.47 | 0.161 | 0.250 | 0.402 | 78.88 | 91.45 |
| 6.0 | 4.31 | 0.155 | 0.241 | 0.387 | 76.06 | 92.36 |
| 6.5 | 4.19 | 0.151 | 0.235 | 0.377 | 73.94 | 93.37 |
| SEM + | 0.27 | 0.015 | 0.015 | 0.027 | 05.38 | 01.42 |
| CD at 5% | 0.84 | 0.049 | 0.048 | 0.086 | 11.69 | 04.47 |
Effect of aeration
The growth of Saccharomyces cerevisiae and other yeasts require certain supply of elemental oxygen in order to synthesize unsaturated fatty acid (glycerol) and sterols, which are important constituents of its cell envelop. However if oxygen is provided too much, ethanol yield would decrease sharply because of aerobic respiration by consuming more glucose to produce CO2 and H2O.32 Therefore, as reported by Chandel et al.,19 different modes of aeration conditions were applied, include highly aerobic, aerobic, semi aerobic, semi anaerobic and anaerobic conditions. The results obtained are presented in Table 1c, shows that in highly aerobic flask, where media was comparatively minimum, respiratory activity was maximum with more than 95 % sugars were consumed while in contrast low concentration of ethanol was detected i.e. 1.80 g/L, corresponding to yield of 0.065 g/g of biomass, 0.101 g/g of holocellulose and 0.162 g/g of fermentable sugar. As the medium increases (aerobicity decreases) ethanol yield and cell growth were increased and maximum fermentation activity was observed in semi aerobic flask producing 4.77 g/L of ethanol, corresponding to yield of 0.172 g/g, 0.267 g/g and 0.429 g/g of native cotton stalk, holocellulose and available sugar for fermentation respectively with 84.17% of fermentation efficiency and 91.45% of sugar was consumed. While in an anaerobic flask respiratory activity and metabolite production both were decreased. In case of aeration, our findings were also supported by Gaber,33 reported significance increase in ethanol fermentation up to 16 % from 35 % sucrose by supplying small amount of air (150 dm3 min-1m3 of reactor volume). Moreover, Converti et al.,34 reported that though Pachysolen tannophilus which is having strong affinity towards xylitol production in micro aerophilic condition, this semi aerobic mode also favoring ethanol fermentation due to submerged fermenting and surface fermenting nature of Pachysolen tannophilus and Saccharomyces cerevisiae, respectively.
Table (1c):
Effect of different mode of aeration on ethanol fermentation.
| Mode of aeration | Vol in ml | Ethanol conc. (g/L) | Ethanol yield (g/g) | Fermentation efficiency (%) | Sugar consumed (%) | ||
|---|---|---|---|---|---|---|---|
| Biomass | Holocelluloses | Fermentable sugar | |||||
| Highly aerobic | 50 | 1.80 | 0.065 | 0.101 | 0.162 | 31.76 | 95.26 |
| Aerobic | 100 | 3.19 | 0.115 | 0.179 | 0.287 | 56.29 | 94.28 |
| Semi-aerobic | 150 | 4.77 | 0.172 | 0.267 | 0.429 | 84.17 | 91.45 |
| Semi-anaerobic | 200 | 4.31 | 0.155 | 0.241 | 0.387 | 76.06 | 81.55 |
| Anaerobic | 250 | 3.42 | 0.123 | 0.192 | 0.307 | 60.35 | 64.02 |
| SEM+ | 0.22 | 0.011 | 0.015 | 0.027 | 05.05 | 00.71 | |
| CD at 5% | 0.70 | 0.034 | 0.048 | 0.090 | 16.45 | 02.24 | |
Size of inoculum
An inoculum concentration does not influence the final amount of bioethanol production. However, it affects the duration of fermentation process. If the cell concentration is below certain critical value, pronounced lag phases and massive cell death will occur. In this regard various levels of co culture inoculum has been exposed which ranged from 6% (v/v) to 16 % (v/v) and results were shown in Table 1d. Inoculum levels were prepared by using fixed ratio of both cultures including 60% Saccharomyces cerevisiae and 40% Pachysolen tannophilus for co-culture fermentation. The amount of sugar consumed and ethanol produced increased linearly with increase in initial concentration from 6% to 12% (v/v) of inoculum and no significant change was observed thereafter. Maximum yield and concentration of ethanol was recorded at 12 % inoculum concentration which gives an ethanol concentration of 4.72 g/L corresponds to a yield of 0.170 g/g of biomass (native cotton stalk), 0.264 g/g of holocelluloses present in cotton stalk and 0.425 g/g of fermentable sugar, showing fermentation and sugar consumption efficiencies of 83.29% and 92.90% respectively. Interestingly, this concentration is statistically at par with 10% inoculum level, yielded ethanol of 0.168 g/g of biomass, 0.262 g/g of holocelluloses and 0.421 g/g of fermentable sugar, which reflecting 82.59 % fermentation efficiency and 92.36% of total sugar was consumed. Therefore, on the tune of statistical significance, the optimum inoculum concentration for ethanol production from cotton stalk hydrolysate was decided as 10 % (v/v). These findings were supported by Sharma et al.8 showed 10% of co culture inoculum with 6% Saccharomyces cerevisiae (v/v) and 4% Pachysolen tannophilus (v/v) producing maximum ethanol yield of 0.394 g/g.
Table (1d):
Effect of various inoculum levels on ethanol fermentation by co-culture of Saccharomyces cerevisiae and Pachysolen tannophilus.
| Inoculum conc. (%) | Ethanol conc. (g/L) | Ethanol yield (g/g) | Fermentation efficiency (%) | Sugar consumed (%) | ||
|---|---|---|---|---|---|---|
| Biomass | Holocelluloses | Fermentable Sugar | ||||
| 6 | 3.56 | 0.128 | 0.199 | 0.320 | 62.82 | 81.55 |
| 8 | 4.09 | 0.147 | 0.229 | 0.368 | 72.17 | 90.54 |
| 10 | 4.68 | 0.168 | 0.262 | 0.421 | 82.59 | 92.36 |
| 12 | 4.72 | 0.170 | 0.264 | 0.425 | 83.29 | 92.90 |
| 14 | 4.71 | 0.170 | 0.264 | 0.423 | 83.12 | 93.35 |
| 16 | 4.65 | 0.167 | 0.260 | 0.418 | 82.06 | 93.32 |
| SEM + | 0.13 | 0.007 | 0.011 | 0.024 | 02.37 | 01.21 |
| CD at 5% | 0.42 | 0.022 | 0.034 | 0.074 | 07.45 | 03.80 |
Effect of agitation
Agitation is the most significant factor to improve ethanol concentration and yield. It was reported that compared to static culture, agitation led to 69% increase in ethanol titer.32 Therefore, in the present study different stirring rates (agitation) were checked, ranging from 60 rpm to 160 rpm separately for first 18 h and then kept in static mode for 48 h. The results obtained (Table 1e) shows that, regular increase in ethanol production with increase in agitation from 60 rpm to 120 rpm observed and there after it decreased. The maximum ethanol production was found to be 4.92 g/L at 120 rpm, yielding ethanol of 0.177 g/g of biomass, 0.275 g/g of holocellulose and 0.443 g/g of fermentable sugar with fermentation efficiency and sugar consumption of 86.82% and 92.42% respectively. Agitation for sufficient time is also the most important factor of fermentation process, therefore second setup of agitation was run by stirring for different time period ranging from zero hour to 48h separately with fixed stirring rate speed of 120 rpm. The highest ethanol concentration and fermentation efficiency recorded with 24 h of agitation i.e. 4.93 g/L and 87% respectively, with ethanol yields of 0.177 g/g of biomass, 0.276 g/g of holocellulose and 0.444 g/g of fermentable sugar (Table 1f). The present investigation reported that compared to static mode (counted as zero hour of agitation), optimized agitation led to 43 % increase in fermentation efficiency. As the agitation time increased above mentioned level, ethanol concentration was decreased without significantly affecting the sugar consuming level i.e. 93.81%. These findings elaborated that, 24 h agitation time was suitable for maximum ethanol production. Appropriate amount of dissolved oxygen made yeast physiologically healthy and became productive; however, excess oxygen in the fermentation medium could lead to increase cell growth at the cost of ethanol productivity as was noticed by Lin et al.35 Therefore excess agitation time could not significantly affect for improvement of ethanol concentration.
Table (1e):
Effect of agitation rate on ethanol fermentation of cotton stalk hydrolysate by co-culture of Saccharomyces cerevisiae and Pachysolen tannophilus.
| Agitation rate (rpm) | Ethanol conc. (g/L) | Ethanol yield (g/g) | Fermentation efficiency (%) | Sugar consumed (%) | ||
|---|---|---|---|---|---|---|
| Biomass | Holocelluloses | Fermentable sugar | ||||
| 60 | 3.81 | 0.137 | 0.213 | 0.343 | 67.24 | 64.45 |
| 80 | 4.28 | 0.154 | 0.240 | 0.385 | 75.52 | 81.53 |
| 100 | 4.64 | 0.167 | 0.260 | 0.417 | 81.88 | 90.06 |
| 120 | 4.92 | 0.177 | 0.275 | 0.443 | 86.82 | 92.42 |
| 140 | 4.77 | 0.172 | 0.267 | 0.429 | 84.18 | 92.90 |
| 160 | 4.72 | 0.170 | 0.264 | 0.424 | 83.29 | 93.84 |
| SEM+ | 0.12 | 0.005 | 0.009 | 0.017 | 02.34 | 01.64 |
| CD at 5% | 0.38 | 0.014 | 0.027 | 0.054 | 07.37 | 05.16 |
Table (1f):
Effect of agitation time on ethanol fermentation of cotton stalk hydrolysate by co-culture of Saccharomyces cerevisiae and Pachysolen tannophilus.
| Agitation time (h) | Ethanol conc. (g/L) | Ethanol yield (g/g) | Fermentation efficiency (%) | Sugar consumed (%) | ||
|---|---|---|---|---|---|---|
| Biomass | Holocelluloses | Fermentable sugar | ||||
| 0 | 2.54 | 0.091 | 0.142 | 0.228 | 44.82 | 47.92 |
| 12 | 3.72 | 0.134 | 0.208 | 0.335 | 65.64 | 72.54 |
| 24 | 4.93 | 0.177 | 0.276 | 0.444 | 87.00 | 93.81 |
| 36 | 4.70 | 0.169 | 0.263 | 0.423 | 82.94 | 94.36 |
| 48 | 4.00 | 0.144 | 0.224 | 0.360 | 70.59 | 93.80 |
| SEM+ | 0.22 | 0.008 | 0.010 | 0.023 | 03.17 | 01.53 |
| CD at 5% | 0.68 | 0.025 | 0.032 | 0.077 | 10.34 | 04.83 |
Fermentation time
The optimum time period for maximum ethanol production was evaluated by applying the information generated during parametric optimization of batch fermentation. During time optimization separate flask was used for each time period of fermentation, so as to maintain an ideal environmental condition during fermentation process. The results obtained indicated that, during first 6 h of inoculum addition no ethanol production could be detected while it commenced from 12 h onwards and steadily increased up to 48 h. Simultaneously cell mass concentration was increased continuously up to 96 h of fermentation (8.11 g/L) but no significant change was observed after 36 h (Table 1g). About 94% of available sugar was consumed in 48 h and resulted in 4.96 g/L of ethanol production was recorded with a fermentation efficiency of 87.52%. The ethanol yield was recorded as 0.179 g/g of biomass, 0.278 g/g of holocellulose and 0.446 g/g of fermentable sugar. Our results are in similar lines to the work of Qian et al.36 who reported that fermentation of detoxified hydrolysate of softwood by adapted co-culture of Saccharomyces cerevisiae and Pachysolen tannophilus generated an exceptionally high ethanol yield on total sugar of 0.49 g/g, corresponds to 96.1% of the maximal theoretical value after 48 h of incubation.
Table (1g):
Effect of time period on ethanol fermentation by co-culture of Saccharomyces cerevisiae and Pachysolen tannophilus.
| Time period (h) | Ethanol conc. (g/L) | Ethanol yield (g/g) | Fermentation efficiency (%) | Sugar consumed (%) | Cell mass conc. (g/L) | ||
|---|---|---|---|---|---|---|---|
| Biomass | Holocellulose | Fermentable sugar | |||||
| 06 | 00 | 000 | 000 | 000 | 00 | 15.72 | 1.49 |
| 12 | 0.92 | 0.033 | 0.052 | 0.083 | 16.24 | 36.55 | 3.62 |
| 24 | 2.88 | 0.104 | 0.161 | 0.259 | 50.82 | 81.09 | 7.59 |
| 36 | 3.90 | 0.140 | 0.218 | 0.351 | 68.82 | 91.01 | 7.71 |
| 48 | 4.96 | 0.179 | 0.278 | 0.446 | 87.52 | 93.84 | 8.06 |
| 60 | 4.54 | 0.163 | 0.254 | 0.409 | 80.12 | 94.32 | 8.08 |
| 72 | 4.31 | 0.155 | 0.241 | 0.387 | 76.06 | 94.79 | 8.08 |
| 84 | 4.30 | 0.155 | 0.241 | 0.387 | 75.88 | 94.80 | 8.09 |
| 96 | 4.25 | 0.153 | 0.238 | 0.382 | 75.00 | 94.84 | 8.11 |
| SEM+ | 0.23 | 0.008 | 0.013 | 0.020 | 04.04 | 01.56 | 0.68 |
| CD at 5% | 0.70 | 0.025 | 0.039 | 0.062 | 11.21 | 04.64 | 2.04 |
Comparison of ethanol production by monoculture and co culture fermentation
The feasibility of ethanol production from monocultures and co-culture fermentation was studied, to evaluate the efficiency of each culture i.e. Saccharomyces cerevisiae and Pachysolen tannophilus separately and combination of both. All these experiments were conducted using pre optimized parameter. From the results obtained it was observed that maximum ethanol production from cotton stalk hydrolysate by monoculture of Saccharomyces cerevisiae was 3.66 g/L after 36 h of incubation with the yield of 0.132 g/g of biomass, 0.205 g/g of holocellulose and 0.329 g/g of fermentable sugar and got constant thereafter while slight fall in concentration was noted with increase in fermentation time beyond 48 h (Table 2a). Simultaneously cell mass concentration was also increased up to 36 h of incubation (7.92 g/L) and thereafter no significant change was observed with 70.22% sugar utilization. However, fermentation efficiency was low i.e. 64.59%, which might be due to most of pentose sugar (xylose) left unfermented by Saccharomyces cerevisiae as cotton stalk hydrolysate contains both xylose and glucose.
Table (2a):
Ethanol fermentation from cotton stalk hydrolysate by mono-culture of Saccharomyces cerevisiae.
| Time period (h) | Ethanol conc. (g/L) | Ethanol yield (g/g) | Fermentation efficiency (%) | Sugar consumed (%) | Cell mass conc. (g/L) | ||
|---|---|---|---|---|---|---|---|
| Biomass | Holocelluloses | Fermentable sugar | |||||
| 6 | 00 | 000 | 000 | 000 | 00 | 13.10 | 1.73 |
| 12 | 0.14 | 0.005 | 0.008 | 0.013 | 2.47 | 30.78 | 3.80 |
| 24 | 1.32 | 0.047 | 0.074 | 0.119 | 23.29 | 62.81 | 6.44 |
| 36 | 3.66 | 0.132 | 0.205 | 0.329 | 64.59 | 70.22 | 7.92 |
| 48 | 3.65 | 0.131 | 0.204 | 0.328 | 64.41 | 70.93 | 7.96 |
| 60 | 3.65 | 0.131 | 0.204 | 0.328 | 64.41 | 71.88 | 8.07 |
| 72 | 3.64 | 0.131 | 0.204 | 0.327 | 64.23 | 72.03 | 8.16 |
| 84 | 3.60 | 0.130 | 0.202 | 0.324 | 63.52 | 72.08 | 8.19 |
| 96 | 3.58 | 0.129 | 0.200 | 0.322 | 63.17 | 72.11 | 8.24 |
| SEM+ | 0.027 | 0.001 | 0.0015 | 0.002 | 00.47 | 00.83 | 0.58 |
| CD at 5% | 0.081 | 0.003 | 0.0045 | 0.007 | 01.42 | 02.46 | 1.73 |
During second set of experiment with Pachysolen tannophilus as a monoculture, the first significant upliftment in ethanol concentration was observed at 48 h of incubation i.e. 2.28 g/L with a yield of 0.082 g/g of biomass (0.128 g/g of holocelluloses and 0.205 g/g of fermentable sugar) and after that a diauxy was observed in between 48 to 72 h of incubation and at 72 h, and then sudden increase in ethanol concentration was noted i.e. 3.24 g/L, corresponds to a yield and fermentation efficiency of 0.117 g/g of biomass, 0.182 g/g of holocelluloses, 0.291 g/g of fermentable sugars and 57.17% respectively and then slightly declined (Table 2b). Simultaneously cell mass concentration was also increased up to 72 h of incubation (7.87 g/L) and thereafter no significant change was observed with more than 91% sugar unitization were noted. As can be seen that the substrate consumption rate was quite high and can ferment both xylose and glucose in contrast with S. cerevisiae, concentration of ethanol was not significantly increases which might be due to simultaneous production of xylitol. This is because of semi aerobic nature of fermentation, which provides the microaerophilic environment to cell, as was also observed by Converti et al.34 The similar trends in term of ethanol yield and fermentation efficiency of Saccharomyces cerevisiae and Pachysolen tannophilus was also observed by Sathesh-Prabu, and Murugesan,9 reported 0.28g and 0.34g per gram of fermentable sugar with fermentation efficiency of 55.78% and 67.73% respectively.
Table (2b):
Ethanol fermentation from cotton stalk hydrolysate by mono-culture of Pachysolen tannophilus .
| Time period (h) | Ethanol conc. (g/L) | Ethanol yield (g/g) | Fermentation efficiency (%) | Sugar consumed (%) | Cell mass conc. (g/L) | ||
|---|---|---|---|---|---|---|---|
| Biomass | Holocellulose | Fermentable sugar | |||||
| 6 | 00 | 000 | 000 | 000 | 00 | 4.17 | 1.15 |
| 12 | 0.08 | 0.0029 | 0.0045 | 0.007 | 1.41 | 7.93 | 1.90 |
| 24 | 0.17 | 0.0061 | 0.0095 | 0.015 | 3.00 | 22.48 | 3.74 |
| 36 | 0.63 | 0.023 | 0.035 | 0.056 | 11.11 | 43.29 | 5.61 |
| 48 | 2.28 | 0.082 | 0.128 | 0.205 | 40.24 | 78.22 | 5.84 |
| 60 | 2.29 | 0.082 | 0.128 | 0.206 | 40.41 | 79.60 | 7.41 |
| 72 | 3.24 | 0.117 | 0.182 | 0.291 | 57.17 | 91.32 | 7.87 |
| 84 | 3.21 | 0.116 | 0.179 | 0.289 | 56.64 | 92.88 | 7.93 |
| 96 | 3.20 | 0.115 | 0.179 | 0.288 | 56.47 | 93.09 | 7.94 |
| SEM+ | 0.072 | 0.0026 | 0.004 | 0.004 | 00.93 | 0.530 | 0.29 |
| CD at 5% | 0.214 | 0.0077 | 0.012 | 0.014 | 02.81 | 1.574 | 0.89 |
On the other hand batch fermentation of ethanol using co-culture of Saccharomyces cerevisiae and Pachysolen tannophilus produced maximum ethanol of 4.96 g/L at 48 h of incubation corresponding to ethanol yield of 0.446 g/g of fermentable sugar (0.179 g/g of native cotton stalk) with fermentation efficiency of 87.52% which is comparatively higher than mono culture fermentation (Table 3). The obtained findings elaborated that in co-culture fermentation, sequential consumption of two main sugars occurs and during process once glucose is consumed, no lag phase is detected and substrate uptake continue by using the rest of sugars, as was also observed by Romero et al.28
Table (3):
Comparative accounts of mono-culture and co-culture fermentation.
| Comparative account | Monoculture | Co-culture | |
|---|---|---|---|
| S. cerevisiae | P. tannophilus | ||
| Initial sugar concentration (g/L) | 11.00 | 11.00 | 11.00 |
| Ethanol conc. (g/L) | 3.66 | 3.24 | 4.96 |
| Ethanol yield (g/g of biomass) | 0.132 | 0.117 | 0.179 |
| Ethanol yield (g/g of holocellulose) | 0.205 | 0.182 | 0.278 |
| Ethanol yield (g/g of fermentable sugar) | 0.329 | 0.291 | 0.446 |
| Fermentation efficiency (%) | 64.59 | 57.17 | 87.52 |
| Sugar consumed (%) | 70.22 | 91.32 | 93.84 |
| Cell mass concentration (g/L) | 7.92 | 07.87 | 8.06 |
Attempts have been made to optimize bioprocess parameters of cotton stalk hydrolysate using co-culture of Saccharomyces cerevisiae and Pachysolen tannophilus. The maximum ethanol production was recorded as 4.96 g/L with fermentation efficiency of 87.52%. The yield was recorded as 0.179 g/g of biomass, 0.278 g/g of holocelluloses and 0.446 g/g of sugar available for fermentation. Thus study proves that cotton stalk serve as potential, renewable and low cost feedstock for ethanol production at batch level. However, the continuity of this work is necessary for development of ethanol production at commercial level.
ACKNOWLEDGMENTS
The author’s great fully acknowledge, Director, Government Institute of Science, Aurangabad for their financial assistance.
- Hahn-Hagerdal, B., Galbe, M., Gorwa-Grauslund, M.F., Liden, G., Zacchi, G. Bioethanol- the fuel of tomorrow from the residues of today. Trends. Biotechnol., 2006; 24(12): 549-56.
- Dien, B.S., Iten, L.B., Bothast, R.J. Conversion of corn fiber to ethanol by recombinant E.coli strain FBR3. J. Ind. Microbiol., 1999; 22: 575-581.
- USDA. United State Department of Agriculture, World Agricultural Supply and Demand Estimate, October 9, 2015.
- Kaur, U., Oberoi, H.S., Bhargav, V.K., Sharma-Shivappa, R.R., Dhaliwal, S.S. Ethanol production from alkali and ozone treated cotton stalk using thermo tolerant Pichia kudriavzevii HOP-1. Ind. Crop. Prod., 2012; 37: 219-226.
- Liao, W., Liu, Y., Liu, C., Wen, Z., Chen, S. Acid hydrolysis of fiber from dairy manure. Bioresour. Technol., 2006; 97: 1687-1695.
- Martinez, A., Rodriguez, M.E., York, S.W., Preston, J.E., Ingram, L.O. Effect of Ca(OH)2 treatments (“overliming”) on the composition and toxicity and bagasse of hemicellulose hydrolysate. Biotechnol. Bioeng., 2000; 69: 526-536.
- Chandel, A.K., Kapoor, R.K., Singh, A., Kuhad, R.C. Detoxification of sugarcane bagasse hydrolyzate improves ethanol production by Candida shehatae NCIM 3501. Bioresour. Technol, 2007; 98: 1947-1950.
- Sharma, N., Kalra, K.L., Oberoi, H.S., Bansal, S. Optimization of fermentation parameters for production of ethanol from kinnow wastes and banana peels by simultaneous saccharification and fermentation. Ind. J. Microbiol., 2007; 47: 310-316.
- Sathesh-Prabu, C., Murugesan, A.G. Potential utilization of sorghum field waste for fuel ethanol production employing Pachysolen tannophilus and Saccharomyces cerevisiae. Bioresour. Technol., 2011; 102: 2788-2792.
- Laopaiboon, L., Nuanpeng, S., Srinophakun, P., Klanrit, P., Laopaiboon, P. Ethanol production from sweet sorghum juice using very high gravity technology: Effects of carbon and nitrogen supplementations. Bioresour. Technol., 2009; 100: 417-4182.
- Slininger, P.J., Bolen, P.L., Kurtzman, C.P. Pachysolen tannophilus: properties and process consideration for ethanol production from D-xylose. Enzyme. Microb. Technol., 1987; 9: 5-15.
- Lee, H. Reversible inactivation of D-xylose utilization by D-glucose in the pentose fermenting yeast Pachysolen tannophilus. FEMS Micrbiol Lett., 1992; 92: 1-4.
- Chandel, A.K., Chandrashekhar, G., Radhika, K., Ravinder, R., Ravindra, P. Bioconversion of pentose sugars into ethanol: A review and future directions. Biotechnol. Mol. Biol. Rev., 2011; 6(1): 008-020.
- Teramoto, Y., Lee, S-H, Endo, T. Pretreatment of woody and herbaceous biomass for enzymatic saccharification using sulfuric acid-free ethanol cooking. Bioresour. Technol., 2008; 99: 8856-8863.
- Baig, M.Z. Studies on production of bioethanol from cotton stalk (Ph.D. thesis), Dr. Babasaheb Ambedkar Marathwada University, Aurangabad, India, 2014.
- Baig, M.Z., Dharmadhikari, S.M. Optimization of detoxification with over liming and charcoal treatment for increasing the fermentability of cotton stalk hydrolysate. Ind. J. of Appl. Res., 2014; 4(07): 08-10.
- SrilekhaYadav, K., Naseeruddin, S., Prashanthi, G.S., Sateesh, S., Rao, L.V. Bioethanol fermentation of concentrated rice straw hydrolyzate using co-culture of Saccharomyces cerevisiae and Pichia stipites. Bioresour. Technol., 2011; 102(11): 6473-6478.
- Pasha, C., Kuhad, R.C., Rao, L.V. Strain improvement of thermo tolerant Saccharomyces cerevisiae VS3 strain for better utilization of lignocellulosic substrates. J Appl Micro biol., 2007; 103: 1480-1489.
- Chandel, A.K., Narasu, A.K., Rudravaram, R., Pogaku, R., Rao, L.V. Bioconversion of De-Oiled Rice Bran (DORB) hemi cellulosic hydrolysate into ethanol by Pichia stipites NCM3499 under optimized condition. Int J food Eng., 2009, 5(1): 1-12.
- Oberoi, H.S., Vadlani, P.V., Madl, R.L., Saida, L. Abeykoon. J.P. Ethanol production from orange peels: two-stage hydrolysis and fermentation studies using optimized parameters through experimental design. J. Agric. Food. Chem., 2010; 58: 3422-3429.
- Miller, G.L. Use of dinitrosalicylic acid reagent for determination of reducing sugars. Anal chem., 1959; 31: 426-428.
- Bregmeyer, H.U., Gawehn, K., Grassl, M. Methods of enzymatic analysis (Bregmeyer, H.U., ed) academic press Inc., New York, Volume one, second edition, 1974; 457-458.
- Singleton, V.L., Rossi, J.A. Colorimetric of total phenolics with phosphomolybdic-phosphotungstic acid reagents. Am. J. Enol. Viticult., 1965; 16: 144-158.
- Agblevor, F.A., Batz, S., Trumbo, J. Composition and ethanol production potential of cotton gin residues. Appl. Biochem. Biotechnol., 2003; 105: 219-230.
- Silverstein, R.A., Chen, Y., Sharma-Shivappa, R.R., Boyette, M.D., Osborn, J.A. A comparison of chemical pre-treatment methods for improving saccharification of cotton stalks. Bioresour. Technol., 2007; 98: 3000-3011.
- Binod, P., kuttiraja, M., Archana, M., Janu, K.U., Sindhu, R., Sukumaran, R.K., Pandey, A. High temperature pre-treatment and hydrolysis of cotton stalk for producing sugars for bioethanol production. Fuel., 2012; 92: 340-345.
- Harkins, J.M., Rowe, J.W. Bark and its possible uses. USDA For Serv Res. Note FPL-091, For Prod Lab., Madison, Wis, 1971.
- Romero, I., Sanchez, S., Moya, M., Cstro, E., Ruiz, E., Bravo, V. Fermentation of olive tree pruning acid-hydrolyzates by Pachysolen tannophilus. Biochem. Eng. J., 2007; 36: 108-115.
- Miyafuji, H., Danner, H., Neureiter, M., Thomasser, C., Bvochora, J., Szolar, O., Braun, R. Detoxification of wood hydrolyzates with charcoal for increasing the fermentability of hydrolyzates. Enz. Microb. Technol., 2003; 32: 396-400.
- Bajaj, B.K., Yousuf, S., Thakur, R.L. Selection and characterization of yeasts for desirable fermentation characteristics. Ind. J. Microbiol., 2001; 41: 107-110.
- Yu, Z., Zhang, H. Ethanol fermentation of acid-hydrolysed cellulosic pyro lysate with Saccharomyces cerevisiae. Bioresour. Technol., 2004; 93: 199-204.
- Liu, Y., Qi, T., Shen, N., Gan, M., Jin, Y., Zhao, H. Improvement of ethanol concentration and yield by initial aeration and agitation culture in very high gravity fermentation. Chin. J. Appl. Environ. Biol., 2009; 15(4): 563-567.
- Gaber, Z.B. Production of 16% ethanol from 35% sucrose. Biomass Bioenerg., 2010; 34(8): 1243-1249.
- Converti, A., Perego, P., Dominguez, J.M., Silva, S.S. Effect of temperature on the microaerophilic metabolism of Pachysolen tannophilus. Enz. Micro. Technol., 2001; 28: 339-345.
- Lin, Y.H., Chien, W.S., Duan, K.J., Chang, P.R. Effect of aeration timing and interval during very-high-gravity ethanol fermentation. Process. Biochem., 2011; 46: 1025-1028.
- Qian, M., Tian, S., Li, X., Zhang, J., Pan, Y., Yang, X. Ethanol production from dilute-acid softwood hydrolyzate by co-culture. Appl. Biochem. biotechnol., 2006; 134: 273-283.
© The Author(s) 2016. Open Access. This article is distributed under the terms of the Creative Commons Attribution 4.0 International License which permits unrestricted use, sharing, distribution, and reproduction in any medium, provided you give appropriate credit to the original author(s) and the source, provide a link to the Creative Commons license, and indicate if changes were made.