


ISSN: 0973-7510
E-ISSN: 2581-690X
The global pandemic of COVID-19 has raised several questions and attracted researchers from all of the disciplines of scientific research. Regardless of advances in science and technology, equipped laboratories of virology, high literacy rates, and medical resources in developed countries, several nations and their health care systems completely failed to overcome the disaster. The fast spread is caused by frequent air travel for business, tourism, education, etc. COVID-19 can infect third world countries severely. United States of America has the highest per capita spending of health still 1/3rd of the global burden of COVID-19 has consumed existing resources. The WHO has declared COVID-19 as a pandemic. More than 200 countries and territories have reported infected cases. The quarantine is the most effective way to slow the spread of disease and “Flatting of Curve” is a phenomenon to tackle the surge by health systems. To achieve good results from existing Medical Health Care Systems (MHCS), an accurate prediction for the spread of disease is crucial. This study utilizes the generalized method of SIR to accurately predict the spread of COVID-19 associated infection, recoveries, and deaths in Pakistan. The data from the National Command and Control of Pakistan (NCCP) is utilized. Through multiple cases applied on currently available data, the proposed mathematical models predict that by the end of April about more than 14553 infected and about 310 deaths are in Pakistan. The recovery rate is highest in the region up to 99.87 %.
COVID-19, Prediction, Mathematical models, Preventive measures, Recovery
In 1968, morphology observation of coronaviruses under an electron microscope was made1. Coronaviruses are a large group of viruses that may cause damage to living organisms. In humans, a few coronaviruses are known to cause respiratory infection and the common cold. The main outbreaks like severe acute respiratory syndrome (SARS), Middle East Respiratory Syndrome (MERS), and Coronavirus diseases on 08 December 2019 occurred worldwide2. Their symptoms are pneumonia-like. The disease outbreak in Wuhan City of Hubei Province in China is termed scientifically COVID-193. The symptoms of COVID-19 include dry cough, fever, muscle ache, and tiredness. Several patients of COVID-19 have aches, sore throat, nasal congestion, and diarrhea. Some patients may remain asymptomatic during infection. According to the World Health Organization (WHO), 1 out of 6 (15-16.6%) COVID-19 victims face serious illness and breathing problems. These patients require respiratory support. As per WHO following parameters are utilized to declare a contagious disease a pandemic4 :
- When diseases stain and easy to spread to human to human.
- When diseases infect human and causing severe illness.
- When new diseases spread increase to the mass population5.
In literature, various predictive mathematical models are applied to the base of currently available characteristics of diseases to predict the pattern of disease prevalence under various conditions. Governing bodies implement policies to prevent and control infection. The resources are diverted to reduce the risk of infection in the population for better future outcomes. Choi et al.6 discussed a mathematical model to predict severe acute respiratory syndrome (SARS) cases and deaths in Canada using the SIR model. The estimated infectious cases produced are about 1.5 to 2 per infection every five days and 30% of infected patients die within 14 days. Outcomes gauge the fast spread of SARS. Peng et al.7 applied and discussed a generalized mathematical model for SEIR. The model includes a new state quarantined with a recovery state, the analysis is based on public data of NHC of china from 20 January to 9 February 2020. The estimations are made for quarantine time, latent time, and basic reproductive number reliably and possible ending time of COVID-19 in four regions of mainland China namely Wuhan, Shanghai, Beijing, and Hubei. Liu et al.8 reviewed basic reproductive number for different method to find a generalized reproductive number and compared the results to find an improvised average. The impact of basic reproductive number is discussed in details and its importance in spread of diseases such as COVID-19 (R0) is estimated 2-3. It is proved that for infection is likely to increase and for, the transmission is likely to die out.
Zhao et al.9 include the impact of accounting variations in disease reporting rate and estimated intrinsic growth rate using the exponential model. The reproductive number is estimated using serial intervals for SARS and MARS disease data. The basic reproductive number of COVID-19 range according to this study rages from 2.24 to 3.58 9. Park et al.13 indicate from the previous spread of diseases SARS and MERS it’s easy to understand COVID-19. Findings indicate that COVID-19 has very high spread infection capacity than SARS and MERS. The mortality rate and morbidity are comparable to MERS /SARS. Their treatment strategies shall beneficent to COVID-19 patients since there is no vaccine and specific medicine available for COVID-19. Around 80 clinical treatment have been imitated to tackle COVID-19. Adina et al.5 applied the SIR model for analysis and prediction of swine flu virus for the year 2009 on the territory of Romania. The figurative data later published by NPHD of Romania is utilized for comparative analysis. An application is developed to enables to Romania citizen forecast and manages the pandemic situation. The model predicts and monitors the situation. The model benefits the system to improve the economic activity of Romania and reduce the potential illness of the population by swine flu.
Canto et al.10 utilized epidemic mathematical model SIR with unknown parameters. This addressed the theoretical existence of a solution using an iterative algorithm and stated an unknown parameter. The least-square approaches for the limited set to estimate the begging value parameter. By least square method descendent gradient condition is studied for parameter value no less than one. Yi-Cheng et al.11 analyses COVID-19 by the numerical and mathematical model. It is stated that the static SIR model is more adaptive than the time-dependent SIR Model. The proposed time depend method is found robust than the direct estimation method. The data of the NHC of China is compared. It is shown that prediction error per day of infected and recovered is 3%. Authors applied SIR model on two types of infected persons namely undetectable and detectable. A future outbreak of COVID-19 in China is more likely to happen.
Keeping in view the pros and cons of existing models, an improvised SIR model is proposed. Furthermore, pandemic data based on the NDMA and Government of Pakistan from 11 March to 21 April 202012 is utilized to make a future prediction. Key pandemic parameters are constantly monitored and updated in the model to gauge possible ending time for COVID-19 in Pakistan. SARS and COVID19 are genetically the same but the cause of COVID -19 is quite different. Although COVID-19 is less deathly than SARS but more infectious13. This paper utilizes a simple mathematical model to accurately predict the COVID-19 using 4 different parameters in Pakistan.
A standard SIR model block diagram is shown in Fig. 1 having the simplest structure and reasonable accuracy14. The entire population is divided into three groups. It is labeled as S, I, and R and represent susceptible, infected, and recovered respectively. The Immunity of population is initially zero since no patients are recovered. The majority of the population starting from S, go through I and then R. Since death count doesn’t add in the existing population and hence not included in the sum of the population i.e. N = S + I = R. The model relates the dynamics of SIR by simple equation.
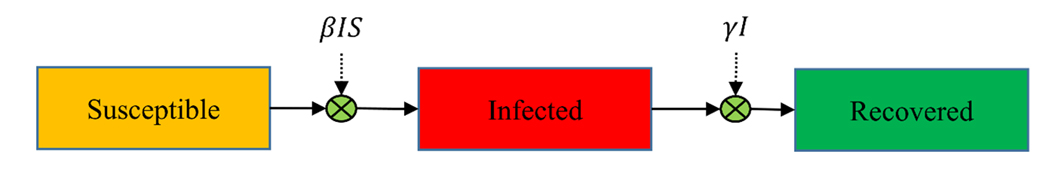
Fig. 1. The block diagram of the SIR model for epidemic and pandemic (i.e. COVID-19).
The term (± βSI/N) is the same in both equations with different signs. In the basic three terms model, it means that the rate of transition is proportional to both S and I and the second transition is only proportion to I. Because the rate of first proportional to SIS has more people who are susceptible to the diseases the more people will get infected. The reason for being proportion to I is that more people getting infected and the rest of this proportion is just a constant of proportionality. In the second transition, more people get infected means more people recover from the diseases each day. To make more sense of these mathematical relationships, the constants beta and gamma for the virus are calculated. For this purpose, data on daily cases of newly infected, recovered, and died is instilled in the SIR model. The previous day outcome is compared and the average value is used to obtain beta and gamma. Beta and gamma are sensitive parameters and their ratio is called basic reproductive number (R0). The corresponds to the expected number of new cases from a single infection. If this ratio is unity (b/g = 1), the epidemic is supposed to be in the initial exponential growth stage. Incase ratio is, the population is in the recovery phase. A small beta decrease infection and an increase in gamma increase recovery. We can decrease beta by staying at home, closing borders, observing hygiene, and developing the vaccine. The increase in gamma is triggered by better medicine and improved care of the patients. The simplest SIR models are the Kermack-McKendrick model as in15.
Model description
As shown in Fig. 1 the SIR model-based is on three states namely susceptible, infected, and recovered. The COVID-19 has confirmed human to human (H2H), organism to organism ability to spread. Since the spread is not local and only imported cases spread the disease through direct contact, we assumed that the initial contagious stage of pandemic infected a small number of people. After some time, the susceptible population can be infected.
Generalized SIR mathematical model
A generalized SIR model, also called SIRD, is an epidemiological model that calculates the theoretical number of people infected with an infectious illness in a closed population over time. The name of this class of models derives from the fact that they involve coupled equations relating to the number of susceptible people, the number of people infected, the number of people recovered, and many people dead due to COVID-19. We spread dead stage from the recovered stage because many cases have been reported one infected of COVID-19 possibilities infect again16 this way we introduced generalized model SIR model SIRD
Table (1):
Symbol description for Generalized SIR or SIRD model.
Symbol |
Description |
|---|---|
β |
Rate per infected per day |
γ |
Recoveries per person per day |
1/γ |
Days to recover |
β/γ |
Contacts per infection |
R0 |
Basic reproductive number |
2I/100 |
Number of deaths |
The rate of susceptible people is calculated for a population using Eq. (1) and the description of the parameters is provided in Table 1 as
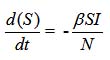
…(1)
Where S is the number of susceptible populations, β is the daily rate of infection, I is the number of confirming infections and N is the total sum of Eq. (2)
…(2)
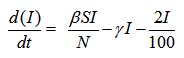
The recovery rate is calculated by Eq. (3)
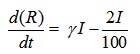
…(3)
The death rate is calculated by Eq. (4)
…(4)
The results are conducted for four values of datasets with different SIRD parameters. The summary of the results is given in Table 2 and Fig. 2(a)-(d) are utilized to visually present the data where susceptible, infected, recovered, and death are indicated by sky blue, red, orange, and green solid lines respectively.
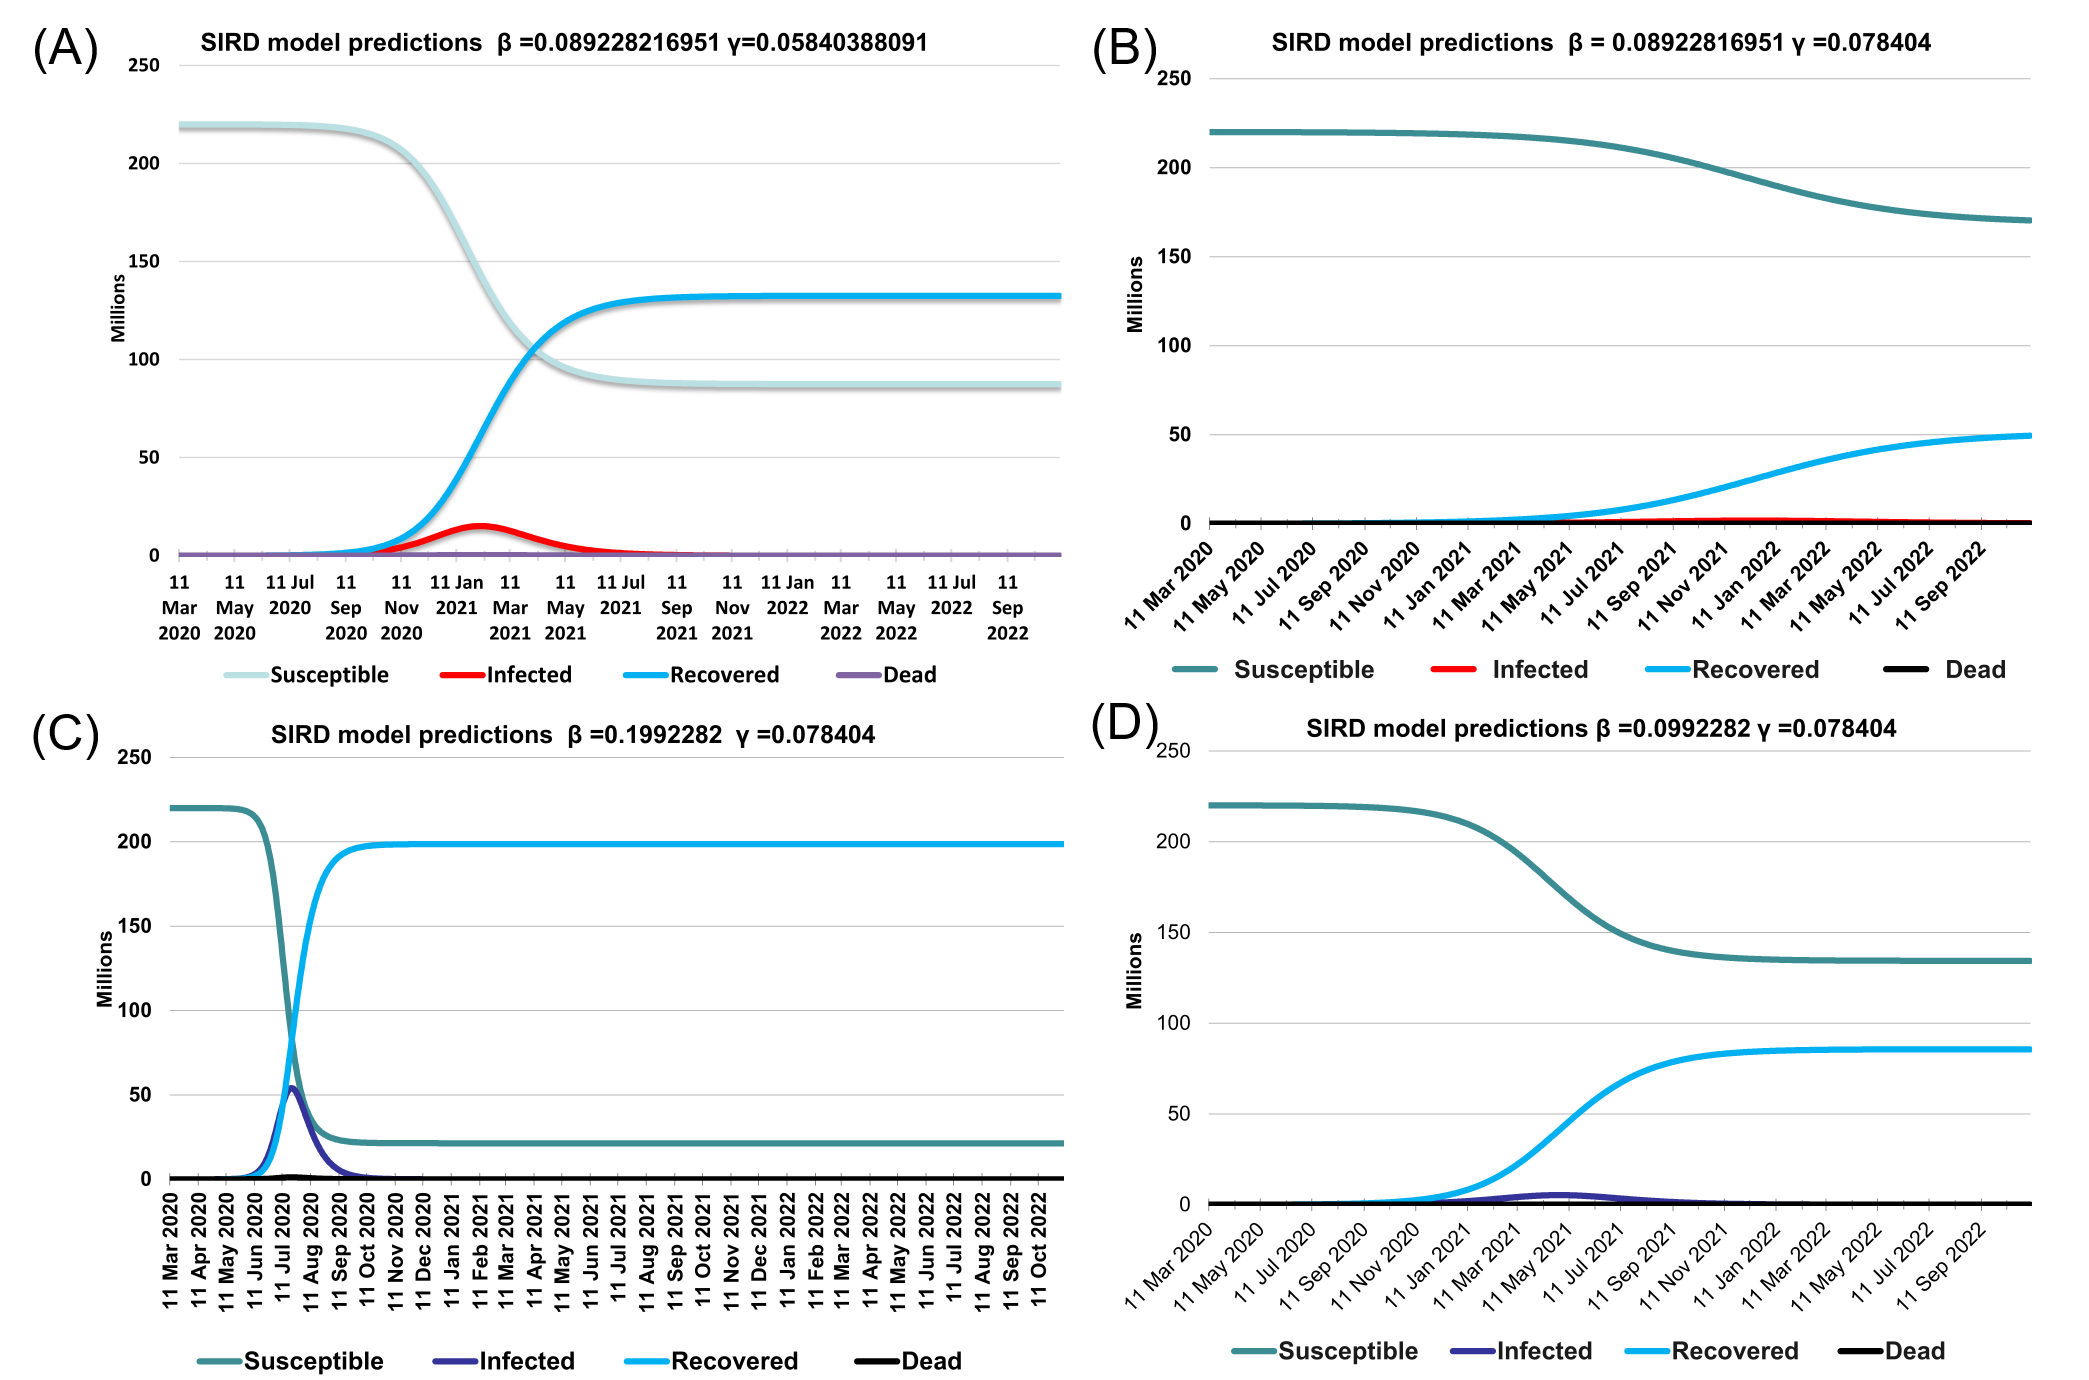
Fig. 2. The estimated results for Data Set 1-4 respectively.
Fig. 2 (a)-(d) shows predictions with different beta and gamma values as given by Table 1. Fig. 2(a) provides simulation results of the current situation with beta = 0.089228216951 and gamma = 0.05840388091 as per the original data of April. In total 14553 people will be being infected, 7357 recovered and 310 can be dead. Fig. 2(b) predicts that with supposed value for beta= 0.0992282 and gamma = 0.078404 than by the end of April 26677 people will be infected, 9563 recovered, and 568 deaths. Similarly, by the May 31, 23960 confirmed cases, 52170 recoveries, and 510 deaths are expected. For gamma = 0.1992282 and beta = 0.078404 details are given in Table 2.
Table (2):
Prediction with different Gamma (γ) and Beta (β) value using the SIRD Model.
| Prediction with different Gamma (γ) and Beta (β) value | |||||||||||
|---|---|---|---|---|---|---|---|---|---|---|---|
| Cases | Beta (β) | Gamma (γ) | R0 | End of April | End of May | ||||||
| S | I | R | D | S | I | R | D | ||||
| Data 1 (Fig. 3) | 0.089228216951 | 0.05840388091 | 2.13069533 | 219977780 | 14553 | 7357 | 310 | 219911491 | 37275 | 50440 | 794 |
| Data 2 | 0.0992282 | 0.078404 | 2.13069533 | 219977512 | 12656 | 9563 | 269 | 219923360 | 23960 | 52170 | 510 |
| Data 3 | 0.1992282 | 0.078404 | 2.13069533 | 219960072 | 26677 | 12683 | 568 | 218486614 | 907007 | 587053 | 19326 |
| Data 4 | 0.08922817 | 0.078404 | 2.13069533 | 219978738 | 11700 | 9313 | 249 | 219940445 | 16327 | 42881 | 347 |
According to WHO, until 27 April 2020; confirmed cases of COVID-19 have reached about the figure of 2878196 with 198668 deaths17. In this situation when humanity is on the mercy of is a dangerous pandemic like COVID-19 and it is engulfing thousands of lives daily. Under such a situation, it is better to draw the curve of pandemic under various conditions and let the peoples understand the outcomes. To analyze the current situation in Pakistan, we arranged data to figure the future of CIVID-19 in Pakistan under various supposed situations. We spread deadly from the recovered stage the main reason we put death spread from the R stage is that it recovered from the virus they can infect again in COVID19 many cases are reported this way we generalized the SIR model called SIRD. Above highlighted are generalized SIR or SIRD model in this model we sprit recovered and died in original Recovered and death are count in recover but a case of COVID-19 many cases are reported that recovered patient infect again this way we separate death and recovered Here S mean susceptible population and I mean infection population and R mean recover population we generalized SIR model adding dead rate D state in SIR model because of its possibilities one person who is infected and recover, it possibly it may infect again in COVID-19 case16, some cases also reported. We need to dead state because when infected dead it can never possibilities infect again because of dead here we have two possibilities a person who infected may be recovered or dead, possibilities of dead from COVID-19 is 2 to 3 percent depending upon on age factor and hospital facilities of a country.
Table (3):
Comparison of SARS, MARS, and COVID-19.
Diseases |
SARS |
MERS |
COVID-19 |
|---|---|---|---|
Year |
2003 |
2012 |
2019 |
Origin |
Guangdong (China) |
Middle East (KSA) |
Wuhan China (China) |
Fatality rate (%) |
11[3] |
34.4[3] |
2-3 |
Transmitted |
bats, that spread to other animals (civet cats) [4] |
Camel to human[18] |
Bats to human[19] |
Cases |
8000 |
2494 |
2482012 contd. [WHO] |
Dead count |
774[4] |
858 |
173034 |
Incubation period (days) |
4.7 (95%CI 4.3-5.1) [20] |
5.8 (95%CI 5.0-6.4) [20] |
4.9 (95% Cl 5.0-6.5) [20] |
Reproductive number (R0) |
2-5 [8] |
2.7-3.9 [9] |
3.28 [8] |
Countries |
26 [4] |
27 [18] |
More than 200 |
Vaccine[4] |
No (In process) |
No (In process) |
No (In process) |
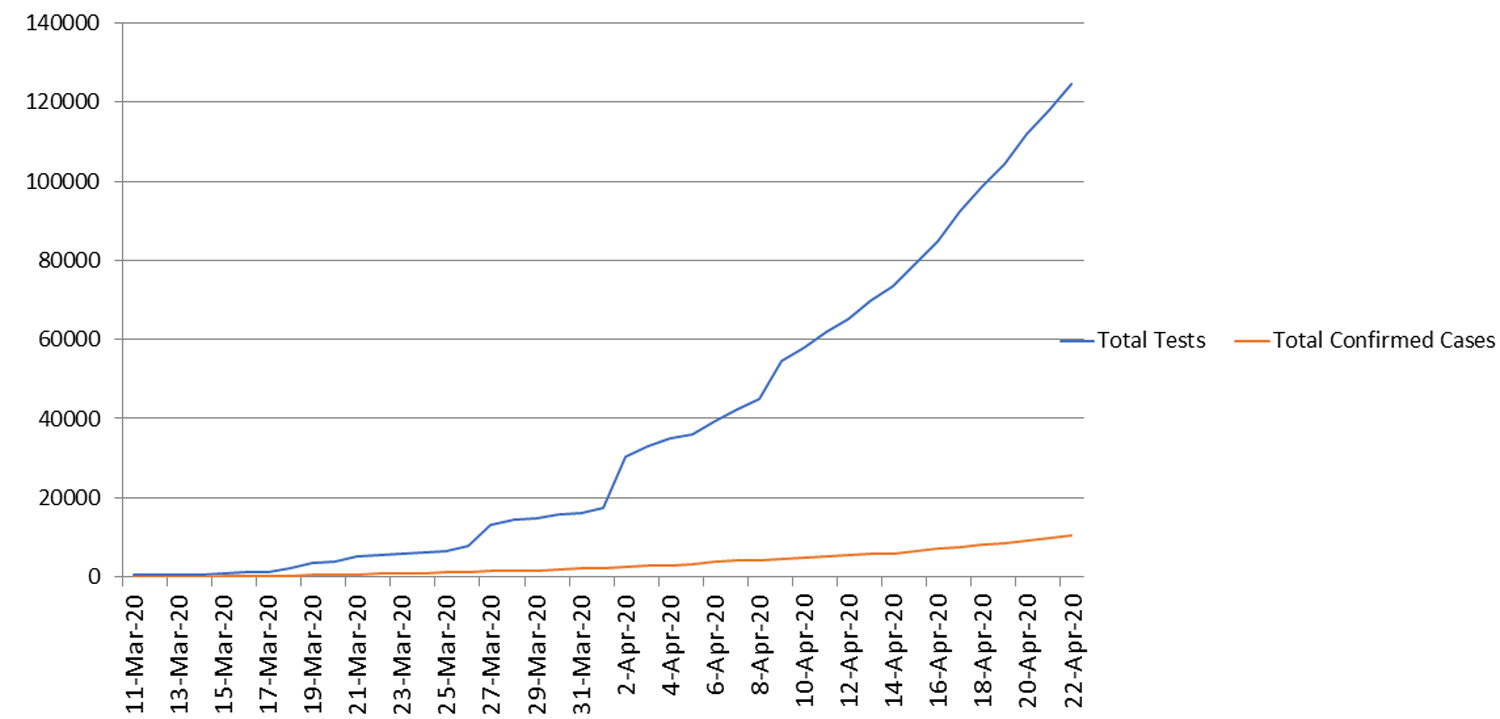
Fig. 3. Conducted test and conformed cases officially.
Recovery
Recovery of COVID-19 estimated 97-98% we applied Generalized SIR model to apply on Pakistani data available for the public12. It is assumed that population of Pakistan is 22 million and infection and recovered of COVID-19 is from that data we find beta (β) and gamma (g) and also find out the change in S, change in R and reproductive number on base of data and predict the recovery up to 98%.
Future prediction
Predicting the number of infections, recover, and dead in Pakistan due to COVID-19. This model required following parameters number of population (S) number of infection (I) and number of recovered (R) available data by available data we can predict the number of infection for future We can predict the number of death due to COVID-19 by using death rate generally a dead factor of COVID-19 is between 2-3% of total infected cases. We assumed that to formulate the model all population is at risk in Pakistan all population is very close to susceptible COVID-19. Infect everyone due in contact with each other Due to the economic problem, it is impossible to complete Lockdown in Pakistan is loosely implemented producing high infection rates.
The proposed method is generalized SIR mathematical method, we applied on Pakistan COVID-19 data available on the official website of Government of Pakistan12 from (11 march to 24 April) that data we predicted COVID-19 spread this months and end of May. The results predicted by gamma (0.05840388091) and beta (0.089228216951) value indicate that by the 31-April the number of infected might reach 14553, death toll by 310 recovered number of patients be 7357 and total infected cases are 37275. The death toll may reach 794 and 50440 will be recovered the above prediction is a current situation during the lockdown and social distancing. To further enhance the results improve gamma value and decrease beta. If serious preventive measures are not taken, infected cases may increase causing exhaustion of existing resources and ultimately the death rate will significantly increase. Strict prevention may eliminate COVID-19 which includes personal hygiene, social distancing, improving the immune system, and personal protective gear.
Our proposed method predicts spread, recovery, and death from COVID-19 in Pakistan. In the future, we analyze the spread of infectious diseases in developed and underdeveloped countries.
ACKNOWLEDGMENTS
All listed author(s) are thankful to their representative universities/institutes for providing the related support to compile this work.
CONFLICT OF INTEREST
The listed author(s) declare no conflict of interest in any capacity, including competing or financial.
AUTHORS’ CONTRIBUTION
All listed author(s) have made a substantial, direct, and intellectual contribution to the work, and approved it for publication.
FUNDING
None.
ETHICS STATEMENT
This article does not contain any studies with human participants or animals performed by any of the authors.
AVAILABILITY OF DATA
Not applicable.
- SR Weiss, S Navas-Martin. Coronavirus Pathogenesis and the Emerging Pathogen Severe Acute Respiratory Syndrome Coronavirus. Microbiol Mol Biol Rev. 2005;69:635-664.
Crossref - WHO, Coronaviruspress conference 11 February, 2020, (n.d.). https://www.who.int/emergencies/diseases/novel-coronavirus-2019/media-resources/press-briefings/2
- M Park, RS Thwaites, PJM Openshaw. COVID-19: Lessons from SARS and MERS, Eur J Immunol. 2020;50:308-311.
Crossref - WHO, SARS, (n.d.). https://www.who.int/ith/diseases/sars/en/
- Adina Morariu, Honoriu Valean, Camelia Avram., H1N1 Influenza on Romania Territory, (n.d.). http://ace.ucv.ro/analele/2010_vol1/07Morariu_Valean.pdf
- BCK Choi. A simple approximate mathematical model to predict the number of severe acute respiratory syndrome cases and deaths. J Epidemiol Community Health. 2003;57:831-835.
Crossref - L Peng, W Yang, D Zhang, C Zhuge, L Hong. Epidemic analysis of COVID-19 in China by dynamical modeling, Epidemiology. 2020.
Crossref - Y Liu, AA Gayle, A Wilder-Smith, J Rocklov. The reproductive number of COVID-19 is higher compared to SARS coronavirus. J Travel Med. 2020;27:taaa021.
Crossref - S Zhao, Q Lin, J Ran, SS Musa, G Yang, W Wang, Y Lou, D Gao, L Yang, D He, MH Wang, Preliminary estimation of the basic reproduction number of novel coronavirus (2019-nCoV) in China, from 2019 to 2020: A data-driven analysis in the early phase of the outbreak. Int J Infect Dis. 2020;92:214-217.
Crossref - B Canto, C Coll, E Sanchez. Estimation of parameters in a structured SIR model. Adv Differ Equ. 2017;2017:33.
Crossref - Chen, Yi-Cheng, Lu, Ping-En, Chang, Cheng-Shang. A Time-dependent SIR model for COVID-19 with Undetectable Infected Persons, 2020
- COVID-19 Goverment of Pakistan officiall website, (n.d.). http://covid.gov.pk/
- A Huppert, G Katriel. Mathematical modelling and prediction in infectious disease epidemiology. Clin Microbiol Infect. 2013;19:999-1005.
Crossref - H Ogut, SE LaPatra, PW Reno. Effects of host density on furunculosis epidemics determined by the simple SIR model, Prev Vet Med. 2005;71: 83-90.
Crossref - V Capasso, G Serio. A generalization of the Kermack-McKendrick deterministic epidemic model. Math Biosci. 1978;42:43-61.
Crossref - Daniel Leussink, Rocky Swift. WHO warns against declaring recovered patients ‘risk-free,’ (n.d.). https://mp.weixin.qq.com/s/4bEqFIvUu4LRA2kok4363g
- World Health Organization, Coronavirus disease 2019 (COVID-19) Situation Report – 98, World Health Organization, 2020. https://www.who.int/docs/default-source/coronaviruse/situation-reports/20200427-sitrep-98-covid-19.pdf?sfvrsn=90323472_4 (accessed April 28, 2020)
- WHO MERS, https://www.who.int/emergencies/mers-cov/en/, (n.d.)
- P Zhou, X-L Yang, X-G Wang, et al. A pneumonia outbreak associated with a new coronavirus of probable bat origin. Nature. 2020;579:270-273.
Crossref - W Xia, J Liao, C Li, et al. Transmission of coronavirus disease 2019 during the incubation period may lead to a quarantine loophole, Epidemiology. 2020.
Crossref
© The Author(s) 2020. Open Access. This article is distributed under the terms of the Creative Commons Attribution 4.0 International License which permits unrestricted use, sharing, distribution, and reproduction in any medium, provided you give appropriate credit to the original author(s) and the source, provide a link to the Creative Commons license, and indicate if changes were made.