

ISSN: 0973-7510
E-ISSN: 2581-690X
Multidrug-resistant Enteroaggregative Escherichia coli (EAEC) is gaining recognition as an important diarrheagenic pathogen with enhanced virulence characteristics. In this study, six typical EAEC isolates from clinical and animal sources were characterized phenotypically and genotypically. All isolates demonstrated the characteristic stacked-brick adherence pattern on HEp-2 cells and were positive for key EAEC-associated genes (aggR, cvd432, fimA, ecp, and irp2). Antimicrobial susceptibility testing identified three isolates as multidrug-resistant (MDR), with resistance observed against antibiotics such as, tetracycline, ampicillin, and ciprofloxacin. ESBL production was confirmed in MDR strains via double-disc synergy, nitrocefin, and PCR assays targeting blaTEM and blaCTXM9 genes. Under simulated gut stress conditions (bile salts, acidic pH, and oxidative stress), MDR strains exhibited enhanced survival and faster growth kinetics compared to non-MDR strains. Biofilm assays revealed stronger biofilm formation by MDR strains on diverse surfaces, with confocal microscopy confirming greater bio-volume and viability of MDR biofilms. In vivo survival assays using Galleria mellonella larvae showed significantly higher virulence of MDR strains, with increased mortality rates over 96 hours. The findings highlight the enhanced stress tolerance, biofilm-forming capacity, and pathogenicity of MDR-EAEC strains, underscoring their potential role in persistent infections and public health concerns.
Enteroaggregative Escherichia coli (EAEC), Multidrug-resistance (MDR), Biofilm Formation, ESBL, Galleria mellonella, Confocal Microscopy
Antimicrobial resistance (AMR) poses a major global health threat, with estimates indicating that, by 2050, it could lead to as many as 10 million deaths each year due to ineffective antimicrobial therapies.1 The rise of drug-resistant microorganisms, driven by antibiotic overuse and misuse, has led to an estimated 136 million hospital-acquired resistant infections each year worldwide.2 The World Health Organization (WHO) classifies antimicrobial resistance (AMR) as a major global concern, emphasizing the urgent need to curb the transmission of resistant bacteria and resistance genes across humans, animals, and environmental systems.3 Contributing factors include the unchecked use of antimicrobials in healthcare and agriculture, resulting in limited treatment options and considerable global morbidity and mortality.4 Efforts have been made to quantify the magnitude and socio-economic impact of AMR and predict its burden.5,6 Bacterial pathogens responsible for developing drug resistance in nosocomial and community-acquired infections include Escherichia coli, Klebsiella pneumoniae, Staphylococcus aureus, Streptococcus pneumoniae, and non-typhoidal Salmonella. After decades of extensive antibiotic use, E. coli, once regarded as a harmless commensal bacterium, has re-emerged as a significant threat to human health.7
Enteroaggregative E. coli (EAEC) has been associated with infectious diarrhoea in low- and middle-income countries. Similar to other members of the Escherichia coli species, EAEC is a Gram-negative, rod-shaped microorganism classified under the family Enterobacteriaceae.8 EAEC constitutes one of the six recognized diarrheagenic E. coli pathotypes, alongside Shiga toxin-producing E. coli (STEC), enteroinvasive E. coli (EIEC), diffusely adherent E. coli (DAEC), enterotoxigenic E. coli (ETEC), and enteropathogenic E. coli (EPEC).9 The pathogenesis of EAEC involves the formation of a thick biofilm on the intestinal epithelium, which is primarily driven by various bacterial cytotoxins and enterotoxins. The adherence and colonization of the intestinal epithelium are facilitated by aggregative adherence fimbriae, specialized pili with multiple allelic variants. EAEC can colonize both the small and large intestines.10 Bacterial colonization results in mucus hypersecretion, epithelial damage, and the activation of an inflammatory responses. EAEC presents heterogeneity in its phenotypic and genotypic distinction compared to other pathotypes of E. coli.11 Reports suggest an increasing trend in the emergence of drug resistance among these bacterial pathogens worldwide.12,13 Multidrug-resistant (MDR) bacterial strains are expected to harbour virulent traits in comparison to non-MDR bacterial strains.14 Multidrug-resistant (MDR) strains of Escherichia coli emerged as a result of the bacterium’s inherent ability to acquire genetic material from other bacterial species at the onset of the antibiotic era. With the increasing use of antibiotics, pre-existing resistant strains were subjected to continuous selective pressure, leading to the evolution and persistence of new resistant variants through horizontal gene transfer or spontaneous mutations.7 Systematic studies investigating the comparison of bacterial growth patterns between MDR and non-MDR bacterial strains subjected to physicochemical stressors remain unexplored.
Physicochemical defence within the gastrointestinal tract, such as gastric pH and bile salts, play a pivotal role in modulating bacterial growth. Bacterial strains may sense and respond to changes to survive extreme conditions.15 Bacterial strains have evolved the ability to scavenge free radicals and adapt to reactive oxygen species (ROS).16 Multidrug-resistant EAEC experiences stress in various ways. Exposure to antibiotics can lead to the upregulation of genes related to survival, stress response, and DNA repair, potentially contributing to antibiotic tolerance and multidrug-resistance.17 Stress can also impact biofilm formation, a key factor in antibiotic tolerance, with some drugs inhibiting biofilm formation by repressing genes responsible for producing biofilm matrix components like curli.18 Additionally, stress-induced changes in environmental conditions can affect the invasion dynamics of resistant E. coli into microbial biofilms, influencing their establishment and proliferation within the community.19 Understanding these stress responses and their effects on multidrug -resistant EAEC is crucial for developing strategies to combat antibiotic resistance.
Biofilms consist of microorganisms that organize into complex, structured communities encased in a matrix they secrete, working together in a coordinated and cooperative manner.20 The biofilm formed by enteroaggregative Escherichia coli (EAEC) is a complex structure composed of proteins, extracellular DNA, and carbohydrates. EAEC exhibits strong adherence to cultured epithelial cells and readily forms biofilms, processes that are primarily dependent on the presence of aggregative adherence fimbriae (AAF).21 This mode of growth is prevalent among microorganisms in both natural and clinical settings, offering a protective environment that enhances survival under hostile conditions.22 Compared to their free-floating (planktonic) counterparts, bacteria within biofilms exhibit significantly higher resistance to antibiotics,23 making biofilm-associated infections more persistent and prone to recurrence.24 The strong link between biofilm formation and antibiotic resistance has become a focal point in biomedical research. Studies have shown that sub-inhibitory concentrations of certain antibiotics can actually trigger biofilm development,25,26 suggesting that biofilm regulation plays a key role in the microbial response to environmental stressors, including antibiotic exposure.26
Resistant traits and virulence among bacteria can be transmitted between bacterial strains by horizontal gene transfer or transfer of mobile genetic elements, resulting in the dissemination and co-selection of virulence and resistant traits. In order to comprehensively grasp host-pathogen interactions, it is essential to synchronize in vitro growth dynamic information with in vivo discoveries. Recently, Galleria mellonella larvae have been embraced as efficient in vivo paradigms for scrutinizing the virulence and host-pathogen kinetics of EAEC strains. The use of the G. mellonella model has grown substantially in recent years, with over 250 studies published annually between 2022 and 2024. G. mellonella serves as a valuable alternative to traditional mammalian and non-mammalian models, offering benefits such as low maintenance cost, ease of handling, and biologically relevant attributes ideal for studying host-pathogen interactions.27 This larval model is particularly advantageous for assessing various aspects of pathogen virulence, including clinical symptoms, bacterial load, immune activation, haemocyte response, melanization, and histopathological changes.28 It also facilitates the surveillance of bacterial gene transcription.29 The virulence of EAEC strains in causing mortality in G. mellonella larvae has not been correlated with the presence of specific EAEC virulence genes.30 Research on EAEC, particularly concerning biofilm establishment in sugar-Dependent contexts, remains pivotal, given that these microorganisms construct sturdy biofilms on intestinal mucosa. Phytochemical interventions have showcased remarkable effectiveness in diminishing biofilm volume across varied E. coli strains, with diminishments ranging from
48%-65% to be removed.31 The application of confocal live/dead staining methodologies has been pivotal in pinpointing notable cellular demise within the biofilm subsequent to treatment.31 These approaches enable a more profound examination of the bacteria susceptibility to antibiotics and tendencies to form biofilms in reaction to sugar.32,33 Through the utilization of sophisticated imaging and precise interventions, investigators are unraveling the intricate mechanisms underpinning EAEC biofilm generation, thereby paving the path for forthcoming therapeutic tactics.
The research aim to study was to compare the in vitro growth kinetics of multidrug-resistant MDR-EAEC strains with non-MDR strains when exposed to various physicochemical stressors.
Chemicals
All chemicals and reagents used in this study were sourced from Himedia (India), BD Difco (USA), 3B BlackBio BioTech (Spain), CELLClone (USA), Merck (Germany), Thermo Scientific (USA), and BDH (Germany). All primers employed for characterizing typical and atypical EAEC pathotype isolates, as well as for validating ESBL production, were synthesized by Eurofins Genomics India Pvt. Ltd., Bengaluru.
Isolation and culture of bacteria
Six Escherichia coli isolates used in this study were retrieved from the institute microbial culture collection. These isolates were obtained from cases of clinical human infant diarrhoea, canine diarrhoea, and bovine milk samples. The isolates were designated as R1 (KY941936.1), R2 (KY941937.1), and R3 (KY941938.1) for multidrug-resistant E. coli, and S1 (KY941939.1), S2 (KY941940.1), and S3 (KY941941.1) for non-MDR E. coli (EAEC) strains. All isolates were revived in nutrient broth media using standard microbiological techniques as outlined by Brenner et al.34
Identification and Characterization of typical EAEC
Typical EAEC pathotypes were confirmed via the HEp-2 cell adherence assay.35 Further, adherence pattern was examined under light microscopy after Giemsa staining. Molecular characterization of typical EAEC was performed through PCR as per Pathak et al.33 Briefly, DNA extraction was carried out using the QIAamp DNA Kit (QIAGEN, Cat No. 56304), followed by PCR amplification to detect plasmid-borne genes (cvd432, aggR) and chromosomal genes (fimA, ecp, irp2) linked to EAEC. PCR amplification was performed using an Eppendorf Mastercycler® (Germany), and the results were analysed by agarose gel electrophoresis.
Disc diffusion test
To evaluate the antimicrobial susceptibility of EAEC isolates using the Kirby-Bauer disc diffusion method as described by Bauer et al.36 The antibiotics tested included imipenem (IPM 10 µg), co-trimoxazole (COT 25 mg), tetracycline (TE 30 mg), ampicillin (AMP 10 mg), ciprofloxacin (CIP 5 mg) and ceftriaxone (CTR 30 mg). Bacterial cultures were standardized to a 0.5 McFarland turbidity (1.5 x 10⁸ x CFU mL-1) and plated onto Mueller-Hinton Agar (MHA). After incubating the plates at 37 °C for 24 hours, the inhibition zone diameters were measured using an antibiotic zone scale. Antibiotic susceptibility, resistance, and intermediate phenotypes were interpreted according to Clinical and Laboratory Standards Institute (CLSI) guidelines.37 The minimum inhibitory concentration (MIC) for resistant antibiotics was determined using Ezy MIC™ Strips (HiMedia, India). The results were used for further analysis to compare non-MDR and MDR strains based on their resistance patterns.
Detection of extended spectrum β-lactamase (ESBL)
ESBL production was identified using both phenotypic and genotypic methods, including the double-disc synergy test, Nitrocefin test, and PCR-based confirmation.
Double-disc synergy test
To confirm ESBL production in both MDR and non-MDR strains, the double-disc synergy test was performed according to CLSI guidelines. Bacterial cultures were standardized to a 0.5 McFarland turbidity (1.5 x 10⁸ CFU mL-1) and plated on Mueller-Hinton Agar (MHA). Antibiotic discs used included cefotaxime (CTX, 30 µg), cefotaxime + clavulanic acid (CEC, 30/10 µg), ceftazidime (CAZ, 30 µg), and ceftazidime + clavulanic acid (CAC, 30/10 µg). After 18-24 hours of incubation at 37 °C, a ≥5 mm difference in the inhibition zones between CTX and CEC or CAZ and CAC indicated the presence of ESBL production.
Nitrocefin test
To further confirm β-lactamase activity, the Nitrocefin test was performed. Overnight cultures of MDR and non-MDR strains were exposed to 4-5 drops of Nitrocefin solution (1 mg mL-1 in PBS) and incubated at 37 °C for 30 minutes. A color change from yellow to red indicated ESBL production.
PCR-based confirmation
For the molecular identification of ESBL genes in MDR and non-MDR strains, PCR was employed to detect the blaCTXM9 and blaTEM genes. The PCR protocol consisted of an initial denaturation step at 95 °C for 5 minutes, followed by 30 cycles of denaturation at 95 °C for 30 seconds, annealing at 52 °C for 30 seconds, and extension at 72 °C for 1 minute. A final extension was performed at 72 °C for 7 minutes, followed by a hold at 4 °C.
In vitro gut conditions growth under stress
To study the effects of in vitro gut conditions under stress on the growth of MDR and non-MDR strains, cultures were grown separately in sterile nutrient broth supplemented with bile salts (0.80%), hydrogen peroxide (H2O2); (1%, 2.5%) and varying pH levels (3.0, 7.4, 9.0), and control cultures were maintained under standard conditions without any stressors. Each culture flask was incubated at 37 °C in a shaker incubator set at 200 rpm (Eppendorf, USA). The optical density (OD) at 600 nm was measured hourly for up to 8 hours.
Biofilm formation and viability assessment
Evaluation of biofilm formation and bacterial viability through semi-quantitative analysis, confocal microscopy, and live/dead quantification with Fiji ImageJ.
Semi-quantitative biofilm assessment methodology
Biofilm formation by MDR and non-MDR isolates was evaluated using crystal violet staining with slight modifications from Pathak et al.33 A bacterial suspension with a density equivalent to the 0.5 McFarland standard was inoculated into 96-well plates containing Dulbecco’s Modified Eagle Medium (DMEM) (Cellclone, Genetix) and nutrient broth, each supplemented with varying concentrations of D-glucose (0.45%). After 24 hours of incubation at 37 °C, planktonic cells were removed by washing with PBS. Biofilms were stained with 0.1% crystal violet for 45 minutes at 37 °C, and the bound stain was solubilized with 95% ethanol at 4 °C for 1 hour. OD at 590 nm was used to quantify biofilm formation. Biofilm formation was assessed on various surfaces, including glass, polystyrene, and stainless steel 304, using DMEM media supplemented with 0.45% D-glucose. The biofilm formation was classified into four categories: negative (<0.35), weak (0.35-0.69), moderate (0.70-1.09), and strong (≥1.10), as per the method described by Naves et al.38
Confocal microscopy
Biofilms formed by MDR and non-MDR strains in DMEM + 0.45% glucose on a polystyrene surface were visualized using confocal microscopy with a BacLight Kit (Invitrogen, USA, Cat No. L7012). To prepare the staining solution, mix SYTO9 and propidium iodide (PI) in a 3:1000 ratio with nuclease-free water. The solution was added to the biofilms grown well and incubate in the dark for 25 minutes at room temperature. After incubation, wash the biofilms with sterile PBS and visualize them using the Olympus FV100 system (Japan). The SYTO9 stain exhibits excitation/emission maxima at approximately 480/500 nm, while propidium iodide shows maxima at around 490/635 nm. Images were captured using red and green filters, and the stained biofilms were analyzed by merging the images with Olympus Fluoview v 3.0a software.
Live/dead bacteria quantification using Fiji ImageJ
Confocal images were analyzed to quantify live (green) and dead (red) bacteria using Fiji ImageJ software (v.1.51s).39 Bio-volumes of live and dead bacteria were calculated from the image stacks, with background noise being automatically subtracted by the software. The resulting data were displayed in a color histogram and interpreted based on Red-Green intensity ratios.
In vivo survival analysis of Galleria mellonella larvae
In vivo assays were performed using final instar G. mellonella larvae, which were kept in wood shavings at 15 °C in the dark prior to the experiment. The larvae were maintained in a sterile environment with ad libitum access to food. All six bacterial strains (MDR and non-MDR) were prepared at a concentration of 1.5 × 10⁷ CFU mL-1 in sterile PBS with 10% glucose. The bacterial suspension was injected into the larvae last right pro-leg using a Hamilton syringe (26-gauge), and survival was monitored at regular intervals over 96 hours.
Statistical analysis
The results are presented as means ± standard deviations. Statistical significance was determined using a two-way ANOVA, performed with GraphPad Prism 5.01. A p-value of <0.001 was considered statistically significant, while p-values >0.001 were deemed non-significant. Additionally, linear regression analysis was conducted to assess the relationship between variables.
HEp-2 adherence and genetic confirmation
The ‘gold standard’ HEp-2 cell adherence assay was used to characterize six typical EAEC isolates (R1, R2, R3, S1, S2, S3). All isolates displayed the characteristic stacked-brick pattern, confirming their ability to adhere and spread disease as typical EAEC (Figure 1). The six EAEC isolates were screened for the presence (+) or absence (-) of plasmid-borne genes (cvd, aggR) and chromosomal genes (fimA, Irp2, ecp). Isolates R1, S2, and S1 lack fimA, while R3 lacks both cvd and Irp2. All other isolates consistently display positive results for aggR and ecp (Table 1).
Table (1):
Characterization of typical EAEC Isolates. Plasmid-Borne (cvd432, aggR) and Chromosome Encoded genes (fimA, Irp2, ecp). The symbols “+” denote the presence and “-” denote for absence of genes in the isolates
| Isolate ID | Plasmid borne genes | Chromosomal genes | |||
|---|---|---|---|---|---|
| cvd | aggR | fimA | Irp2 | ecp | |
| R1 | + | + | – | + | + |
| R2 | + | + | + | + | + |
| R3 | – | + | + | – | + |
| S1 | + | + | + | + | + |
| S2 | + | + | – | + | + |
| S3 | + | + | + | + | + |
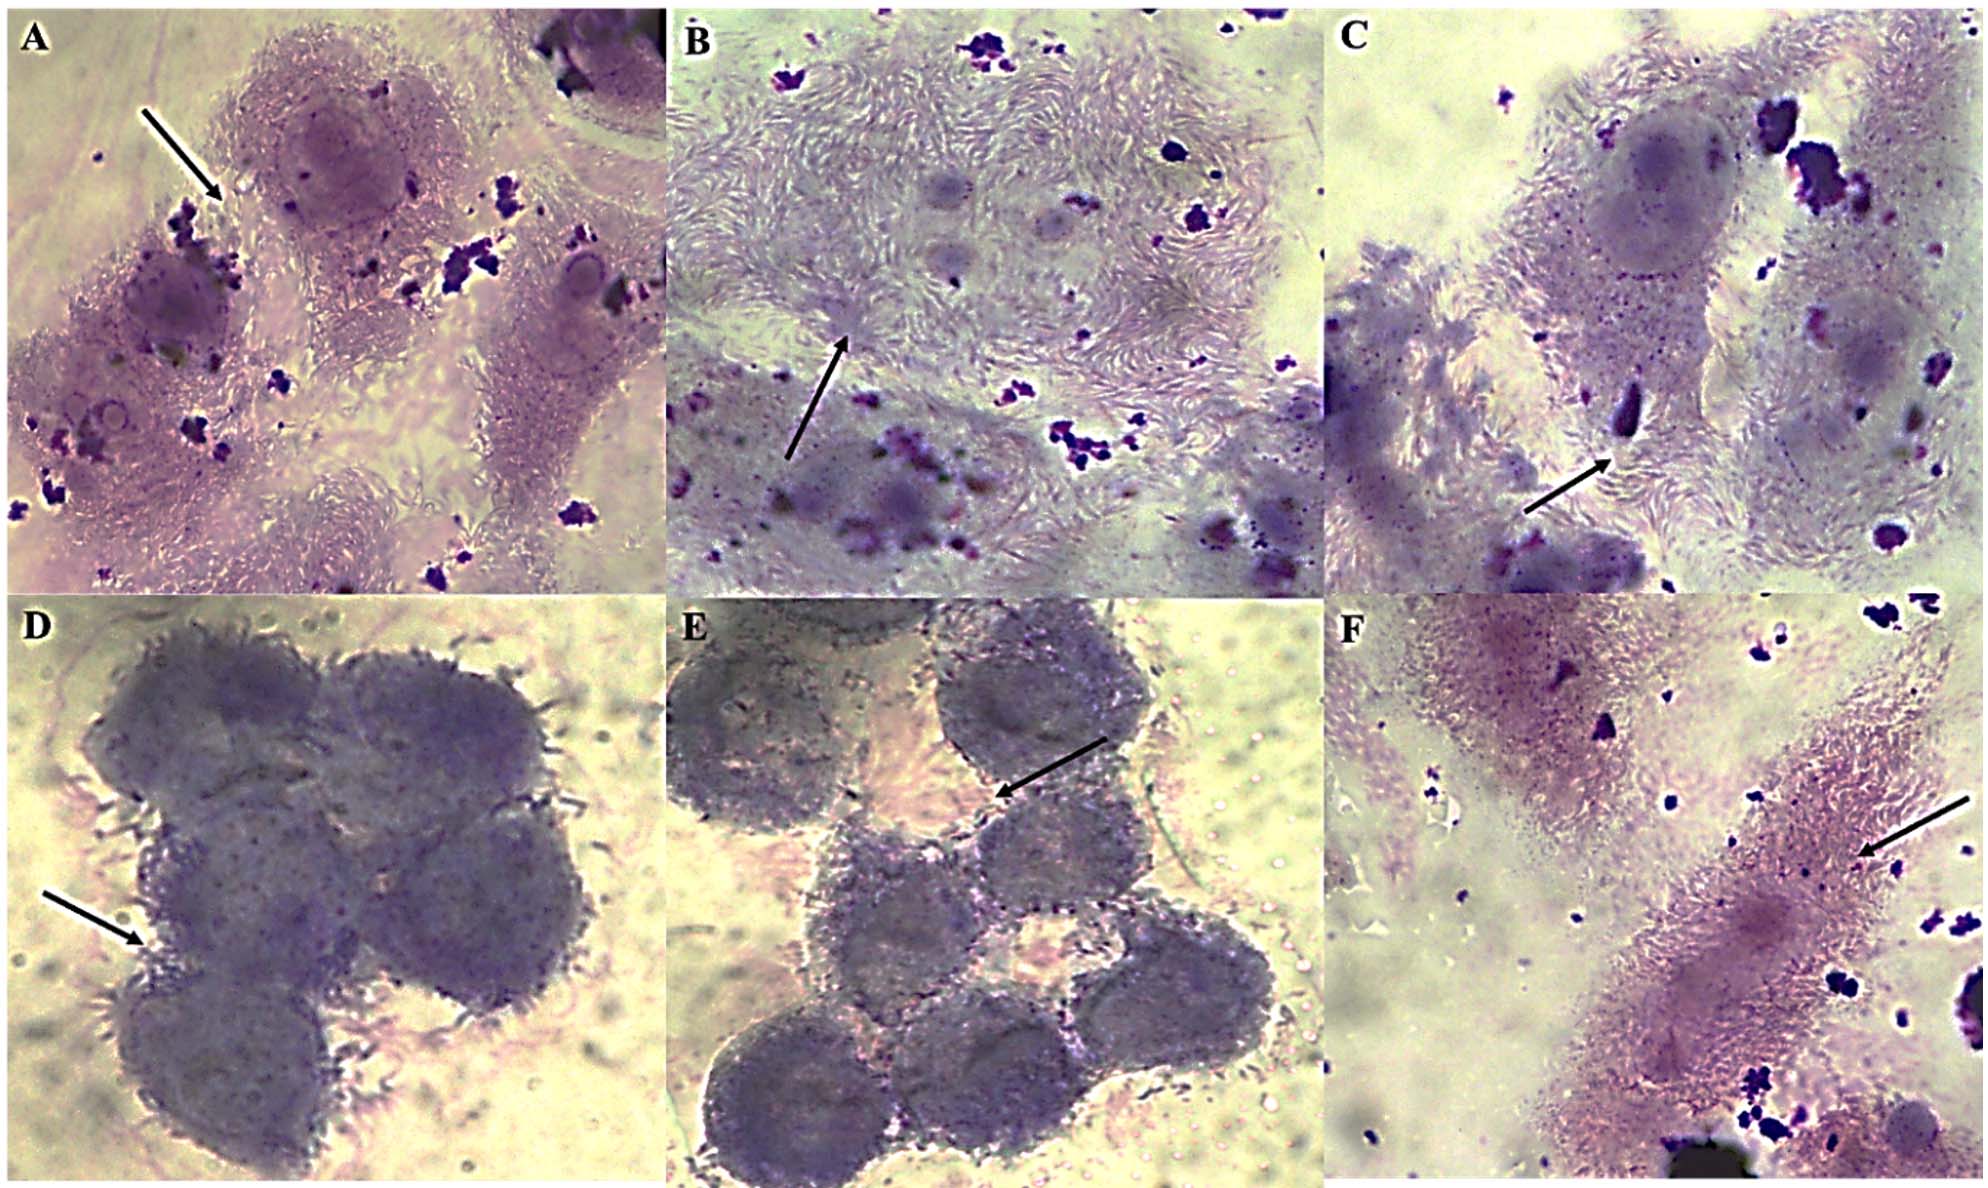
Figure 1. HEp-2 cell adherence patterns of EAEC isolates. Panels (A-C) strong aggregative adherence in MDR isolates R1-R3, (D-F) moderate adherence in non-MDR isolates S1-S3. The characteristic “stacked-brick” pattern indicates typical EAEC morphology
Antibiotic susceptibility and MIC profiles of EAEC isolates
The antibiotic susceptibility and minimum inhibitory concentration (MIC) results for all isolates (R1, R2, R3, S1, S2, and S3) revealed diverse resistance patterns (Figure 2). Isolate R1 exhibited resistance to ampicillin (AMP), co-trimoxazole (COT), and tetracycline (TE), with corresponding MIC values exceeding 240 µM for AMP and COT, and 60 µM for TE. Isolates R2 and R3 demonstrated multidrug-resistance, being resistant to ciprofloxacin (CIP), ceftriaxone (CTR), AMP, COT, and TE, with MIC values consistently >240 µM for most of these antibiotics. In contrast, isolates S1 and S3 were mostly susceptible, with S1 showing resistance only to TE, having an MIC of 60 µM. Isolate S2 was largely susceptible, except for resistance to AMP, with an MIC >240 µM (Table 2). The result confirms that isolates R1, R2, and R3 are multidrug-resistant (MDR), while isolates S1, S2, and S3 are susceptible (non-MDR).
Table (2):
Antibiotic susceptibility profiling and MIC of typical EAEC isolates. Ciprofloxacin (CIP5), Ceftriaxone (CTR30), Ampicillin (AMP10), Co-trimoxazole (COT25), Tetracycline (TE30), Imipenem (IMP10). The ‘R’ designation indicates resistance, while ‘S’ indicates susceptibility
| Isolate | Antibiotic susceptibility test* | MIC (µM) | |||||||||
|---|---|---|---|---|---|---|---|---|---|---|---|
| CIP5 | CTR30 | AMP10 | COT25 | TE30 | IMP10 | CTR | AMP | COT | TE | CTR | |
| R1 | S | S | R | R | R | S | S | >240 | >240 | 60 | S |
| R2 | R | R | R | R | R | S | >240 | >240 | >240 | 2 | >240 |
| R3 | R | R | R | R | R | S | >240 | >240 | >240 | 30 | >240 |
| S1 | S | S | S | S | R | S | S | S | S | 60 | S |
| S2 | S | S | R | S | S | S | S | >240 | S | S | S |
| S3 | S | S | S | S | S | S | S | S | S | S | S |
*CLSI (2018) guideline
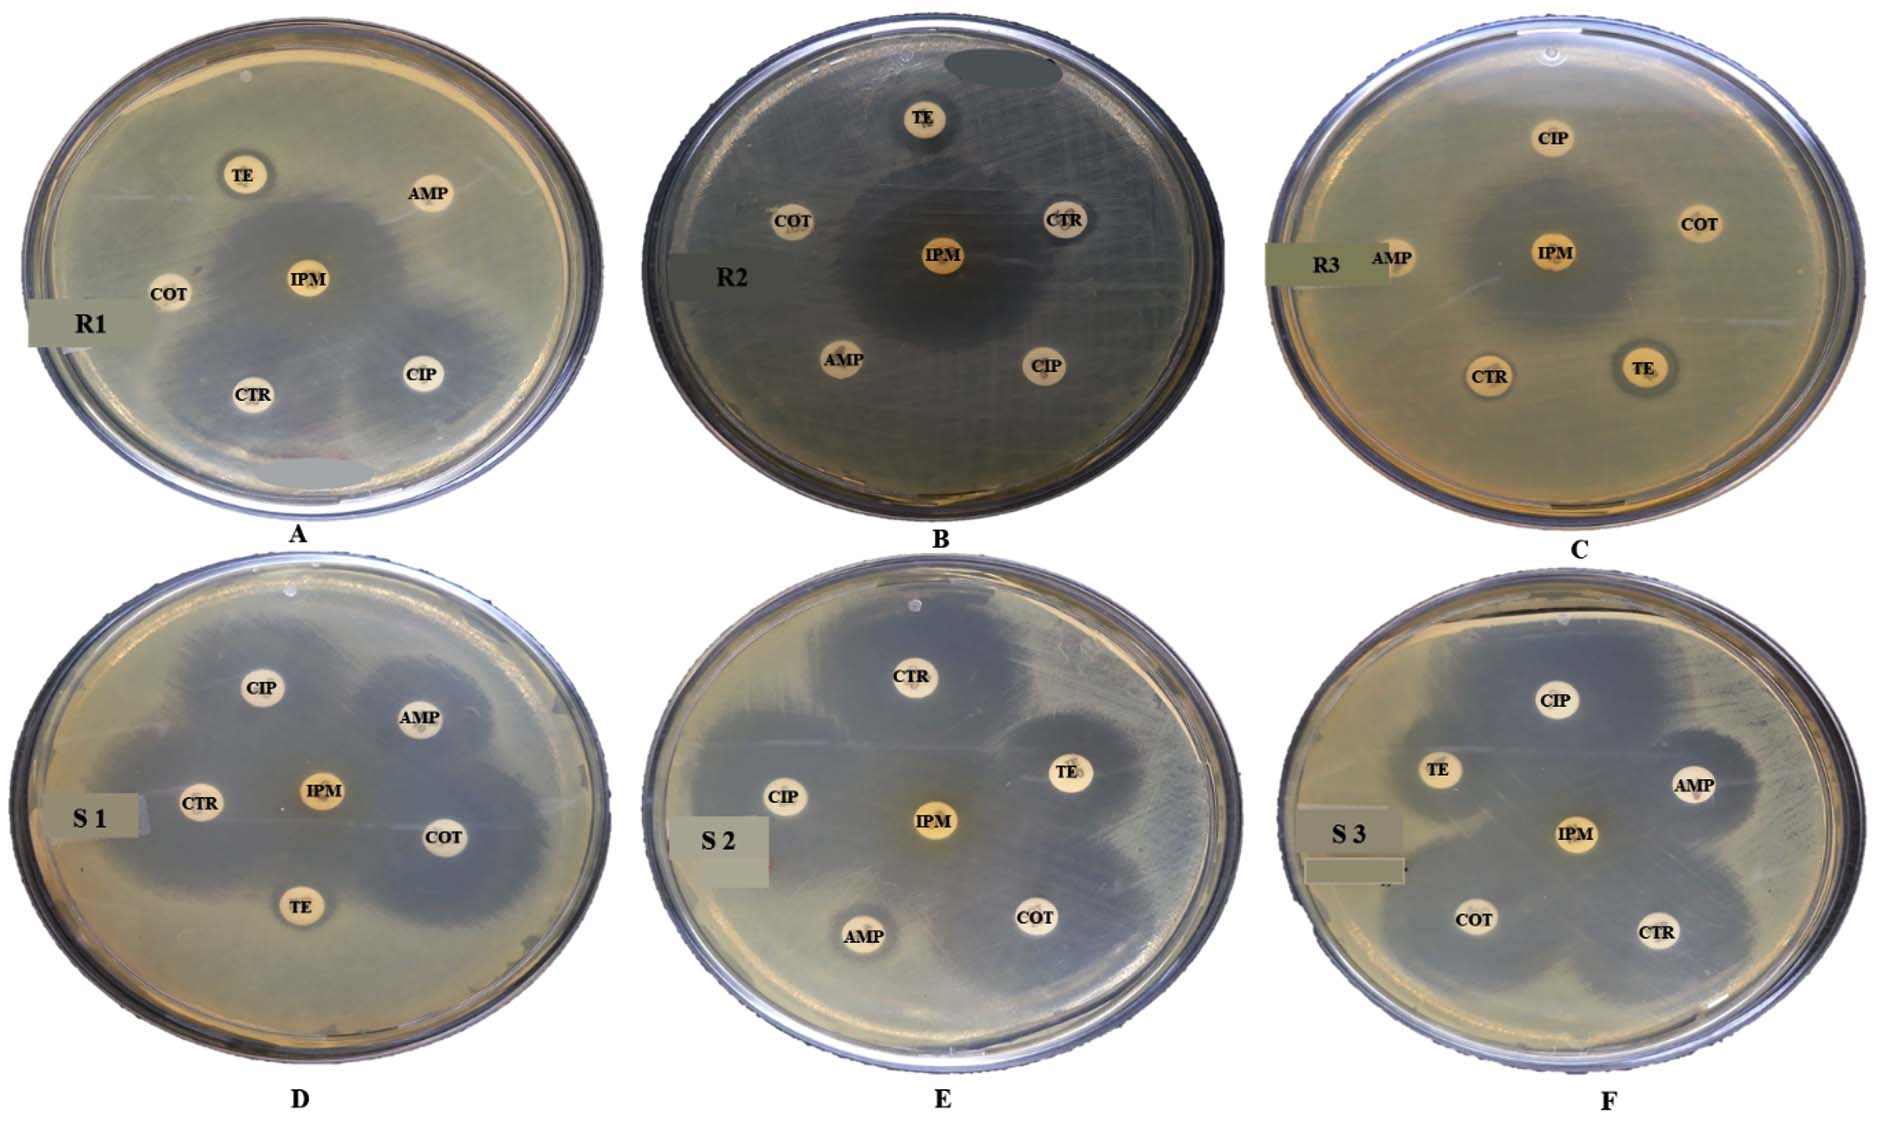
Figure 2. Antibiotic susceptibility patterns of EAEC isolates. Panels (A-C) represent MDR isolates R1-R3, and panels (D-F) show non-MDR isolates S1-S3. Antibiotics tested include imipenem (IPM, 10 mg), co-trimoxazole (COT, 25 mg), tetracycline (TE, 30 mg), ampicillin (AMP, 10 mg), ciprofloxacin (CIP, 5 mg), and ceftriaxone (CTR, 30 mg). Resistance and susceptibility were interpreted according to standard CLSI guidelines
Identification of ESBL production
The MDR isolates exhibited ESBL-producing ability by showing resistance to cefotaxime (CTX) and ceftazidime (CAZ) antibiotic with clavulanic acid combination while non-MDR were susceptible to both antibiotics (Table 3). However, all isolates showed a positive reaction for the colorimetric nitrocefin test (Figure 3), PCR assays detected the blaCTXM-9 and blaTEM genes in all MDR isolates, while these genes were absent in non-MDR isolates (Table 3), which confirms the correlation between the presence of ESBL genes and phenotypic resistance observed in the MDR isolates.
Table (3):
Phenotypic confirmation of ESBL ability in EAEC strains through the double-disc diffusion assay and nitrocefin test. PCR-based detection of ESBL genes in EAEC strains. blaCTXM-9: gene encoding beta-lactamase cefotaximase; blaTEM: gene encoding beta-lactamase Temoneira
| Isolates | Double-disc diffusion assay | Nitrocefin | ESBL genes | ||
|---|---|---|---|---|---|
| CTX | CAZ | blaCTXM-9 | blaTEM | ||
| R1 | R | R | + | + | + |
| R2 | R | R | + | + | + |
| R3 | R | R | + | + | + |
| S1 | S | S | + | – | – |
| S2 | S | S | + | – | – |
| S3 | S | S | + | – | – |
Cefotaxime (CTX) and ceftazidime (CAZ) antibiotics with/out clavulanic acid was used in the double-disc diffusion method, where R indicates resistance and S indicates susceptibility
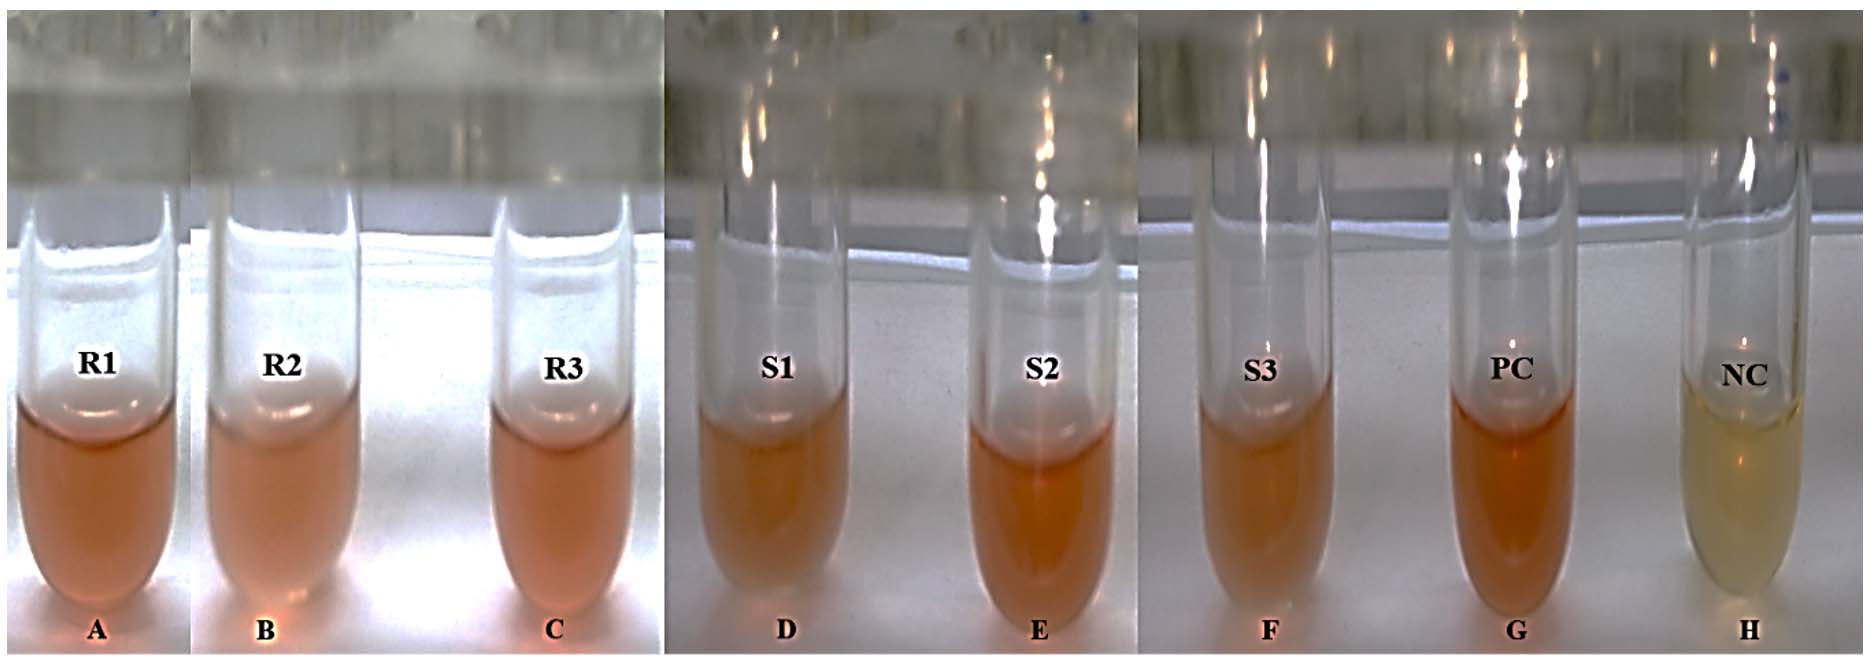
Figure 3. Detection of β-lactamase activity using the Nitrocefin assay. (A) Multidrug-resistant; R1, (B) Multidrug-resistant; R2, (C) Multidrug-resistant; R3, (D) Sensitive; S1, (E)Sensitive; S2, (F) Sensitive; S3, (G) Positive control, (H) Negative Control. This chromogenic test indicates the presence of β-lactamase enzymes in EAEC isolates. A color change from yellow to red signifies a positive reaction, confirming β-lactamase production, which is associated with resistance to β-lactam antibiotics. Yellow indicates a negative result (no enzyme activity), while red indicates a positive result (active β-lactamase production)
Growth under modified conditions
pH
Growth kinetics of MDR and non-MDR strains were evaluated by linear regression at pH 3.0, 7.4, and 9.0. The test strains grew in a steadily increasing pattern at optimal pH. At an acidic pH (3.0), however, after a quick increase in bacterial growth at 1 h, a rapid fall was observed by 2 h, regardless of the test strains (Figure 4A). The bacterial growth pattern showed progressively rising trends at neutral and alkaline pH (7.40 and 9.0) (Figures 4B, C). Linear regression analysis revealed a good fit for all strains, with varying coefficients of determination indicating the quality of fit across different strains.
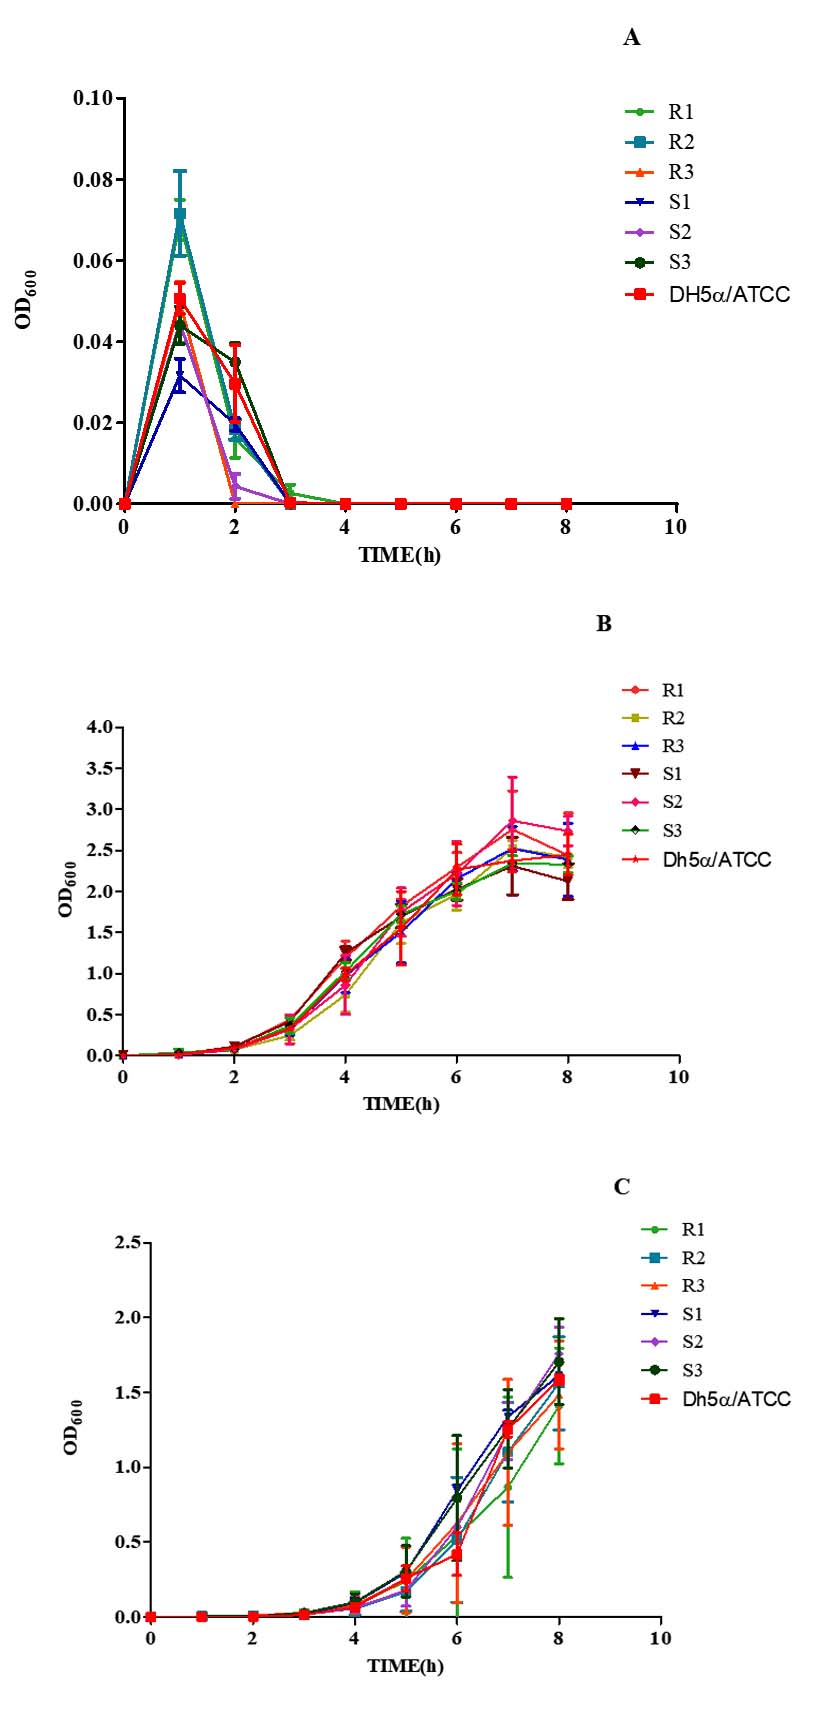
Figure 4. Growth kinetics of MDR (R1-3) and non-MDR (S1-3) EAEC isolates at pH (A) 3.0, (B) 7.4, (C) 9.0. Comparing growth kinetics of MDR and non-MDR EAEC isolates at pH 3.0, R1 and R2 show similar declining slopes (-0.00715 to -0.00101 and -0.00738 to -0.00101) with r² values of 0.231 and 0.227, respectively. R3 displays a less steep decline (-0.00476 to -0.000202, r² = 0.167). Non-MDR isolates (S1, S2, S3) exhibit less negative slopes and higher r² values. At pH 7.4 and 9.0, all MDR and non-MDR isolates show positive slopes (0.103 to 0.482) with r² values ranging from 0.580 to 0.931. This suggests differing responses to acidic pH between MDR and non-MDR isolates, but similar trends at neutral and alkaline pH levels as determined by linear regression assay
H2O2
The bacterial strains when subjected to H2O2 (1.0%), had an increasing growth pattern exhibited up to 1 h, thereafter the bacterial growth tends to decline progressively. Later, no visible growth corresponding to the optical density could be obtained after 6 h, indicating bacterial death (Figure 5A). Moreover, while the bacterial strains were subjected to 2.50% H2O2, a similar trend in the growth pattern was exhibited; nonetheless, the bacterial density tends to zero by 5 h post-co-incubation (Figure 5B). Both concentrations of H2O2 significantly affected the growth kinetics of the MDR and non-MDR isolates, with stronger inhibitory effects observed at the higher concentration.
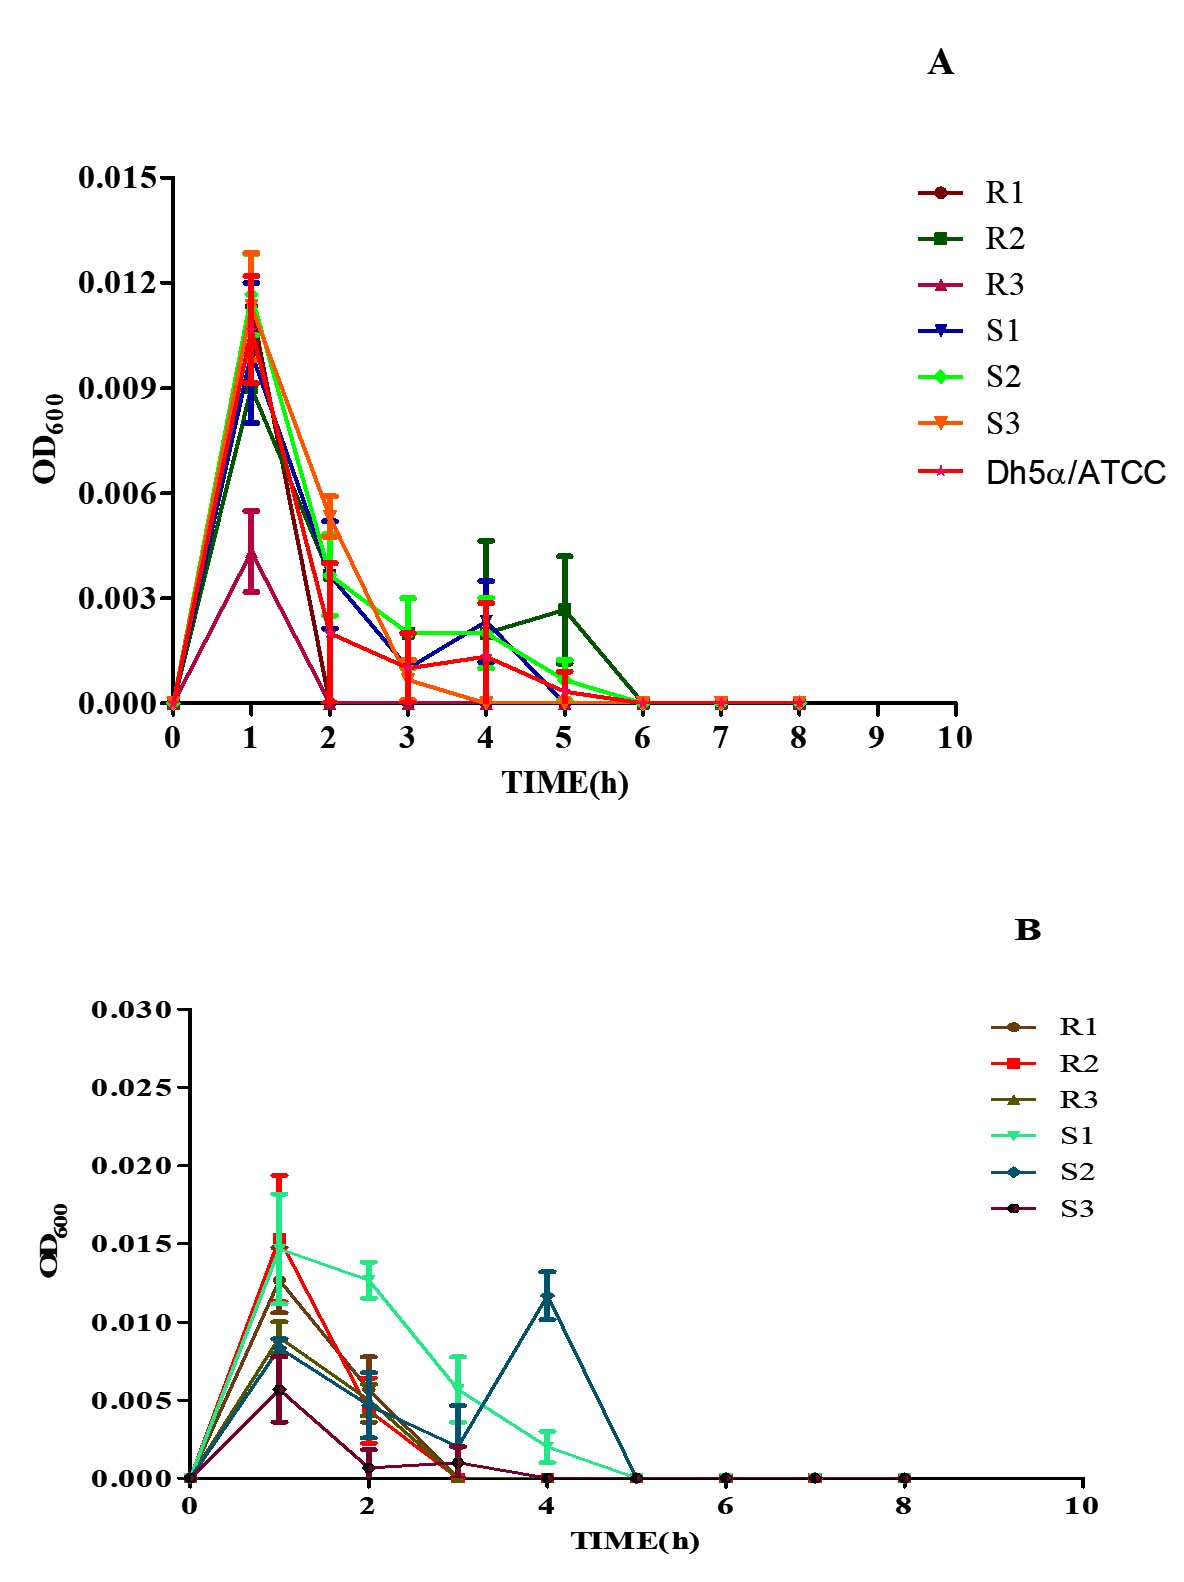
Figure 5. Growth kinetics of MDR (R1-3) and non-MDR (S1-3) EAEC isolates under (A) 1% and (B) 2.5% of hydrogen peroxide (H2O2) concentrations. Negative slopes (-0.00141 to -0.000239 for 1%; -0.00109 to -0.0000443 for 2.5%) indicate reduced growth over time. Corresponding r² values (0.136 to 0.325 for 1%; 0.160 to 0.272 for 2.5%) represent correlation strength as determined by linear regression assay. 2.5% H2O2 generally shows lower slopes and weaker correlations, implying a stronger inhibitory effect, impacting both MDR and non-MDR isolates
Bile salts
Bile salts (0.80%) affected all MDR and non-MDR isolates. At 0.80% bile salt content, the interaction between the growth kinetics of all all the six isolates was shown to be significant
(p < 0.001). Non-MDR (S1 and S2) showed a steadily increasing growth rate compared to MDR (R1-3) isolates (Figure 6), but only non-MDR, S3 strain showed an enhanced growth pattern until 4 hours of incubation and remained stable. The slopes of the growth curves ranged from 0.4984 to 0.6262, indicating a steady increase in growth over time. The coefficient of determination (r²) values ranged from 0.8939 to 0.9478, suggesting strong correlations between the observed and predicted values, indicating a good fit of the linear regression models.
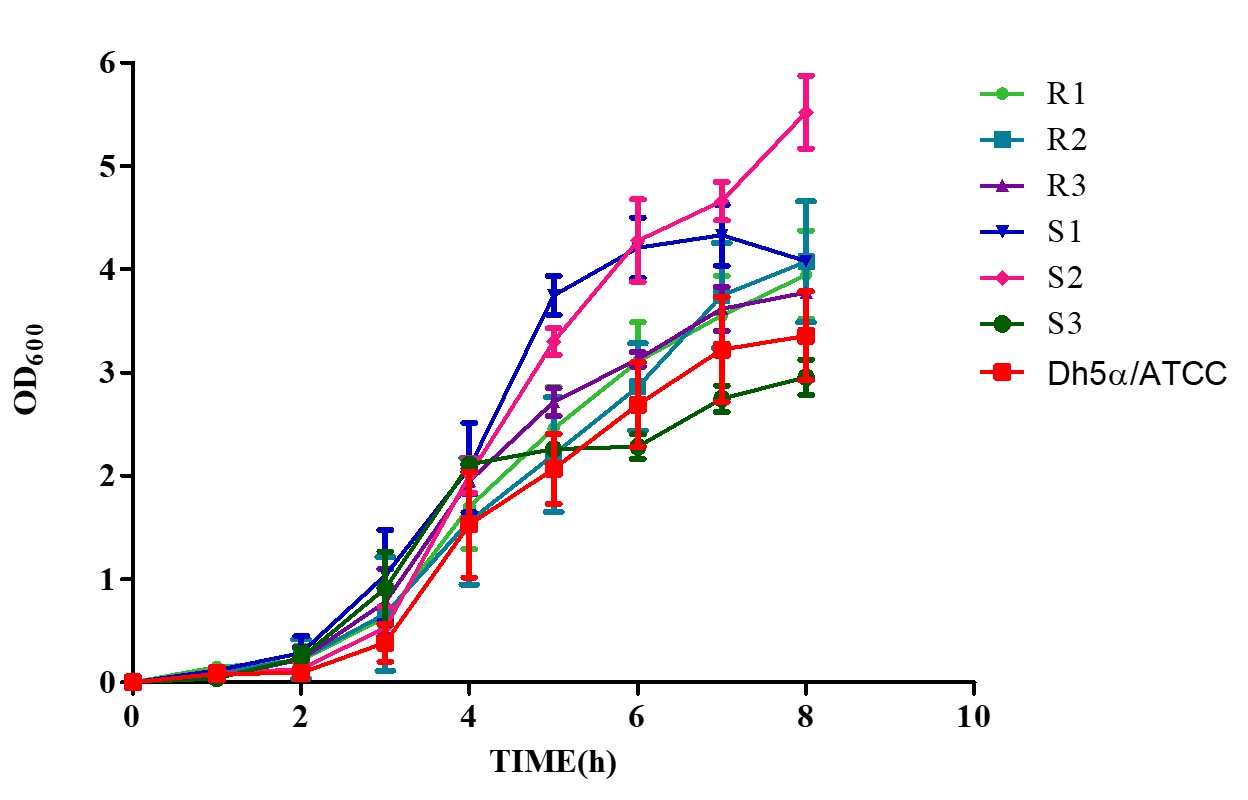
Figure 6. Growth kinetics of MDR (R1-3) and non-MDR (S1-3) EAEC isolates to bile salts (0.80%). Positive slopes (0.4984 to 0.6262 for MDR; 0.4936 to 0.6447 for non-MDR) indicate increased growth over time. Corresponding r² values (0.8939 to 0.9478 for MDR; 0.9059 to 0.9335 for non-MDR) reflect strong correlation between time and growth kinetics as determined by linear regression assay. Both MDR and non-MDR isolates demonstrate robust growth in the presence of bile salts, with MDR isolates showing slightly higher growth rates in this condition
Biofilm formation by EAEC
Different media
The biofilm formation of MDR and non-MDR isolates was significantly enhanced (p < 0.001) in DMEM and DMEM supplemented with D-Mannose compared to the control. Additionally, significant (p < 0.001) biofilm formation was observed in DMEM with D-Glucose for all isolates. In contrast, biofilm formation in nutrient broth with D-Glucose and D-Mannose showed no significant difference (p > 0.001) compared to the control (Figure 7).
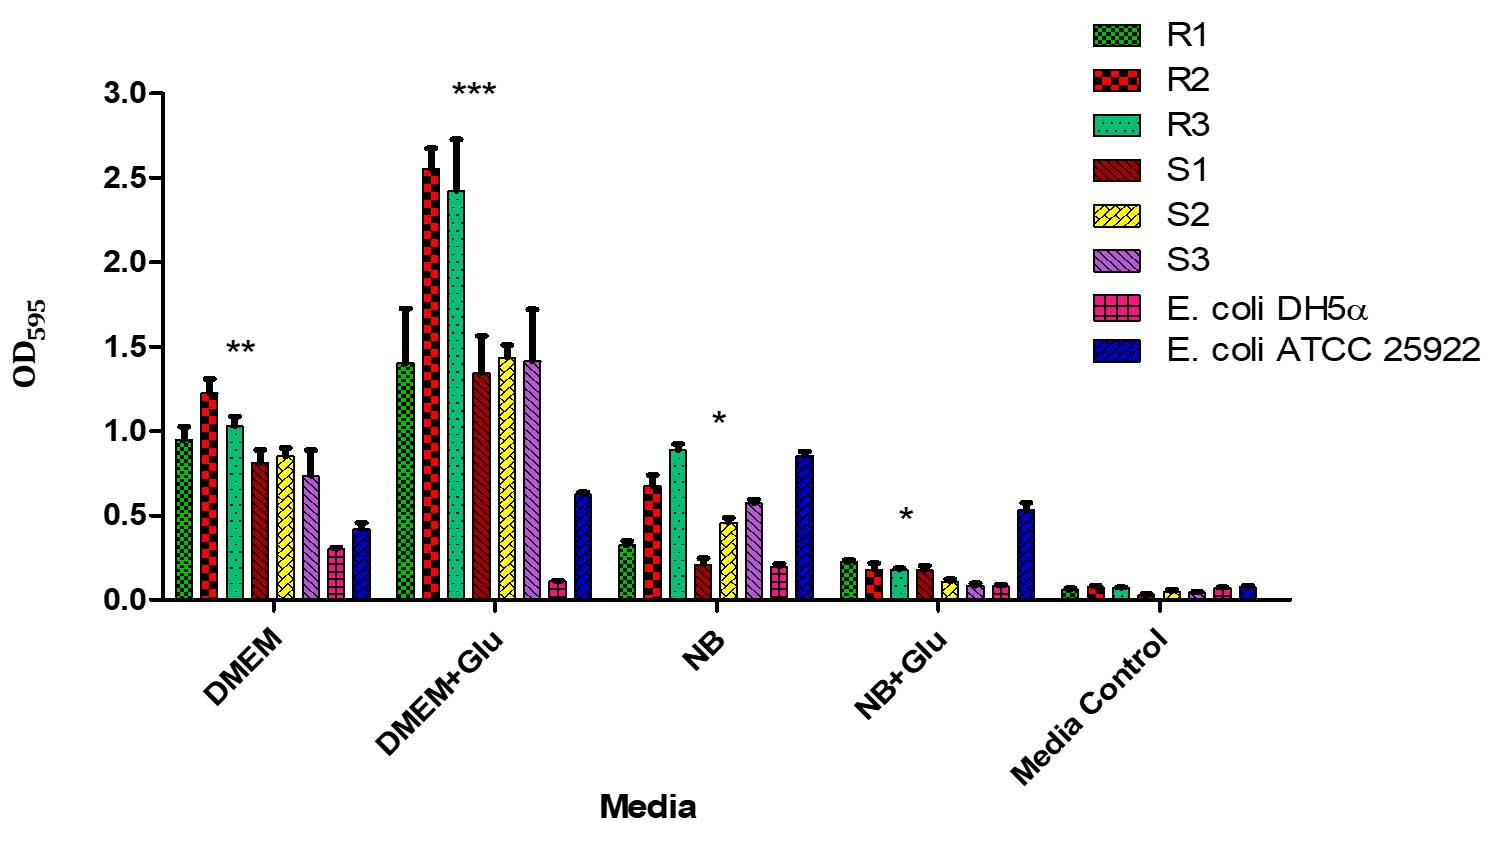
Figure 7. Biofilm formation by MDR and non-MDR EAEC isolates in different media. The graph shows biofilm formation in Dulbecco’s Modified Eagle Medium (DMEM), DMEM supplemented with D-glucose, Nutrient Broth (NB), NB supplemented with D-glucose, and media control. Each bar represents the mean optical density (OD) at 595 nm, with error bars indicating standard deviations
Different surfaces
Both MDR and non-MDR isolates showed significantly higher biofilm formation on polystyrene and stainless-steel surfaces (p < 0.001) compared to their respective controls. However, all isolates showed limited biofilm production (p > 0.001) on glass surfaces (Figure 8).
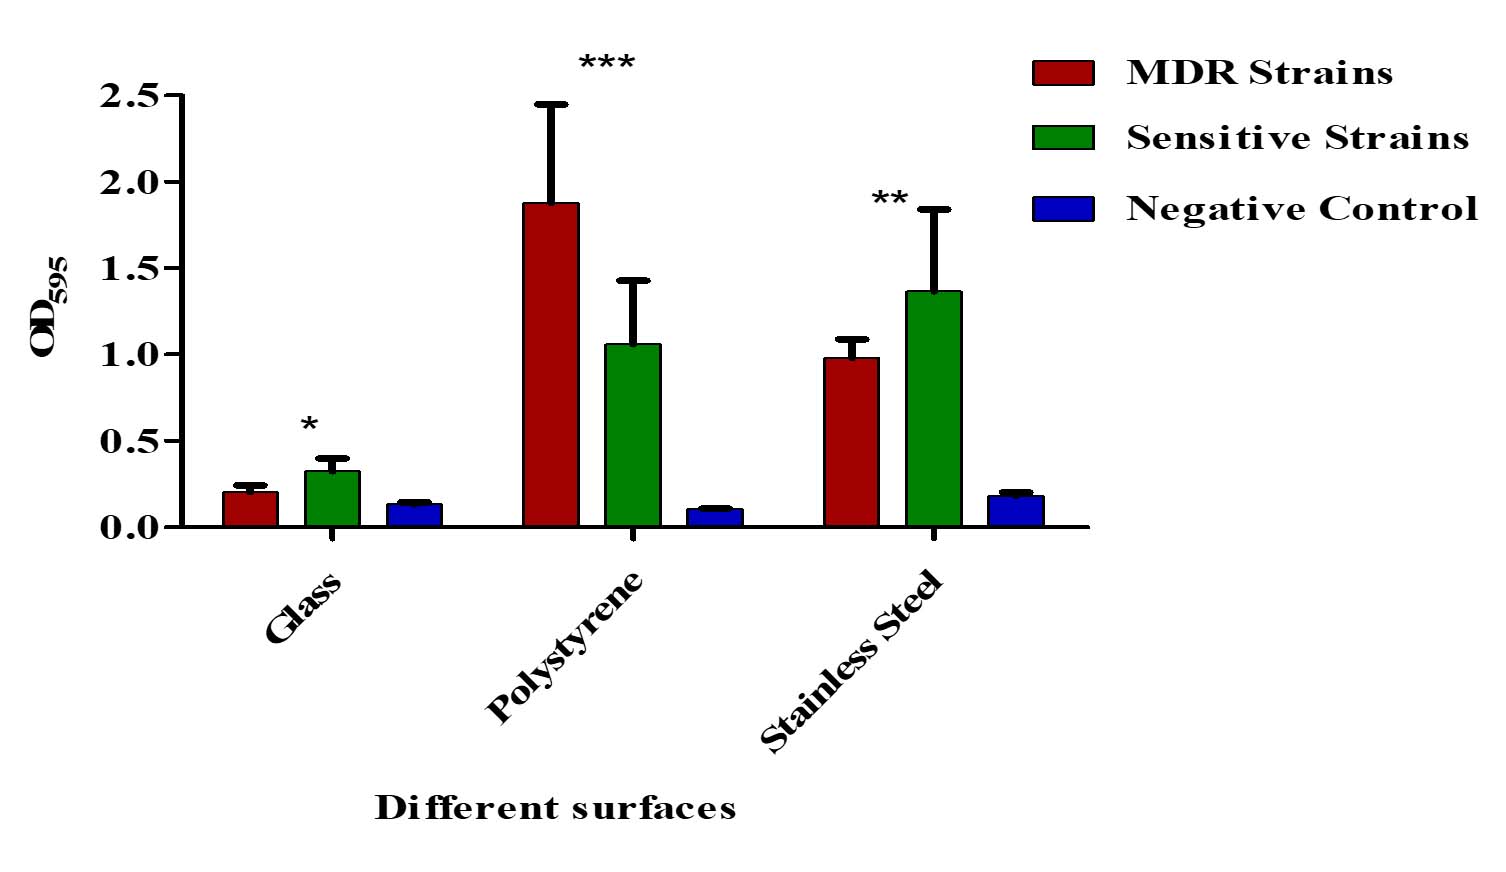
Figure 8. Biofilm formation on different surfaces by MDR and non-MDR EAEC isolates. Biofilm levels were assessed on polystyrene, glass, and stainless-steel surfaces by measuring optical density at 595 nm. MDR isolates showed significantly higher biofilm formation compared to non-MDR isolates across all surface types (p < 0.001). Error bars represent standard deviations
Sugar-dependent biofilms in EAEC strains
Live/dead staining of biofilm formed by all test strains (supplemented with glucose) was employed by confocal microscopy to assess the quantitative biofilm-forming ability at 24 and 48 h (Figure 9A). Bio-volumes of live (green) and dead (red) bacteria were quantified from the image stacks, with background correction applied using ImageJ software. Proportions of live and dead cells were visualized as an intensity histogram (Figure 9B) and analysed by their red-to-green fluorescence ratio (Figure 9C). Notably, all MDR and non-MDR strains produced robust biofilms (p < 0.001) when grown in DMEM supplemented with 0.45% D-glucose.
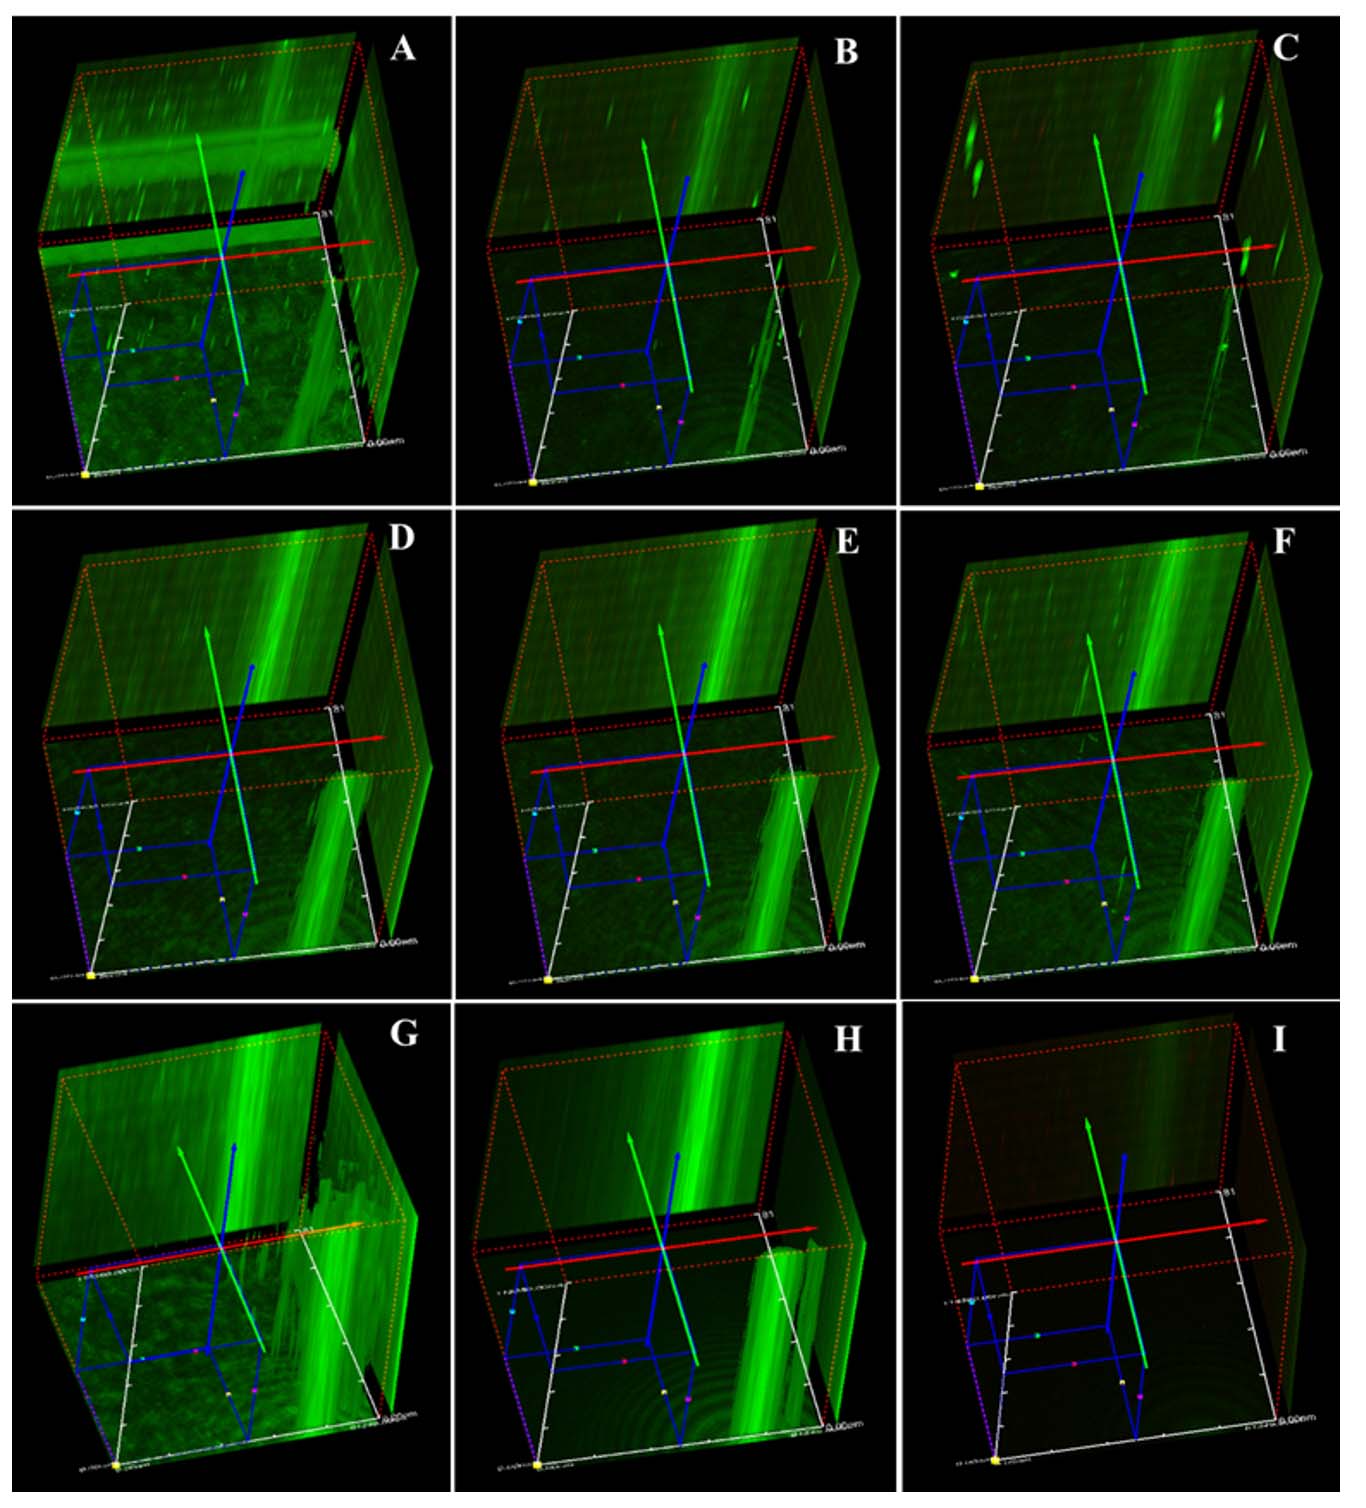
Figure 9A. Biofilm formation of MDR and non-MDR EAEC isolates at 48 hours in glucose-supplemented medium visualized by confocal microscopy. Live bacteria appear green, while dead bacteria are shown in red. (A-C) MDR strains (R1-R3), and (D-F) non-MDR strains (S1-S3), (G and H) control strains (E. coli ATCC 25922 and DH5α), (I) the negative control
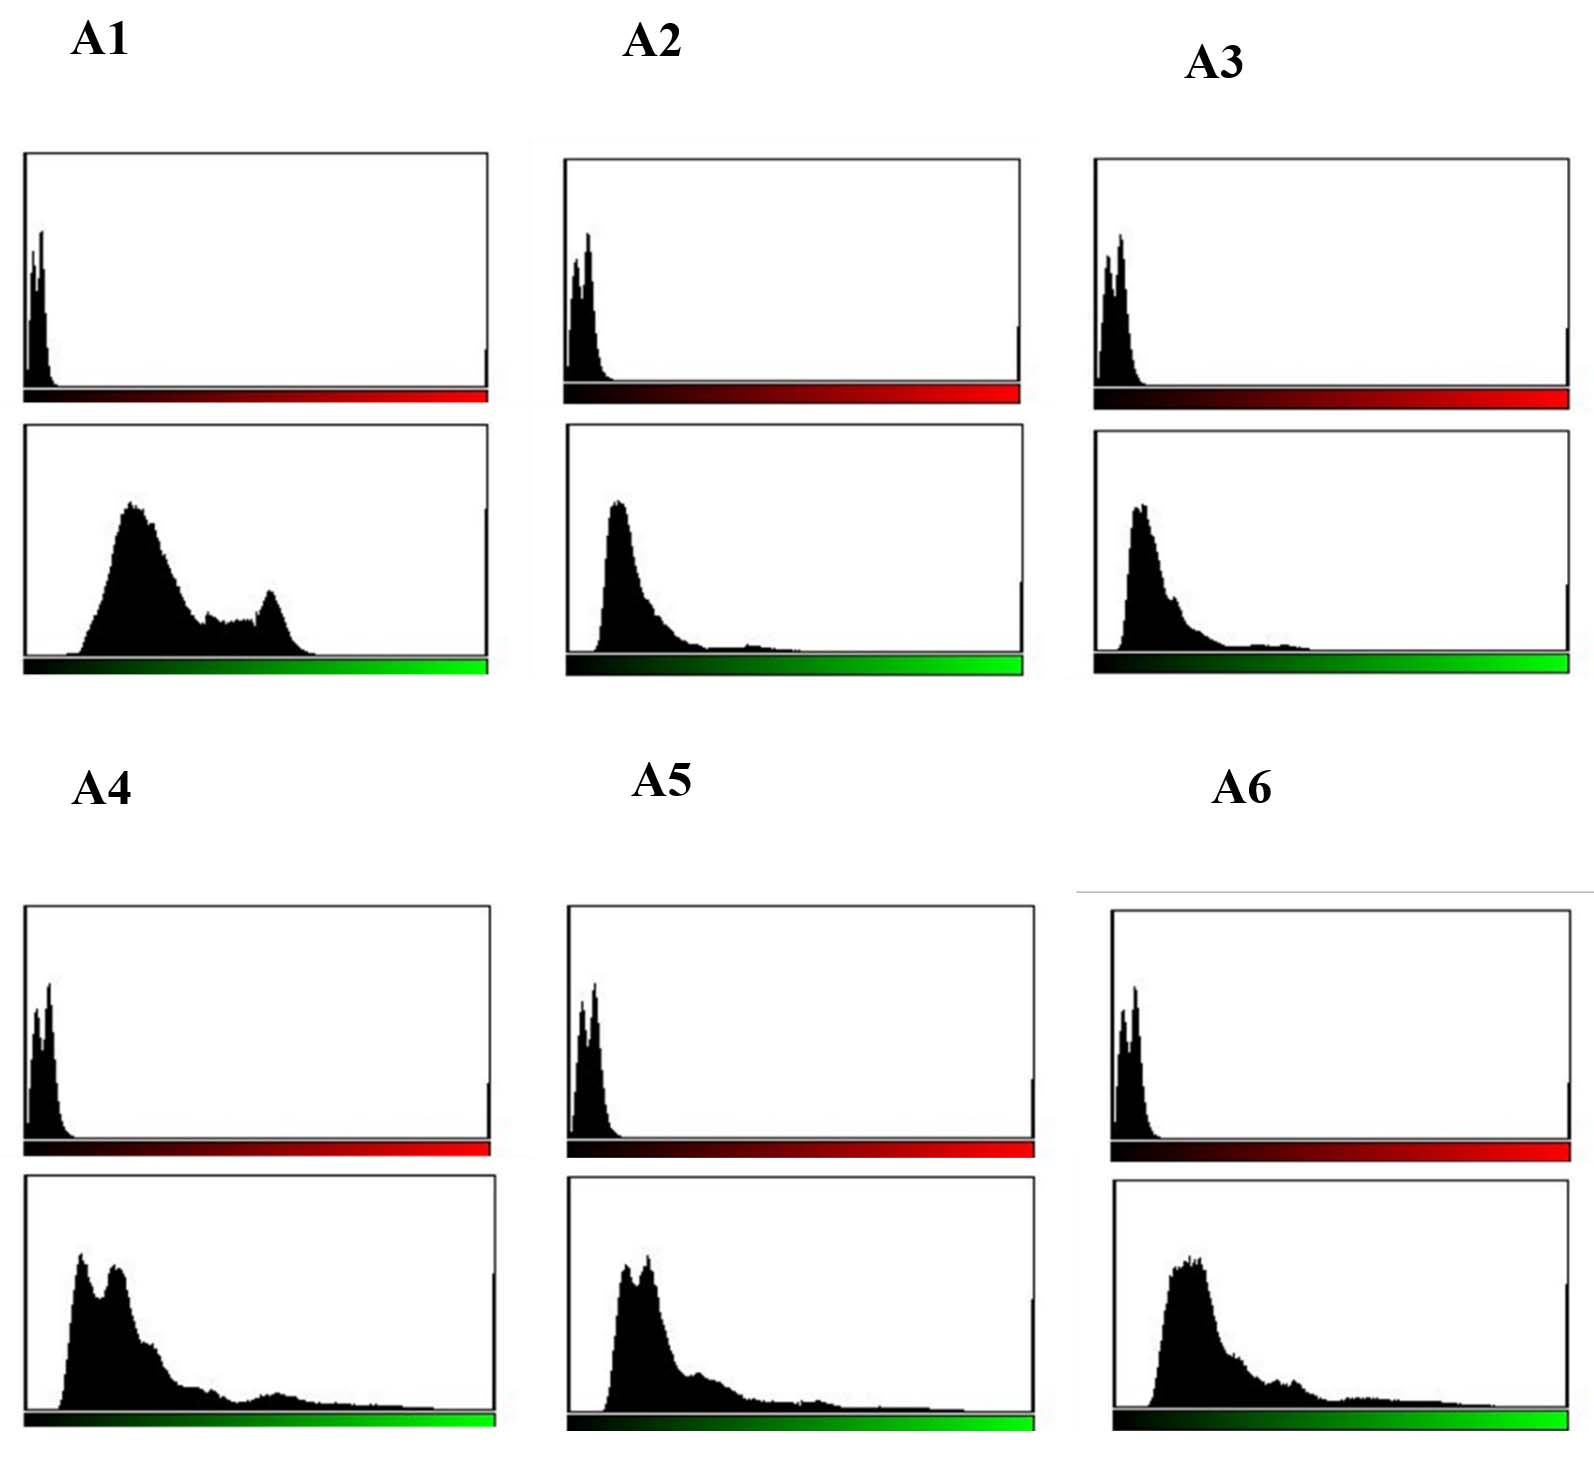
Figure 9B. Quantitative assessment of biofilm formation by MDR and non-MDR EAEC isolates in the presence of glucose at 24 hours using confocal microscopy. Green intensity bars represent live bacteria, while red intensity bars indicate dead bacteria. (A1-A3) correspond to MDR isolates (R1-R3), and (A4-A6) correspond to non-MDR isolates (S1-S3)
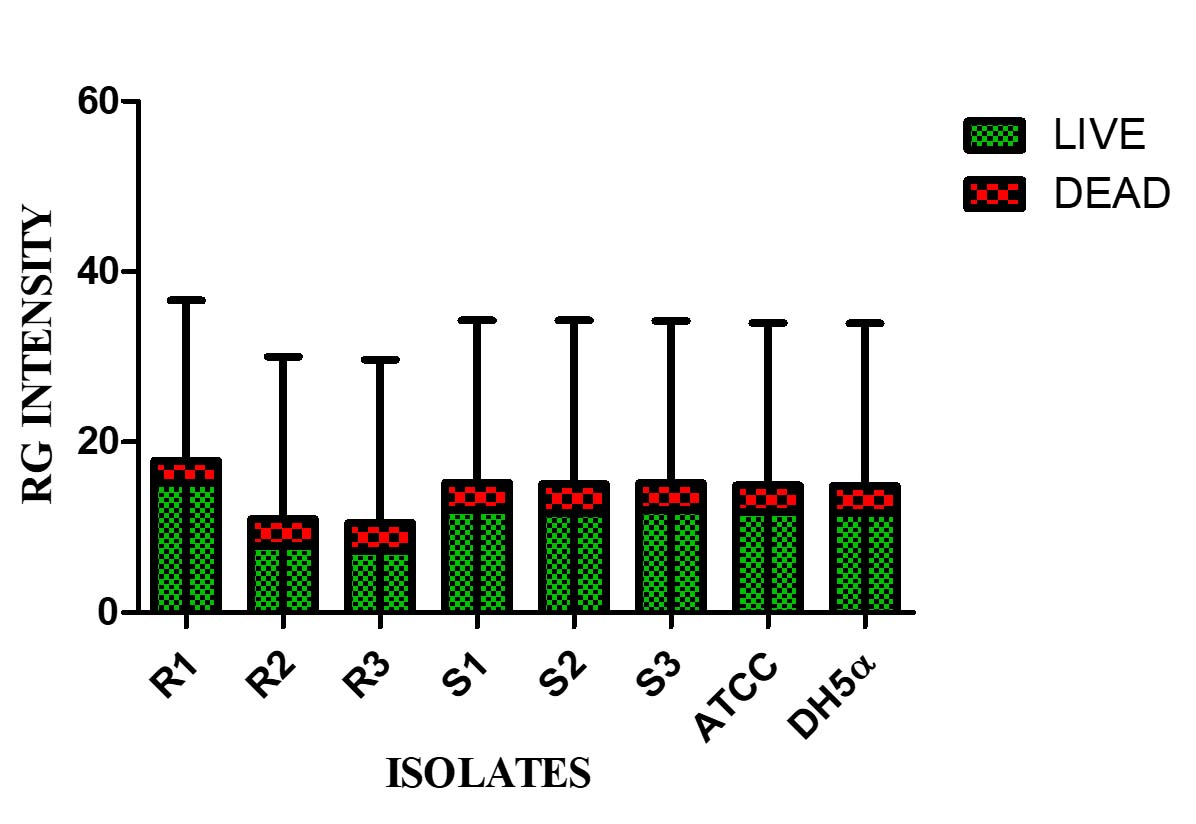
Figure 9C. Red-Green intensity plot of biofilm formation by MDR and non-MDR EAEC isolates in the presence of glucose at 24 hours, visualized via confocal microscopy. Green intensity bars indicate live bacteria, while red intensity bars represent dead bacteria. The plot reflects comparative viability within biofilms formed by MDR and non-MDR strains
Survival Analysis of G. mellonella
When treated with both MDR and non-MDR strains, the larval groups died within 12 hours. However, larval mortality was greater in groups given MDR strains than in those given non-MDR strains (Figure 10) which highlights the possible influence of drug resistance on virulence and pathogenicity.
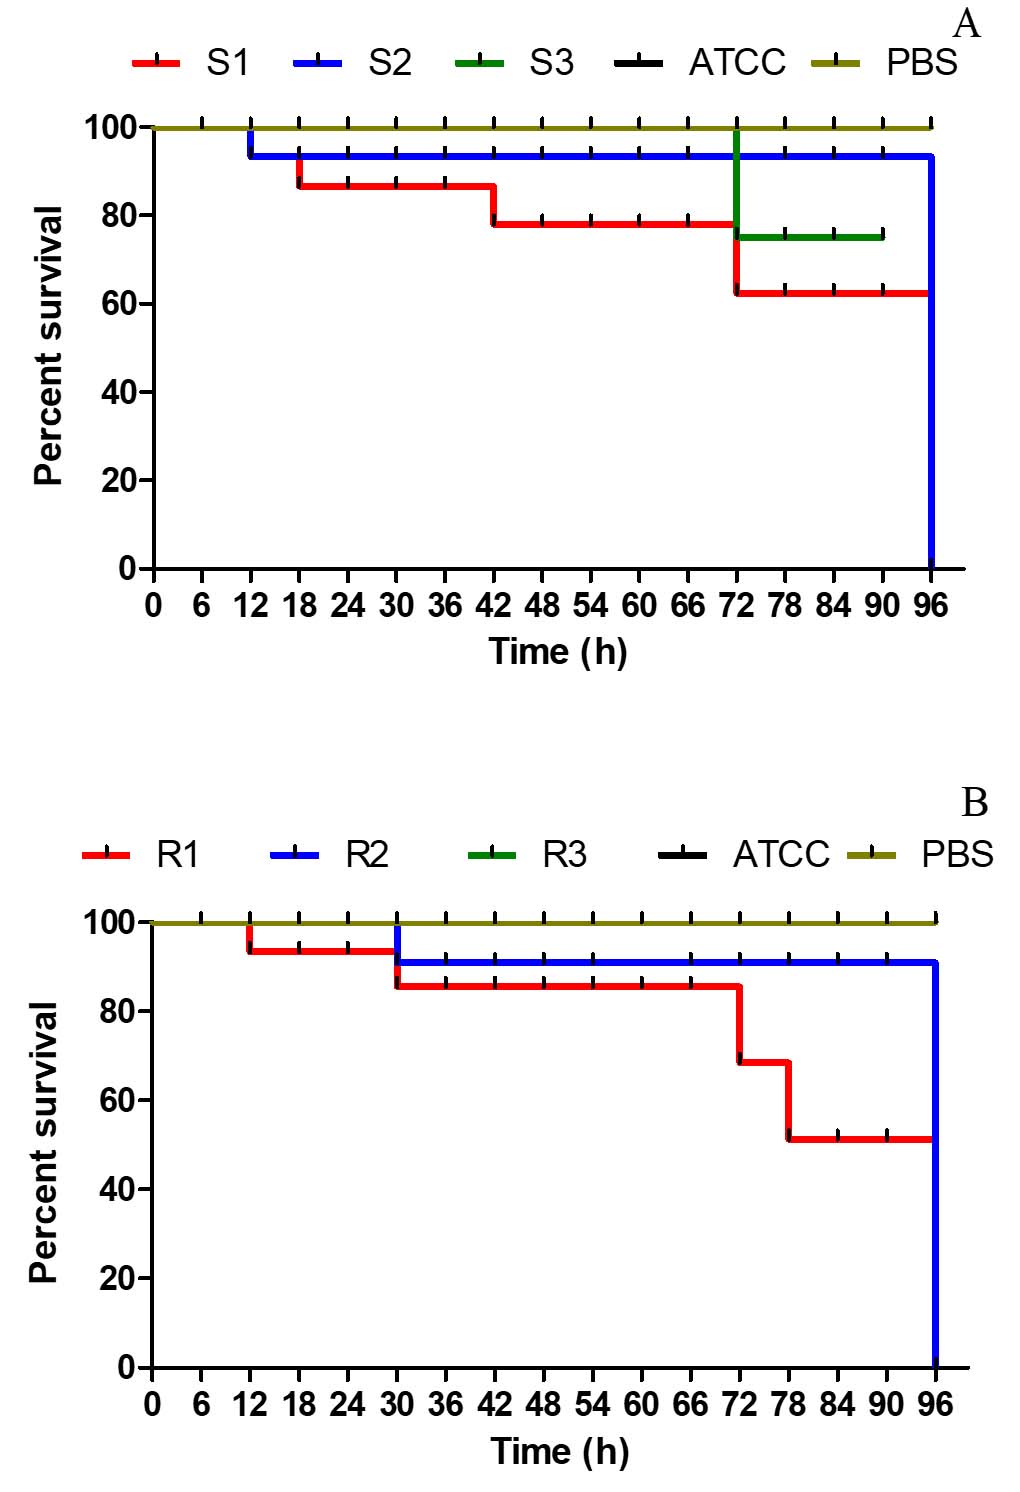
Figure 10. Kaplan–Meier survival curves for Galleria mellonella larvae infected with EAEC strains. (A) Larvae infected with non-MDR EAEC strains; (B) Larvae infected with MDR EAEC strains at a dose of 1×10⁷ CFU mL-1. Control groups included larvae injected with PBS and E. coli ATCC 25922. Survival was monitored over time, and differences between groups were statistically evaluated using the log-rank test to assess the impact of multidrug-resistance on virulence
The worldwide spread of antibiotic-resistant bacteria poses a significant threat, jeopardizing the advancements achieved in recent years and pushing us towards a scenario reminiscent of the pre-antibiotic era.40 Microorganisms colonizing the human gastrointestinal tract must endure diverse stressors ranging from extreme pH shifts and low oxygen tension to nutrient limitation and increased osmolarity.41 The aggR transcriptional regulator orchestrates the expression of both plasmid-encoded and chromosomal virulence determinants in EAEC.42 In our collection of ‘typical’ EAEC isolates, all strains exhibited the characteristic stacked-brick adherence pattern on HEp-2 cells and possessed the aggR gene. Thus, when predicting potential EAEC isolates based on genotype, strains that are aggR-positive and contain genes encoding AAF can be expected to demonstrate the stacked-brick aggregative adherence phenotype consistent with the defining features of EAEC.9 Extended-spectrum β-lactamase (ESBL)-producing bacteria frequently display resistance not only to β-lactam antibiotics but also to multiple other antimicrobial classes, such as fluoroquinolones, tetracyclines, and sulfonamides. These resistant strains generally produce variants of CTX-M, TEM, or SHV enzymes. The widespread detection of such isolates in environmental samples highlights the environment as an important reservoir of ESBL-producing organisms.7 Furthermore, the multidrug-resistant EAEC strains examined in this study were confirmed to produce extended-spectrum β-lactamases through nitrocefin assays, double-disc synergy tests, and PCR analysis.43 These findings highlight a growing propensity for EAEC to resist frontline empiric treatments, notably fluoroquinolones and β-lactam antibiotics.44
Different strains of bacteria have devised strategies to survive even in acidic cytoplasm using acid-resistant systems.45 It has been proven that microbial intracellular pH would be prevented even below the threshold level for ensuring its viability and thereby protect from acid stress. The acid stress could be overcome either by way of decarboxylation, the release of neutralizing compounds, or by way of a proton efflux pump mediated by F1FO-ATPase.46 In the study, the test EAEC strains exhibited no further bacterial growth after 3 hours at pH 3.0. Therefore, in acidic environments, bacterial growth may be hindered because cells lack the energy required to expel protons across the membrane and maintain the proton motive gradient. 46,47 Furthermore, a gradual increase in the bacterial growth pattern at neutral and alkaline pH levels (7.40 and 9.0). This observation aligns with previous findings reported by Rousk et al.48 Reactive oxygen species are central to the host’s defense against bacterial invaders,49 and hydrogen peroxide (H2O2) functions as a key antimicrobial effector in these host-pathogen interactions. However, the accumulation of H2O2 to high levels can be toxic to both the host and the microbe.50,51 H2O2 in this study was found to inhibit bacterial growth irrespective of MDR as well as non-MDR strains. This declining growth pattern could be extrapolated within in vivo living systems to ward off the invading microbial pathogens via respiratory burst characterized by the increased production of ROS, particularly H2O2.49,51 Bile salts serve often as signalling molecules that provide nutrients as well as electron acceptors with intestinal bacterial flora. Moreover, bile salts can function as antibacterial compounds that could act on the bacterial membrane, proteins, and nucleic acids and further could chelate the divalent cations such as iron and calcium. Bacteria adapted to the mammalian gut can withstand the antimicrobial action of bile salts,52 which likely explains the enhanced growth of both MDR and non-MDR EAEC in its presence. Because bile salts are more effective against Gram-positive organisms, their impact on these Gram-negative EAEC strains is minimal.53,54
Biofilms are crucial in the pathophysiology and clinical progression of various infectious diseases, facilitating the establishment of multidrug-resistant organisms (MDROs) and contributing to treatment failure.55 By acting as both a physical and biochemical barrier, biofilms hinder the penetration of antimicrobial agents and reduce the effectiveness of host immune responses, thereby promoting microbial persistence and resistance.56 When grown in standard DMEM and in DMEM supplemented with D-mannose or D-glucose, both MDR and non-MDR EAEC isolates formed robust biofilms (p < 0.001). Conversely, nutrient broth enriched with the same sugars did not support substantial biofilm development (p > 0.001). These results indicate that the growth medium composition significantly influences biofilm formation in EAEC. EAEC is distinguished by its aggregative adherence pattern and strong biofilm-forming ability. The aggregative adherence fimbriae (AAF) play a crucial role in mediating attachment to epithelial cells and various surfaces, thereby facilitating biofilm development.21 Previous studies have highlighted the concentration-dependent effects of glucose on biofilm development. Cerca and Jefferson57 reported maximal biofilm volumes at a glucose concentration of 1 g L-1, while Moreira et al.58 observed reduced biofilm formation at 0.5 g L-1. In the present study, DMEM supplemented with 0.45% D-glucose significantly enhanced biofilm production in all EAEC isolates (p < 0.001), underscoring the role of specific sugars as biofilm-promoting factors that may enhance virulence and ecological fitness. Surface material also influenced biofilm formation: all EAEC strains formed significantly denser biofilms on polystyrene and stainless steel (p < 0.001), but exhibited minimal adherence and biofilm production on glass surfaces (p > 0.001). This is consistent with the findings of Weiss-Muszkat et al.,59 who reported robust biofilm formation by enteropathogenic E. coli (EPEC) on polystyrene, suggesting potential adaptive mechanisms for colonization. Hernandes et al.60 further highlighted the role of type I fimbriae in facilitating EPEC biofilm formation on abiotic surfaces. Comparative studies across species have yielded varied results regarding the association among antibiotic resistance and biofilm development. Abidi et al.61 demonstrated significantly enhanced biofilm production in MDR Pseudomonas aeruginosa isolates, whereas Eyoh et al.62 found no significant difference between MDR and non-MDR Staphylococcus aureus. Similarly, studies on Acinetobacter baumannii have been inconclusive: while Gurung et al.63 observed a positive correlation between biofilm formation and resistance among 60 isolates, Perez64 reported an inverse relationship between meropenem resistance and biofilm formation in 116 isolates. These studies underline the influence of environmental factors, surface type, and carbon source availability particularly simple sugars on biofilm formation in EAEC strains. As noted by
Ganzle and Follador,65 carbohydrate metabolism is vital for the ecological success of bacteria, helping them persist in diverse environments. Biofilm formation represents a highly effective survival strategy employed by bacteria to withstand antibiotic exposure, offering protection against antimicrobial agents and facilitating persistent infections.66
G. mellonella larvae are increasingly employed as infection models to evaluate the pathogenic potential of Gram-positive and Gram-negative bacteria, as well as various pathogenic fungi.27 The larval groups showed mortality from 12 h post-infection with both MDR and non-MDR EAEC strains, with higher mortality in MDR-EAEC groups, highlighting the impact of drug resistance on EAEC virulence. The association between virulence and multidrug-resistance in bacterial strains is often attributed to the co-selection of resistance and virulence traits. The most straightforward way to assess infection in G. mellonella larvae is by monitoring changes in their external appearance. Healthy larvae exhibit a cream-colored body, whereas infected individuals gradually change to a light brown hue that darkens progressively, turning nearly black upon death.27 Research indicates that multidrug-resistant strains often harbor extra virulence determinants, which are frequently acquired via horizontal gene transfer or mobile genetic elements.67,68 This simultaneous transmission of drug resistance and virulence determinants can lead to the development of MDR strains with enhanced virulence capabilities. The co-existence of MDR and heightened virulence highlights the need to consider both aspects in understanding and addressing bacterial infections.67,69
The study highlighted the significant resilience and enhanced pathogenic potential of MDR-EAEC under various physicochemical stress conditions. MDR-EAEC strains exhibited superior survival capabilities and enhanced biofilm formation compared to their non-MDR counterparts, particularly under stressors like acidic pH, which significantly inhibited bacterial growth. Conversely, neutral and alkaline conditions facilitated robust growth of both MDR and non-MDR strains. Biofilm formation assays indicated that MDR-EAEC strains were more resilient in establishing biofilms on diverse surfaces in the presence of sugar. Additionally, the Galleria mellonella model revealed the enhanced virulence of MDR-EAEC strains, as evidenced by higher mortality rates in the infected larvae. The findings emphasize the urgent need for targeted strategies against antimicrobial resistance, focusing on disrupting biofilm formation and improving treatment efficacy against resilient MDR pathogens.
ACKNOWLEDGMENTS
The authors express their gratitude to the ICAR-Indian Veterinary Research Institute, Izatnagar, Director for facilities, Dr. Deepa Ujjawal for technical support, Dr. Chobi Debroy and Bhushan Jayarao, Pennsylvania State University, PA, United States for providing EAEC DNA, Dr. Indira Devi (Director, Research) and Gavas Ragesh (Assistant Professor) at KAU (Kerala Agricultural University) in Thrissur, Kerala, for supplying G. mellonella larvae for our research are sincerely acknowledged.
CONFLICT OF INTEREST
The authors declare that there is no conflict of interest.
AUTHORS’ CONTRIBUTION
All authors listed have made a substantial, direct and intellectual contribution to the work, and approved it for publication.
FUNDING
None.
DATA AVAILABILITY
The datasets generated and/or analysed during the current study are available from the corresponding author on reasonable request.
ETHICS STATEMENT
Not applicable.
- Tang KWK, Millar BC, Moore JE. Antimicrobial resistance (AMR). British J Biomed Sci. 2023;80:11387.
Crossref - Bertagnolio S, Suthar AB, Tosas O, Van Weezenbeek K. Antimicrobial resistance: Strengthening surveillance for public health action. PLoS Medi. 2023;20(7):e1004265.
Crossref - Verma S, Verma S, Abbas M, Mahdi F. Combating the antimicrobial resistance by personalized medicine: a mini-review. Era’s J Med Res. 2023;10(1):88-92.
Crossref - Salam MA, Al-Amin MY, Salam MT, et al. Antimicrobial resistance: a growing serious threat for global public health. Healthcare. 2023;11(13):1946.
Crossref - Patel J, Harant A, Fernandes G, et al. Measuring the global response to antimicrobial resistance, 2020–21: a systematic governance analysis of 114 countries. Lancet Infect Dis. 2023;23(6):706-718.
Crossref - Hou J, Long X, Wang X, et al. Global trend of antimicrobial resistance in common bacterial pathogens in response to antibiotic consumption. J Hazard Mater. 2023;442:130042.
Crossref - Nasrollahian S, Graham JP, Halaji M. A review of the mechanisms that confer antibiotic resistance in pathotypes of E. coli. Front Cell Infect Microbiol. 2024;14:1387497.
Crossref - Geurtsen J, de Been M, Weerdenburg E, Zomer A, McNally A, Poolman J. Genomics and pathotypes of the many faces of Escherichia coli. FEMS Microbiol Rev. 2022;46(6):fuac031.
Crossref - Van Nederveen V, Melton-Celsa AR. Enteroaggregative Escherichia coli (EAEC). EcoSal Plus. 2025:eesp-0011.
Crossref - Berry AA, Velarde JJ, Nataro JP. Diarrhea-causing and dysentery-causing Escherichia coli. In Feigin RD, Cherry JD, Demmler-harrison GJ, Kaplan SL. (eds). Feigin and Cherry’s Textbook of Pediatric Infectious Diseases. Saunders Elsevier Inc. 2009:1525-1540.
Crossref - Boisen N, Osterlund MT, Joensen KG, et al. Redefining enteroaggregative Escherichia coli (EAEC): Genomic characterization of epidemiological EAEC strains. PLoS Negl Trop Dis. 2020;14(9):e0008613.
Crossref - Murray CJ, Ikuta KS, Sharara F, et al. Global burden of bacterial antimicrobial resistance in 2019: a systematic analysis. Lancet. 2022;399(10325):629-55.
Crossref - Zhang J, Wang J, Jin J, et al. Prevalence, antibiotic resistance, and enterotoxin genes of Staphylococcus aureus isolated from milk and dairy products worldwide: A systematic review and meta-analysis. Food Res Int. 2022;162:111969.
Crossref - Peterson E, Kaur P. Antibiotic resistance mechanisms in bacteria: relationships between resistance determinants of antibiotic producers, environmental bacteria, and clinical pathogens. Front Microbiol. 2018;9:2928.
Crossref - Boor KJ. Bacterial stress responses: what doesn’t kill them can make them stronger. PLoS Biol. 2006;4(1):e23.
Crossref - Choudhary GK, Nirala RK, Kumar N, et al. Reactive oxygen nitrogen species and antioxidant. J Vet Pharmacol Toxicol. 2023;22(1):1-7.
- Abdelwahed EK, Hussein NA, Moustafa A, Moneib NA, Aziz RK. Gene networks and pathways involved in Escherichia coli response to multiple stressors. Microorganisms. 2022 Sep 6;10(9):1793.
Crossref - Teteneva NA, Mart’yanov SV, Esteban-Lopez M, et al. Multiple drug-induced stress responses inhibit formation of Escherichia coli biofilms. Appl Environ Microbiol. 2020;86(21):e01113-20.
Crossref - Bowlin MQ, Gray MJ. Tagging Polyphosphate Kinase Alters Enzymatic Activity and Affect Stress Recovery in E. coli. FASEB Journal. 2022;36(S1).
Crossref - Qi L, Li H, Zhang C, et al. Relationship between antibiotic resistance, biofilm formation, and biofilm-specific resistance in Acinetobacter baumannii. Front Microbiol. 2016;7:483.
Crossref - Van Nederveen V, Melton-Celsa A. Extracellular components in enteroaggregative Escherichia coli biofilm and impact of treatment with proteinase K, DNase or sodium metaperiodate. Front Cell Infect Microbiol. 2024;14:1379206.
Crossref - McDougald D, Rice SA, Barraud N, Steinberg PD, Kjelleberg S. Should we stay or should we go: mechanisms and ecological consequences for biofilm dispersal. Nat Rev Microbiol. 2012;10(1):39-50.
Crossref - Hoyle BD, Costerton JW. Bacterial resistance to antibiotics: the role of biofilms. In: Jucker E, ed. Progress in Drug Research / Fortschritte der Arzneimittelforschung / Progrès des recherches pharmaceutiques. Vol 37. Basel, Switzerland: Birkhäuser Basel; 1991: 91-105.
Crossref - Cerqueira GM, Peleg AY. Insights into Acinetobacter baumannii pathogenicity. IUBMB life. 2011;63(12):1055-1060.
Crossref - Hoffman LR, D’Argenio DA, MacCoss MJ, Zhang Z, Jones RA, Miller SI. Aminoglycoside antibiotics induce bacterial biofilm formation. Nature. 2005;436(7054):1171-5.
Crossref - Kaplan JB. Antibiotic-induced biofilm formation. Int J Artificial Organs. 2011;34(9):737-751.
Crossref - Villani S, Calcagnile M, Demitri C, Alifano P. Galleria mellonella (greater wax moth) as a reliable animal model to study the efficacy of nanomaterials in fighting pathogens. Nanomaterials. 2025;15(1):67.
Crossref - Vergis J, Malik SV, Pathak R, et al. Exploring Galleria mellonella larval model to evaluate antibacterial efficacy of Cecropin A (1-7)-Melittin against multi-drug resistant enteroaggregative Escherichia coli. Pathog Dis. 2021;79(3):ftab010.
Crossref - Menard G, Rouillon A, Cattoir V, Donnio PY. Galleria mellonella as a suitable model of bacterial infection: past, present and future. Front Cell Infect Microbiol. 2021;11:782733.
Crossref - Monfardini MV, Souza RT, Rojas TCG, Guerrieri CG, Orikaza C, Scaletsky IC. Transposon mutagenesis of atypical enteroaggregative Escherichia coli reveals a hemagglutinin-associated protein that mediates cell adhesion and contributes to the Galleria mellonella virulence. Front Cell Infect Microbiol. 2023;13:1166158.
Crossref - Vazquez NM, Mariani F, Torres PS, Moreno S, Galvan EM. Cell death and biomass reduction in biofilms of multidrug resistant extended spectrum β-lactamase-producing uropathogenic Escherichia coli isolates by 1, 8-cineole. PLoS One. 2020;15(11):e0241978.
Crossref - Hajiagha MN, Kafil HS. Efflux pumps and microbial biofilm formation. Infect Genet Evol. 2023;112:105459.
Crossref - Pathak R, Vergis J, Chouhan G, et al. Comparative efficiency of carbohydrates on the biofilm forming ability of enteroaggregative Escherichia coli. Journal of Food Safety. 2022;42(3):e12971.
Crossref - Brenner DJ, Krieg NR, Staley JT, Garrity GM, Boone DR, Vos P, Goodfellow M, Rainey FA, Schleifer KH, eds. Bergey’s Manual® of Systematic Bacteriology: Volume 2: The Proteobacteria, Part B: The Gammaproteobacteria. 2nd ed. New York, NY: Springer; 2005.
Crossref - Miqdady MS, Jiang ZD, Nataro JP, DuPont HL. Detection of enteroaggregative Escherichia coli with formalin-preserved HEp-2 cells. J Clini Microbiol. 2002;40(8):3066-3067.
Crossref - Bauer AW, Kirby WMM, Sherris JC, Turck MD. Antibiotic susceptibility testing by a standardized single disk method. Am J Clin Pathol. 1966;45(4_ts):493-6.
Crossref - Chantell C, Humphries RM, Lewis J. Fluoroquinolone breakpoints for Enterobacteriaceae and Pseudomonas aeruginosa. CLSI rationale document MR02. Clinical and Laboratory Standards Institute, Wayne, PA. 2019 Feb.
- Naves P, del Prado G, Huelves L, et al. Correlation between virulence factors and in vitro biofilm formation by Escherichia coli strains. Microb Pathogen. 2008;45(2):86-91.
Crossref - Schindelin J, Arganda-Carreras I, Frise E, et al. Fiji: an open-source platform for biological-image analysis. Nat Methods. 2012;9(7):676-682.
Crossref - Watkins RR, Bonomo RA. Overview: global and local impact of antibiotic resistance. Infect Dis Clin. 2016;30(2):313-322.
Crossref - Chowdhury R, Sahu GK, Das J. Stress response in pathogenic bacteria. J Biosci. 1996;21:149-60.
Crossref - Guerrieri CG, Pereira MF, Galdino AC, et al. Typical and atypical enteroaggregative Escherichia coli are both virulent in the Galleria mellonella model. Front microbiol. 2019;10:1791.
Crossref - Vergis J, Pathak R, Kumar M, et al. A comparative study for detection of extended spectrum β-lactamase (ESBL) production by Enteroaggregative Escherichia coli (EAEC) strains using double disc, nitrocefin and PCR assays. J Microbiol Methods. 2018;151:57-61.
Crossref - Kong H, Hong X, Li X. Current perspectivesin pathogenesis and antimicrobial resistance of enteroaggregative Escherichia coli. Microbial Pathogen. 2015;85:44-49.
Crossref - Kobayashi H, Saito H, Kakegawa T. Bacterial strategies to inhabit acidic environments. J Gen Appl Microbiol. 2000;46(5):235-243.
Crossref - Lund PA, De Biase D, Liran O, et ak. Understanding how microorganisms respond to acid pH is central to their control and successful exploitation. Front Microbiol. 2020;11:556140.
Crossref - Sanchez-Clemente R, Igeno MI, Poblacion AG, Guijo MI, Merchan F, Blasco R. Study of pH changes in media during bacterial growth of several environmental strains. Proceedings. 2018;2(20):1297.
Crossref - Rousk J, Brookes PC, Baath E. Contrasting soil pH effects on fungal and bacterial growth suggest functional redundancy in carbon mineralization. Appl Environ Microbiol. 2009;75(6):1589-1596.
Crossref - Mishra S, Imlay J. Why do bacteria use so many enzymes to scavenge hydrogen peroxide? Arch Biochem Biophys. 2012;525(2):145-160.
Crossref - Hyslop PA, Zhang Z, Pearson DV, Phebus LA. Measurement of striatal H2O2 by microdialysis following global forebrain ischemia and reperfusion in the rat: correlation with the cytotoxic potential of H2O2 in vitro. Brain Res. 1995;671(2):181-6.
Crossref - Labas MD, Zalazar CS, Brandi RJ, Cassano AE. Reaction kinetics of bacteria disinfection employing hydrogen peroxide. Biochem Eng J. 2008;38(1):78-87.
Crossref - Urdaneta V, Casadesus J. Interactions between bacteria and bile salts in the gastrointestinal and hepatobiliary tracts. Front Med. 2017;4:163.
Crossref - Floch MH, Gershengoren W, Elliott S, Spiro HM. Bile acid inhibition of the intestinal microflora—a function for simple bile acids?. Gastroenterology. 1971;61(2):228-33.
Crossref - Tyagi A, Gupta V, Bhatnagar A. Evaluation of Antibacterial Effects of Bile Salt on Pathogenic Bacteria-An in vitro Study. Int J Curr Microbiol App Sci. 2019;8(10):2430-2436.
Crossref - Singh B, Mehta S, Asare-Amoah J, Appiah Po, Chauhan S, Amponash RD. Biofilm-associated Multidrug Resistant Bacteria Among Burn Wound Infections: A Cross-sectional Study. Mediterr J Infect Microb Antimicrob. 2024;13:24179.
Crossref - Sanchez CJ, Mende K, Beckius ML, et al. Biofilm formation by clinical isolates and the implications in chronic infections. BMC Infect Dis. 2013;13:1-2.
Crossref - Cerca N, Jefferson KK. Effect of growth conditions on poly-N-acetylglucosamine expression and biofilm formation in Escherichia coli. FEMS Microbiol Lett. 2008;283(1):36-41.
Crossref - Moreira JM, Gomes LC, Araujo JD, et al. The effect of glucose concentration and shaking conditions on Escherichia coli biofilm formation in microtiter plates. Chem Eng Sci. 2013;94:192-199.
Crossref - Weiss-Muszkat M, Shakh D, Zhou Y, et al. Biofilm formation by and multicellular behavior of Escherichia coli O55: H7, an atypical enteropathogenic strain. Appl Environ Microbiol. 2010;76(5):1545-1554.
Crossref - Hernandes RT, De la Cruz MA, Yamamoto D, Giron JA, Gomes TA. Dissection of the role of pili and type 2 and 3 secretion systems in adherence and biofilm formation of an atypical enteropathogenic Escherichia coli strain. Infect Immun. 2013;81(10):3793-802.
Crossref - Abidi SH, Sherwani SK, Siddiqui TR, Bashir A, Kazmi SU. Drug resistance profile and biofilm forming potential of Pseudomonas aeruginosa isolated from contact lenses in Karachi-Pakistan. BMC Ophthalmol. 2013;13:57.
Crossref - Eyoh AB, Toukam M, Atashili J, et al. Relationship between multiple drug resistance and biofilm formation in Staphylococcus aureus isolated from medical and non-medical personnel in Yaounde, Cameroon. Pan Afr Med J. 2014;17:186.
Crossref - Gurung J, Khyriem AB, Banik A, Lyngdoh WV, Choudhury B, Bhattacharyya P. Association of biofilm production with multidrug resistance among clinical isolates of Acinetobacter baumannii and Pseudomonas aeruginosa from intensive care unit. Indian J Crit Care Med. 2013;17(4):214-218.
Crossref - Perez LRR. Acinetobacter baumannii displays inverse relationship between meropenem resistance and biofilm production. J Chemother. 2015;27(1):13-16.
Crossref - Ganzle MG, Follador R. Metabolism of oligosaccharides and starch in lactobacilli: a review. Front Microbiol. 2012;3:340.
Crossref - Hall-Stoodley L, Costerton JW, Stoodley P. Bacterial biofilms: from the natural environment to infectious diseases. Nat Rev Microbiol. 2004;2(2):95-108.
Crossref - Deng M, Zhu MH, Li JJ, et al. Molecular epidemiology and mechanisms of tigecycline resistance in clinical isolates of Acinetobacter baumannii from a Chinese university hospital. Antimicrob Agents Chemother. 2014;58(1):297-303.
Crossref - Jelic M, Skrlin J, Bejuk D, et al. Characterization of isolates associated with emergence of OXA-48-producing Klebsiella pneumoniae in Croatia. Microb Drug Resista. 2018;24(7):973-979.
Crossref - Jiang W, Yang W, Zhao X, Wang N, Ren H. Klebsiella pneumoniae presents antimicrobial drug resistance for β-lactam through the ESBL/PBP signaling pathway. Exp Ther Med. 2020;19(4):2449-2456.
Crossref
© The Author(s) 2026. Open Access. This article is distributed under the terms of the Creative Commons Attribution 4.0 International License which permits unrestricted use, sharing, distribution, and reproduction in any medium, provided you give appropriate credit to the original author(s) and the source, provide a link to the Creative Commons license, and indicate if changes were made.