

ISSN: 0973-7510
E-ISSN: 2581-690X
Sixteen bacterial isolates were obtained from insecticide treated tomato, brinjal maize and ground nut rhizospheric soils by enriching Mineral Salt Medium broth with supplement of chlorpyrifos, Phorate source. These isolates were characterized on the basis of cell morphology, cultural and biochemical properties. Among the eight chlorpyrifos degrading bacterial isolates, CDB-1isolate utilized the more pesticide. Among the eight phorate degrading bacterial isolates, the Phorate degrading bacteria (PDB)-1 isolate utilized the pesticide (Phorate) effectively. Degrading efficiency of isolates was determined by measuring the chlorpyrifos, phorate residual concentrations at intervals using Gas chromatographic method. Among the molecular diversity of 16 organophosphorus pesticide degrading isolates viz., chlorpyrifos degrading isolates 8, phorate degrading isolates 8 were also studied by PCR-RAPD technique. CDB7 shows separate lane with 26 per cent similarity compared to other isolates. CDB5 isolate shows 29 percent similar when compared with other samples. CDB3 and CDB4 reveal same genetic relatedness according to dendrogram. CDB2 and CDB6 showed 54 percent similarity and CDB1 shows 41 percent similarity. CDB3 and CDB4 isolates are more or less similar in the genome and functional properties. Whereas, CDB7 isolate was highly diverse among other isolates.. PDB5 and PDB6 showed 55 per cent similar in coefficient scale. Whereas PDB2 and PDB3 revealed 75 per cent relatedness. The other isolates, PDB1, PDB7 and PDB4 shows 64-66 percent similar. The PDB8 was highly diverse from remaining other seven isolates. PDB2 and PDB3 showed similar genome and functional properties.
Organophosphorus degrading bacteria, minimal salt medium, biochemical characterization, pesticide degradation ability, molecular diversity.
Organophosphorus compounds pesticides are degradable. Environmental pollution caused by pesticides and their degradation products is a major ecological problem (Guliy et al, 2003). It has been documented that organophosphorus pesticides (OP) constitute the largest group of pesticides used globally account for about 38% of the total pesticides used worldwide (Singh and walker, 2006). Environment preservation is one of the aims of the sustainable development. Environmental pollution has increased in many regions due to industrialization. In India, alarming levels of pesticides have been reported in air, water, soil as well as in foods and biological materials. The most important pollutants among the toxicants in India are organochlorine and organophosphorus pesticides. Modern agriculture is a capital and technology intensive affair that is highly reliant on extensive chemical inputs in order to enhance the production. Consequently, a huge variety of chemical pesticides are popularly used across the globe for pest control purposes. The wide application of organophosphorous (OP) insecticides such as Chlorpyrifos, phorate, malathion, dichlorvos, are employed for plant protection against insect pests. This organophosphorous pesticide is one of the major chemicals responsible for the contamination and deterioration of soil and groundwater, particularly in the close vicinities of agricultural fields3. Owing to their high toxicity and persistence in the environment, most of them are banned all over the world.
Phorate {O, O-diethyl S-[(ethylthio) methyl] phosphorodithioate} is a highly toxic organo phosphorous insecticide. Structurally it is thioester of phosphoric acid characterized by a central phosphorus atom. It is extensively used in agriculture, ornamental plants and forests to control sucking and chewing insects (Gallo and Lawryk 1991). In India, total production of phorate has been estimated to be 4800 MT. This type of large quantity of production indicates larger area of agri land contamination with phorate. The World Health Organization classifies phorate as an extremely hazardous pesticide; also the food and agriculture organization has banned its usage in the developing countries.
Sample collection
The soil samples were collected from farmers fields of Tomato, brinjal, maize and ground nut Andhra Pradesh, India. The samples were collected in sterilized autoclaved glass bottles and brought to lab, coarsely ground, thoroughly mixed and stored at 4oC in polythene bags before use. Commercial-grade insecticide phorate (10% CG purity) was obtained from pesticide market. It was used throughout the experimental studies, because it may more closely resemble the active compound that microorganisms are likely to be exposed to in the soil environment.
Enrichment and Isolation of Organophosphorus degrading bacterial Strains
Soil samples were collected from chlorpyrifos, phorate treated rhizospheric soils ( Tomato, Brinjal, Maize and Ground nut) and enriched with 50 µg ml-1 of chlorpyrifos, phorate in 10 g of soil mixed with 50 ml MSM broth (gl-1 :KH2PO4 4.8, K2HPO4 : 1.2, NH4NO3 : 1.0 ,MgSO4.7H2O : 0.2 ,Ca (NO3)2.4H2O: 0.04 ,Fe (SO4)3 : 0.001 ,pH : 7.0.) incubated at 37oC with pH 7 on temperature regulated shaking incubator. Make serial dilutions of enriched soil samples ranging from 10-1 to 10-8 were prepared and spread on Luria Bertani agar medium plates. The LB agar plates were incubated at 37oC with pH 7 on incubator.
Characterization of phorate degrading bacteria
The isolated bacteria were studied for their morphological like gram reaction, pigmentation, cultural characteristics and biochemical characteristics like Indole production, methyl red, voges-praskaure’s test, citrate utilization test, oxidase, catalase and sugar fermentation tests (Brenner et al,)
Assessment of molecular diversity of organophosphorus degrading bacteria isolated from different field soils
DNA extraction from bacterial cultures
Genomic DNA was isolated following the method of Ausubel et al. (1999). 5 ml of bacterial culture grown overnight for 16 -18h was centrifuged in a 2ml eppendorff tube for 2min at 4,500 rpm. The pellet was resuspended in 567µl of T10E1 buffer by repeated pipetting. To this suspension 30µl of 10%SDS and 3µl proteinase K (20mg ml-1) were added, mixed well and incubated at 37oC for 1h followed by addition of 100µl of 5M NaCl. To this mixture 80µl of CTAB (10%) and NaCl (0.7 M) solution was added, mixed well and incubated at 65oC for 10 min. Equal volume of Chloroform/IAA (24:1) was added, gently mixed and centrifuged at 8,000 rpm for 10min.The supernatant was taken into a fresh 1.5ml eppendorff tube and the DNA was precipitated with equal volume of chilled isopropanol and kept in refrigerated for 10min.Centrifuged at 10,000 rpm for 10 min, decanted the supernatant and considered the DNA pellet. The pellet was washed with 70% ethanol twice, air dried and dissolved in SDW.
Quantification of DNA by agarose gel electrophoresis
DNA samples were quantified by running on agarose gels along with standard DNA and staining with ethidium bromide. Samples were mixed with appropriate amount of 6x loading dye and electrophoresis on 0.8% Agarose gel along with varying concentration of l DNA. The ethidium bromide stained gels were placed on a UV transilluminator and visual comparisons were made with standards to estimate the DNA concentrations in the samples. The Nano-Drop Spectrophotometer from Nano-Drop Technologies is designed for measuring nucleic acid concentrations in sample volumes of one micro liter.
Amplification of DNA
To amplify extracted DNA using primers, dNTP’s and Taq polymerase at different temperatures using gradient PCR method. The polymerase chain reaction (PCR) (Surecycler 8800.) is used to amplify a single, or a few copies, of a piece of DNA across several orders of magnitude, generating thousands to millions of copies of a particular DNA sequence.
Random Amplified Polymorphic DNA (RAPD) analysis
The RAPD analysis was performed following the modified method of Williams et al. (1990). A total number of 20 primers (OPA series) supplied by Operon Technologies, USA (Table2) were used in this study. Genomic DNA (25-50 ng/µl) of the bacterial isolates was used as template and PCR amplification was performed in a 20µl reaction mixture containing 2 µl template, 2µl of 10X PCR buffer, 2 mM MgCl2, 0.2 mM dNTPs, 1µl (10 pmol) RAPD primer, 1 Unit Taq polymerase (NEB). Master mix was separately prepared in a 0.5ml eppendorff tube. All the ingredients were thoroughly mixed and 18µl of master mix was transferred into a 0.2ml PCR tube. To it 2µl of template DNA was added and was mixed by tapping. Master above quantities. 0.2 ml PCR tubes with DNA samples were loaded in the PCR machine and set the protocol for amplification. Initial denaturation : 94°C for 4 minutes, Denaturation : 94°C for 45 seconds, Annealing : 37°C for 45 seconds, Elongation : 72°C for 1min,Final extension : 72°C for 8 minutes, Cycles : 29. After completion of PCR amplification the PCR tubes were taken out from the thermal cycler and were run for electrophoresis by loading the amplified product in Agarose Gel containing Ethidium bromide for the detection of samples. 1.5g (1.5% gel) of Agarose was dissolved in 100 ml of 0.5X TBE buffer and was melted in a microwave oven. To the melted Agarose, about 5-6µl of Ethidium Bromide solution (0.5µl/ml) was added (so that the DNA fluoresces when gel was exposed to UV light). And then poured into a gel cast fixed with appropriate gel combs and was allowed to solidify at room temperature for 1 hr. Later the gel was transferred into a horizontal electrophoresis unit containing 0.5 X TBE buffer solutions. Before loading the PCR product in the wells of Agarose gel, the PCR amplified products were mixed with 3µl of loading dye. Then the mixture (PCR product +loading dye) was loaded into each well of the gel along with 100 bp DNA ladder (Fermentas Company) in the first well and run at a constant voltage of 120 volts for 1.5 h. The gels were scored for the presence or absence of the bands the isolates. A score of 1 was given for the presence and 0 for the absence of bands. The binary data generated was analysed for genetic similarity using un-weighted pair group arthimetic mean (UPGMA) program of NTSYS pc version 2.11 software. The Dendrogram obtained served as the basis for assessing the genetic relatedness of the strains among themselves.
Bacterial population counts taken in chlorpyrifos enriched sample at different intervals like 2 days, 4 days and 7 days were 5.25×10⁶cfu gram-1 soil, 7.8 cfu ×106 g-1soil, 3.5 cfu ×106 g-1 soil respectively. Bacterial population count taken in phorate enriched sample at different intervals like 2d, 4d and 7d were taken as 15.7 cfu ×106 g-1 soil, 16.3 cfu ×106 g-1 soil, 11.3 cfu ×106 g-1 soil respectively. Eight different bacterial colonies were observed on LB agar plates at 10-4 dilution. Total sixteen bacterial colonies observed on Luria bertani agar plates at 10-4 dilution. Among sixteen, eight bacterial isolates on chlorpyrifos enriched sample were named as CDB-1, CDB-2, CDB-3, CDB-4, CDB-5, CDB-6, CDB-7 and CDB-8 isolates and remaining eight different bacterial isolates were named as PDB-1, PDB-2, PDB-3, PDB-4, PDB-5, PDB-6, PDB-7 and PDB-8 isolates on phorate enriched sample. All the bacterial colonies were purified by streak plate method on enriched Luria bertani agar medium plates.
Similar results were found by Peter et al. (2014) isolated the Pseudomonas aeruginosa, Bacillus megaterium and Staphylococcus aureus from rhizospheric soils. These microorganisms could degrade methyl parathion upto 350 µg ml-1 concentration. Ali et al. (2011) reported similar results and isolated five chlorpyrifos degrading bacterial strains from effluent storage pools of pesticide factories and these isolates exhibited greatest similarity to Pseudomonas aeruginosa (AF 137358, AF 531099, AY 264292), Pseudomonas nitroreducens (EF107515) and Pseudomonas putida (AF 291048).
Morphological and biochemical characterization
The cell morphology, colony morphology, Gram reaction and sporulation, shape was studied for all sixteen isolates of chlorpyrifos and phorate degrading bacteria (table 1). Among eight CDB (Chlorpyrifos degrading bacteria) isolates, four isolates were gram negative (CDB-3, CDB-6, CDB-7, CDB-8,) and remaining four CDB isolates (CDB-1, CDB-2, CDB-4, CDB-5) were gram positive. All the isolates were rod shaped, no motility, gram positive isolates were having sporulation. The cultural characters of all isolates were studied on nutrient agar medium plates. All isolates showed different cultural characters on nutrient agar medium. CDB-6 CDB-3 colonies showed yellowish green pigmentation, while CDB-5, CDB-1 were white irregular, CDB-7, CDB-8, CDB-2, CDB-4, were dull white irregular type of colonies on nutrient agar medium plates.
Table (1):
Degradation percentage of chlorpyrifos at different conc. in MSM broth inoculated with PDB-1 at different time intervals.
| Time of interval | CDB-1 | |||||
|---|---|---|---|---|---|---|
| Concentration (ppm) |
Degradation% | Concentration (ppm) |
Degradation% | Concentration (ppm) |
Degradation % | |
| Initial | 20 | 0.00 | 30 | 0.00 | 40 | 0.00 |
| 2nd day | 17.86 | 10.6 | 22.4 | 25.3 | 36.7 | 8.1 |
| 4th day | 16.16 | 19.1 | 17.9 | 40.1 | 30.4 | 23.7 |
| 6th day | 8.03 | 59.8 | 15.5 | 48.1 | 22.3 | 44.1 |
| 8th day | 5.16 | 74.1 | 12.9 | 56.9 | 19.4 | 51.4 |
| 10th day | 3.6 | 81.7 | 7.5 | 74.9 | 15.7 | 60.6 |
| Half life | 3.24 | 5.57 | 6.54 | |||
Among eight PDB (phorate degrading bacteria) isolates, four isolates were gram negative, small rods (PDB-3, PDB-6, PDB-7, PDB-8),these bacterial isolates shown greenish pigmentation and pseudomonas spp growth characteristics on specified media and biochemical characteristics such as positive for denitrification, H2S and gelatin liquefaction. Remaining four PDB isolates (PDB-1, PDB-2, PDB-4, PDB-5) were gram positive rods. Gram positive rods were showed spore formation ability while gram negative rods were non spore formers. All isolates are single, small rods. All negative isolates are non sporulating and all positive isolates were sporulation ability. The cultural characters of all the isolates were studied on LB agar medium plates. All isolates showed different cultural characters on Luria bertani agar medium plates. PDB-3 colonies had yellowish green pigmentation isolates PDB-5, had white irregular colony, PDB-4, PDB-6, PDB-7, PDB-8, PDB-2, were dull white irregular type colonies, while PDB-1, made creamy, irregular colonies on LB agar medium plates. Biochemical characteristics of phorate degrading bacterial isolates had been given in the table no 2.
Table (2):
Degradation percentage of Phorate at different conc. in MSM broth inoculated with PDB-1 at different time intervals.
| Time of interval | PDB-1 | |||||
|---|---|---|---|---|---|---|
| Concentration (ppm) |
Degradation% | Concentration (ppm) |
Degradation% | Concentration (ppm) |
Degradation % |
|
| Initial | 20 | 0.00 | 30 | 0.00 | 40 | 0.00 |
| 2nd day | 15.6 | 22.0 | 25.4 | 15.1 | 33.4 | 16.5 |
| 4th day | 12.09 | 39.5 | 20.7 | 30.8 | 27.7 | 30.7 |
| 6th day | 9.7 | 51.4 | 12.7 | 57.5 | 26.4 | 33.9 |
| 8th day | 7.2 | 63.9 | 9.1 | 69.6 | 21.7 | 45.7 |
| 10th day | 5.1 | 74.5 | 3.3 | 88.8 | 11.5 | 71.0 |
| Half life (days) | 5.10 | 2.84 | 5.90 | |||
Among the 8 chlorpyrifos bacterial isolates, CDB-1show the high population count at different incubation periods (1st day to 5th day) compared to all CDB inoculates. CDB-1 isolate utilized the pesticide (Chlorpyrifos) effectively and showed maximum growth, bacterial count 5.8 cfu ×106 ml-1. Among the 8 phorate bacterial isolates, PDB-1 showed the high population count at different incubation periods (1st day to 5th day) compared to all PDB inoculates. PDB-1 isolate utilized the pesticide (phorate) effectively and showed maximum growth bacterial count 5.9 cfu ×106 ml-1.
Three different concentrations of chlorpyrifos and phorate MSM broth inoculated with efficient CDB-1, PDB-1 isolates and determined the chlorpyrifos and phorate degrading capacity with measurement of chlorpyrifos, phorate residual concentrations at different days of intervals were analysed using Gas chromatographic method. The degradation of chlorpyrifos at different concentrations (20, 30 and 40 mg l-1) was examined in the MSL medium on rotary shaker at 150 rpm, 30 °C and optimum pH for each isolate. The inoculation of CDB-1 resulted first 2 days, the Chlorpyrifos concentration dropped from 20 to 17.86 mg l-1. After 4th and 6th day, chlorpyrifos was declined to 16.16 and 8.03mg l-1, respectively and by day 8 and 10th day chlorpyrifos was declined to 5.16 and 3.6 mg l-1. The degradation percentage pattern showed decrease of residues from 2nd (20ppm) day to 10th (3.6ppm) day and residues were dissipated by 10.6, 19.1, 59.8, 74.1, and 81.7 % at 2, 4 ,6 ,8 and 10 days, respectively. Second time the inoculation of CDB-1 resulted in the first 2 days, the chlorpyrifos concentration dropped from 30 to 22.4 mg l-1. After 4th and 6th day, chlorpyrifos was declined to 17.4 and 15.5 mg l-1 respectively and by 8th and 10th day chlorpyrifos was declined to 12.9 and 7.5 mg l-1. The degradation percentage pattern showed decrease of residues from 2nd (30ppm) day to 10th (7.5ppm) day and residues were dissipated by 25.3, 40.1, 48.1, 56.9, and 74.9 % at 2, 4 ,6 ,8 and 10 days, respectively. Third time the inoculation of CDB-1 resulted in the first 2 days, the chlorpyrifos concentration dropped from 40 to 36.7 mg l-1. After 4 and 6 day, chlorpyrifos was declined to 30.4 and 22.3 mg l-1, respectively and by 8th and 10th day chlorpyrifos was declined to 19.4 and 15.7 mg l-1. The degradation percentage pattern showed decrease of residues from 2nd day to 10th day and residues were dissipated by 8.1, 23.7, 44.1, 52.4, and 60.6 % at 2, 4 ,6 ,8 and 10 days, respectively(table no. 1).
The inoculation of PDB-1 resulted in the first 2 days, the phorate concentration dropped from 20 to 15.6 mg l-1. After 4th and 6th day, phorate was declined to 12.09 and 9.7 mg l-1, respectively and by 8th and 10th day phorate was declined to 7.2 and 5.1mg l- 1. The degradation percentage pattern showed decrease of residues from 2nd day to 10th day and residues were dissipated by 22.0, 39.5, 51.4, 63.9, and 74.5 % at 2, 4 ,6 ,8 and 10 days, respectively. Second time the inoculation of PDB-1 resulted in the first 2 days, the Phorate concentration dropped from 30 to 25.4 mg l-1. After 4th and 6th day, phorate was declined to 20.7 and 12.7 mg l-1, respectively and by day 8th and 10th day phorate was declined to 9.1 and 3.3 mg l- 1. The degradation percentage pattern showed decrease of residues from 2nd day to 10th day and residues were dissipated by 15.1, 30.8, 57.5, 69.6, and 88.8 % at 2, 4 ,6 ,8 and 10 days, respectively. Third time the inoculation of PDB-1 resulted in the first 2 days, the phorate concentration dropped from 40 to 33.4 mg l-1. After 4 and 6 day, phorate was declined to 27.7 and 26.4 mg l-1, respectively and by 8th and 10th day phorate was declined to 21.7 and 11.5 mg l- 1. The degradation percentage pattern showed decrease of residues from 2nd day to 10th day and residues were dissipated by 16.5, 30.7, 33.9, 45.7, and 71.0 % at 2, 4 ,6 ,8 and 10 days, respectively(table no 2).
Among the molecular diversity of sixteen organophosphorus pesticide degrading isolates viz., eight chlorpyrifos degrading isolates, eight phorate degrading isolates were also studied by PCR-RAPD technique. The PCR amplified products of the eight selected chlorpyrifos degrading isolates with respect to each of the 20 random primers showed 149 polymorphic bands. 1-8. The dendrogram has been divided into two major clusters in between 0.26 -0.65 coefficient scale (fig 1 & plate 1). In cluster-I comprised of only one isolate CDB7 shows separate lane with 26% similarity compared to other isolates.
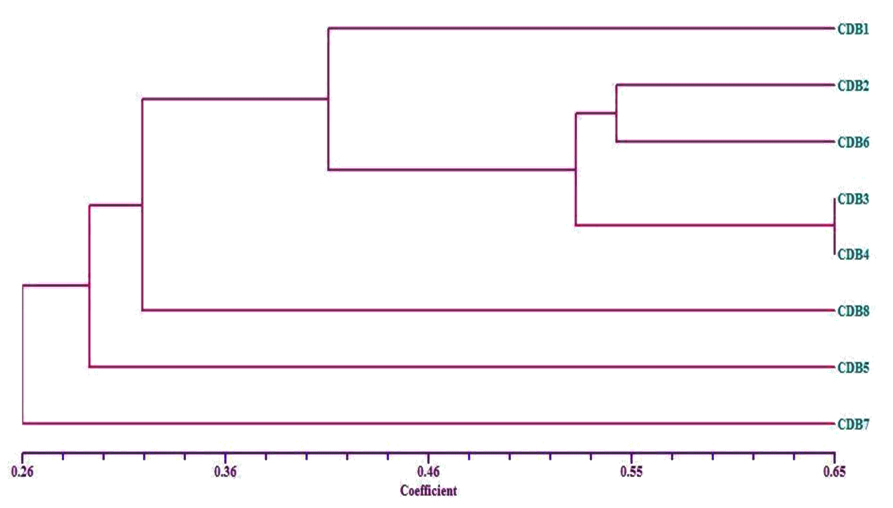 Fig.1. Dendrogram showing genetic diversity among chlorpyrifos degrading bacteria based on RAPD analysis
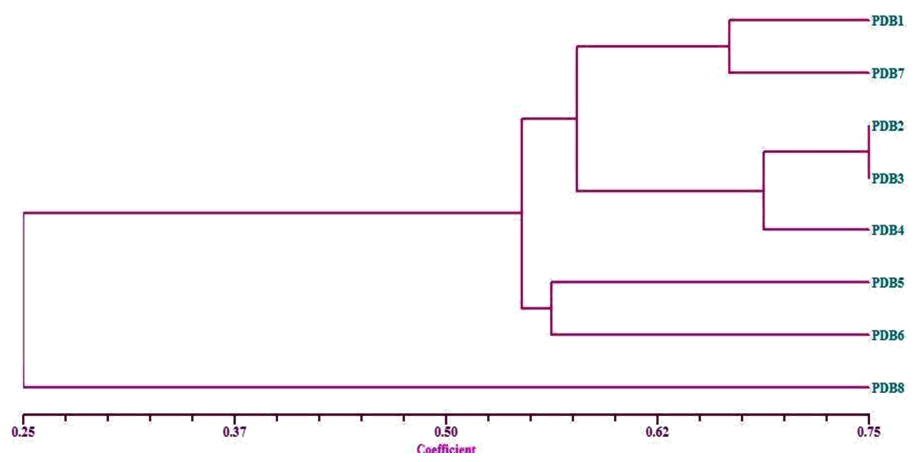 Plate. 1 Banding pattern produced by OPA 10 primer in both chlorpyrifos (1-8) and phorate (9-16) degrading bacteria
Whereas, in cluster-II again divided into two sub clusters IIa and IIb, in cluster-IIa CDB5 isolate shows 29 % similar when compared with other samples in cluster-IIb. Subsequently, cluster-IIb further divided into sub-sub cluster where CDB3 and CDB4 reveal same genetic relatedness according to dendrogram. In the same cluster CDB2 and CDB6 showed 54 % similarity and CDB1 shows 41 % similarity. Hence it is concluded that CDB3 and CDB4 isolates are more or less similar in the genome and functional properties. Whereas, CDB7 isolate was highly diverse among other isolates. The primer OPA 10 showed maximum number of bands39.
The PCR amplified product of the eight selected phorate degrading isolates with respect to each of the 20 random primers showed 153 polymorphic bands. The number varied from 9-16. The dendrogram has been separated in between 0.25 – 0.75 coefficient scale and divided into two major clusters i.e., cluster-I and cluster-II. In cluster-I, PDB8 shows 25% similar with other isolates in the dendrogram. Whereas, cluster-II further divided into two sub clusters, cluster-IIa and cluster-IIb. In cluster-IIa PDB5 and PDB6 showed 55 % similar in coefficient scale. Whereas, in cluster-IIb PDB2 and PDB3 revealed 75% relatedness. The other isolates in the same cluster-IIb, PDB1, PDB7 and PDB4 shows 64-66 % similar( fig 2 & plate 2). Hence, it is concluded that PDB8 was highly diverse from remaining other seven isolates. PDB2 and PDB3 showed similar genome and functional properties. OPA10 showed the maximum number of bands37.
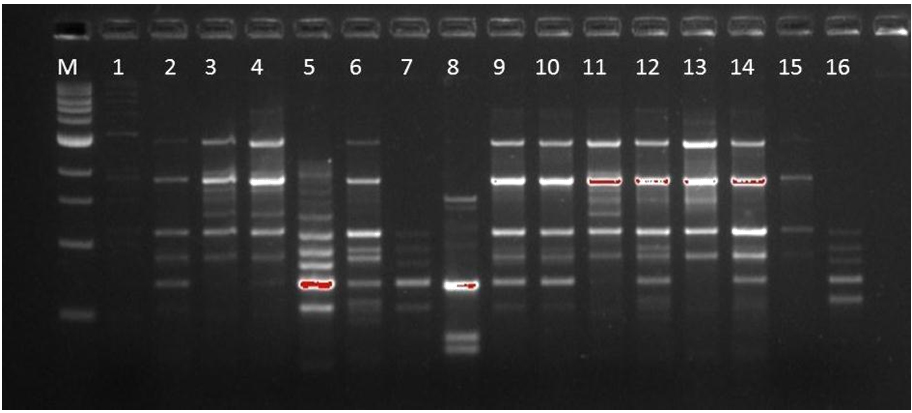 Fig. 2. Dendrogram showing genetic diversity among phorate degrading bacteria based on RAPD analysis
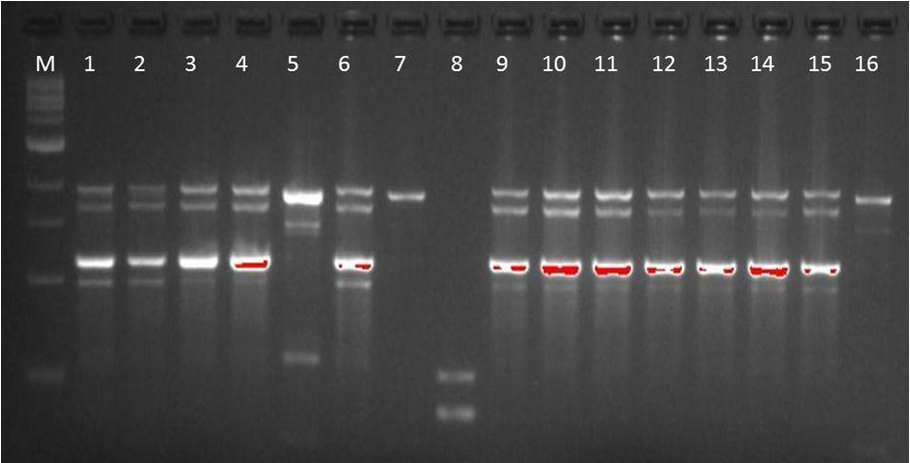 Plate. 2 Banding pattern produced by OPA 18 primer in both chlorpyrifos (1-8) and phorate (9-16) degrading bacteria
Sixteen isolates of organophosphorus pesticides degrading bacteria were isolated from different rhizospheric soils. Out of sixteen isolates eight isolates were screened for the best chlorpyrfos degrading bacteria and another eight more isolates were screened for the phorate degrading bacteria. Among the eight chlorpyrifos degrading bacteria the highest degradation was observed by the isolate CDB-1. Among the eight phorate degrading bacteria the highest degradation was observed by the isolate PDB-1. From the group of chlorpyrifos degrading isolates the maximum diversity was observed with the isolate CDB-7. From the group of phorate degrading isolates the maximum diversity was observed with the isolate PDB-8. The achieved results were useful to conduct further research through pot culture or field studies on different crops to improve the efficacy of the degradation of the organophosphorous pesticides in the soil.
- Guliy OI, Ignatov OV, Makarov OE and Ignatov VV, Determination of organophosphorus aromatic nitro insecticides and p-nitrophenol by microbial-cell respiratory activity. Biosensors and Bioelectronics, 2003; 18: 1005 – 1013.
- Singh B K and Walker A, Microbial degradation of Organophosphorus compounds. Federation of European Microbiological Societies Microbiology Reviews., 2006; 30(3): 428 -71.
- Fulekar M H and Geetha, M, Bioremediation of Chlorpyrifos by Pseudomonas aeruginosausing scale up technique. Journal of Applied Biosciences. 2008; 12 : 657 – 660.
- Gallo, M.A and Lawryk, N.J. Organic phosphoru pesticides. In Handbook of Pesticide Toxicology Editrion. Hayes, W.J and Laws, E.R. 3–5. NewYork: Academic Press 1991.
- Ausubel, F.M and Bisseling, T. Pathogenesis and symbiosis: two sides of the same coin that should be united by a common web-accessible database. Current Opinion in Plant Biology, 1999; 2: 265-267.
- Williams, J. G. K., Kubelik, A. R., Livak, K. J., Rafalski, J. A. and Tingey, S. V. DNA polymorphisms amplified by arbitrary primers are useful as genetic markers. Nucleic Acids Research, 1990; 18: 6531-6535.
- Ali, M.L., Samaneh, K., Morteza, M., Mohsen, M and Hamid, B. Isolation and characterization of five chlorpyrifos degrading bacteria. African Journal of Biotechnology. 2011; 11(13): 3140 – 3146.
- Brenner, D.J., Krieg, N. R and Staley, J.T. Bergey’s Manual of Systematic Bacteriology, 2005; 2(c), USA: Springer. 41-99.
© The Author(s) 2016. Open Access. This article is distributed under the terms of the Creative Commons Attribution 4.0 International License which permits unrestricted use, sharing, distribution, and reproduction in any medium, provided you give appropriate credit to the original author(s) and the source, provide a link to the Creative Commons license, and indicate if changes were made.