

ISSN: 0973-7510
E-ISSN: 2581-690X
This study was undertaken to determine the frequently isolated organism from pus culture and to determine the antibiotic sensitivity patterns so that it helps to manage the drug resistant organism well in time which poses challenge to clinician to treat the patients. Total 2050 samples were collected from April 2016 to March 2017 to study antibiograms of various organisms. Organisms were identified as per standerd operative procedure and drug sensitivity was done as per CLSI guidelines. Most commonly encountered organism was Staph.aureus followed by Klebsiella, Pseudomonas, Proteus, Citrobacter, E.coli and Acinetobacter. Staph.aureus was showing sensitivity towards Vancomycin, whereas gram negative organisms were showing sensitivity towards Imipenem, Gentamycin, Ciprofloxacin and Ceftriaxone. Antimicrobial resistence is a predictable outcome of antimicrobial use. Lengthy or inappropriate antimicrobial therapy allow microbes to mutate into new forms that help them to survive antibiotic treatment and quickly become resistance strain. Knowledge of local common pathogens and their resistance status can guide clinician to choose appropriate antibiotic for empirical treatment of patients.
Antimicrobial susceptibility, Pus, Pyogenic infection, Retrospective study
Pyogenic infection are characterized by local and systemic inflammation with pus formation. Infection of soft tissue are generally associated with the production of pus and bacteria involved are said to be pyogenic (pus producing). Wide variety of aerobic and anaerobic species of bacteria may be present either singly or in combination in infection of wounds and soft tissue. Some infection resolve without specific therapy but some infection especially mixed infection can cause severe synergic therapy1. Antimicrobial resistence is a predictable outcome of antimicrobial use. Lengthy or inappropriate antimicrobial therapy allow microbes to mutate into new forms that help them to survive antibiotic treatment and quickly become resistance strain. Knowledge of local common pathogens and their resistance status can guide clinician to choose appropriate antibiotic for empirical treatment of patients2. Various studies across the world have shown periodic monitoring of the bacterial profile in the pyogenic wound infection, which is helpful for the empirical treatment of the patient. Keeping this in mind this study has been undertaken to know the common organism involved and their antibiogram in our set up.
This is a Retrospective study conducted in department of Microbiology, Silchar Medical College, Silchar. In the present study the data was collected from the period April 2016 to March 2017. The total number of 2050 pus sample were collected from cases of pyogenic infection attending both OPD and indoor in the department of Surgery, O&G, Orthopaedics and ENT. Under strict aseptic condition sample were collected and transported to the Department of Microbiology for processing. The media and reagents are purchased from HIMEDIA laboratories. Mumbai, India. First, samples were inoculated in 5% sheep Blood agar and MacConkey agar culture media, then it was subjected to Gram staining of direct smear and Gram stain was examined for the presence of pus cells and any bacteria. The inoculated media were incubated aerobically at 37® C for 24 hours. If there was no growth, incubation time is extended up to 48 hours to be considered sterile. All the bacteria growing on blood agar and MacConkey agar were examined to look for the colony character, Gram staining and motility. Identification of isolates were done based on biochemical test like catalase test, oxidase test, coagulase test, Triple sugar iron test, carbohydrate fermentation test, phenyl pyruvic acid, Methyl red test, Nitrate reduction test, Urease test, citrate utilization test, Indole test ,Arginine dihydrolase production, lysine and ornithine decarboxylase test, and Hugh and leifson test3. The antimicrobial susceptibility testing were done by Kirby Bauer,s Disc Diffusion method and interpreted as per Clinical Laboratory Standard Institution (CLSI) guidelines(4). For antimicrobial sensitivity testing Muller Hinton agar was used. The antimicrobial disc used were purchased from HiMedia laboratory Ltd. Inhibition zones were measured and reported as sensitive or resistant according to manufacturer, s guidelines. Escherichia coli ATCC 25922, Pseudomonas aeruginosa ATCC 27853 and Staphylococcus aureus ATCC 25923 were used as quality control strains. Antimicrobial discs used for sensitivity testing by disc diffusion method were Imepenem 10mcg, piperacillin/ tazobactam 100/10 mcg, Ceftazidime 30mcg Cefotaxime 30mcg, Amikacin 30mcg, Gentamicin 10mcg, Levofloxacin 5mcg, Ceftroaxone 30mcg, Cefoxitin 30mcg, Amoxycillin/Clavulanic acid 20/10mcg. Vancomycin 30mcg, Azithromycin 15mcg, Linezolid 30mcg, Ampicillin 10mcg, Ciprofloxacin 5mcg, Cefuroxime 30mcg, Ceftriaxone 30 mcg, Aztreonam 30mcg.
Out of 2050 pus samples obtained in the Microbiology laboratory from various departments of Silchar Medical College, Silchar. 1040 were culture positive and 1010 were sterile. Out of 1040, 439 (42.21%) were Stapylococcus aureus, Klebsiella species 165 (15.86%), Pseudomonas species 159 (15.28%), Proteus species 141 (13.55%), Citrobacter 98 (9.4%), Escherichia Coli 20 (1.9%), Acinetobacter 18 (1.7%). The antibiogram of gram positive cocci showed 100% sensitivity to vancomycin and Linezolid followed by high sensitivity to Azithromycin, Cefuroxime while moderate sensitivity was observed to Cefoxitin, Levofloxacin Ampicillin and Amoxycillin/clavulanic acid. Gram positive cocci showed high resistence to Ciprofloxacin, Ceftriaxone and Amikacin. MRSA noted was 75.68%. The antibiogram of enterobacteriaceae (Klebsiella and Proteus ) showed high susceptibility to Imipenem. E. coli showed highest susceptibility to Amikacin and Levofloxacin. Citrobacter showed highest susceptibility to Levofloxacin. High resistence is observed towards Ceftazidime (Klebsiella), Aztreonam (E. coli), Cefuroxime (Proteus) and Citrobacter (Ceftriaxone) respectively. Pseudomonas and Acinetobacter showed maximam susceptibility to Piperacillin/tazobactam.
Table (1):
Antibiogram of gram positive cocci
| Antibiotics | Staph. aureus | |
|---|---|---|
| Sensitive | Resistant | |
| Amoxycillin/Clavulanic | (23.46%) | (77.06%) |
| Vancomycin | (100%) | (0%) |
| Azithromycin | (91.74%) | (8.8%) |
| Levofloxacin | (45.87%) | (54.44 %) |
| Linezolid | (100%) | (0%) |
| Amikacin | (17.76 %) | (82.79%) |
| Ciprofloxacin | (10.70 %) | (89.90%) |
| Ampicillin | (43.57%) | (56.71 %) |
| Ceftriaxone | (14.90%) | (85.19%) |
| Cefuroxime | (75.85 %) | (24.31%) |
| Cefoxitin | (47.24%) | (53.07 %) |
Table (2):
Antibiogram of Enterobacteriaciae
| Antibiotics | Klebsiella | E. coli | Proteus | Citrobacter | ||||
|---|---|---|---|---|---|---|---|---|
| S | R | S | R | S | R | S | R | |
| Amikacin | 90.90% | 9.09% | 100% | 0% | 85.1% | 14.8% | 55.1% | 44.8% |
| Levofloxacin | 98.18% | 1.81% | 100% | 0% | 70.9% | 29.07% | 98.9% | 1.02% |
| Ceftazidime | 6.06% | 93.93% | 50% | 50% | 28.3% | 71.6% | 81.6% | 18.3% |
| Ceftriaxone | 65.45% | 34.54% | 40% | 60% | 55.3% | 44.6% | 15.3% | 84.6% |
| PIT | 31.51% | 68.48% | 65% | 35% | 93.6% | 6.3% | 69.3% | 30.6% |
| Cefotaxime | 73.93% | 26.06% | 100% | 0% | 63.3% | 36.1% | 75.5% | 24.4% |
| Gentamycin | 67.87% | 32.12% | 80% | 20% | 92.1% | 7.8% | 10.2% | 89.7% |
| Imipenem | 100% | 0% | 90% | 10% | 100% | 0% | 93.8% | 6.1% |
| Cefuroxime | 67.87% | 32.12% | 0% | 20% | 7.09% | 92.9% | 63.2% | 36.7% |
| Aztreonam | 54.54% | 45.45% | 25% | 75% | 73.7% | 26.2% | 85.7% | 16.6% |
| Ampicillin | 52.12% | 47.87% | 75% | 25% | 11.3% | 88.6% | 66.3% | 33.6% |
Table (3):
Antibiogram of Pseudomonas and acinetobacter
| Antibiotics | Pseudomonas | Acinetobacter | ||
|---|---|---|---|---|
| S | R | S | R | |
| Amikacin | 75.4% | 24.5% | 22.2% | 77.7% |
| Levofloxacin | 35.2% | 64.7% | 44.4% | 55.5% |
| Ceftazidime | 3.1% | 96.8% | 11.1% | 88.8% |
| Ceftriaxome | 37.7% | 62.7% | 44.4% | 55.5% |
| PIT | 94.3% | 5.6% | 55.5% | 44.4% |
| Cefotaxime | 57.8% | 42.1% | 11.1% | 88.8% |
| Gentamycin | 83.6% | 16.3% | 50% | 50% |
| Imipenem | 75.4% | 24.5% | 44.4% | 55.5% |
| Cefuroxime | 6.9% | 93% | 0% | 100% |
| Ciprofloxacin | 43.3% | 56.6% | 5.5% | 94.4% |
| Aztreonam | 91.8% | 8.1% | 5.5% | 94.4% |
PIT- Piperacillin/Tazobactam
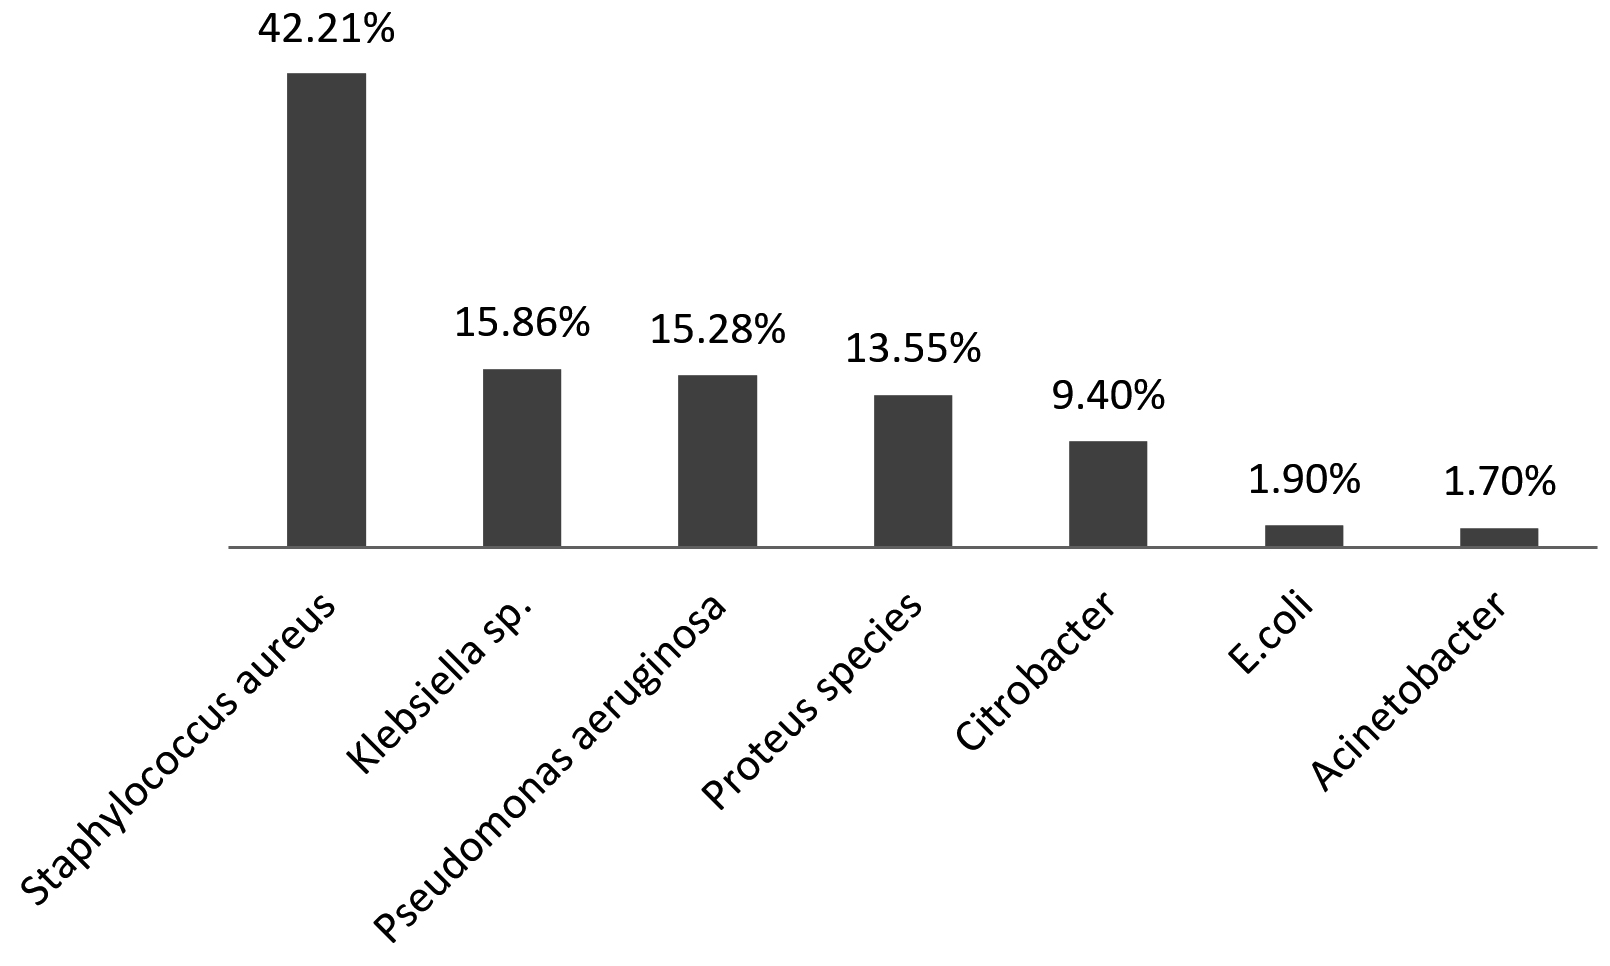
Fig. 1. Distribution of organism isolated from pusculture
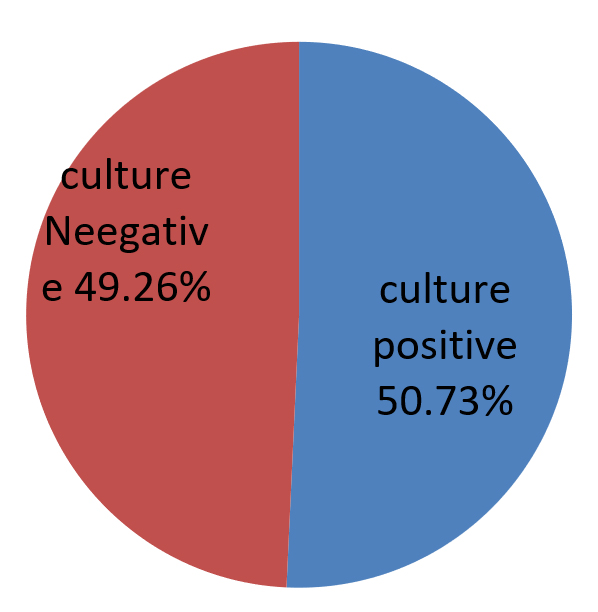
Fig. 2. Number of Culture Positive and Culture Negative
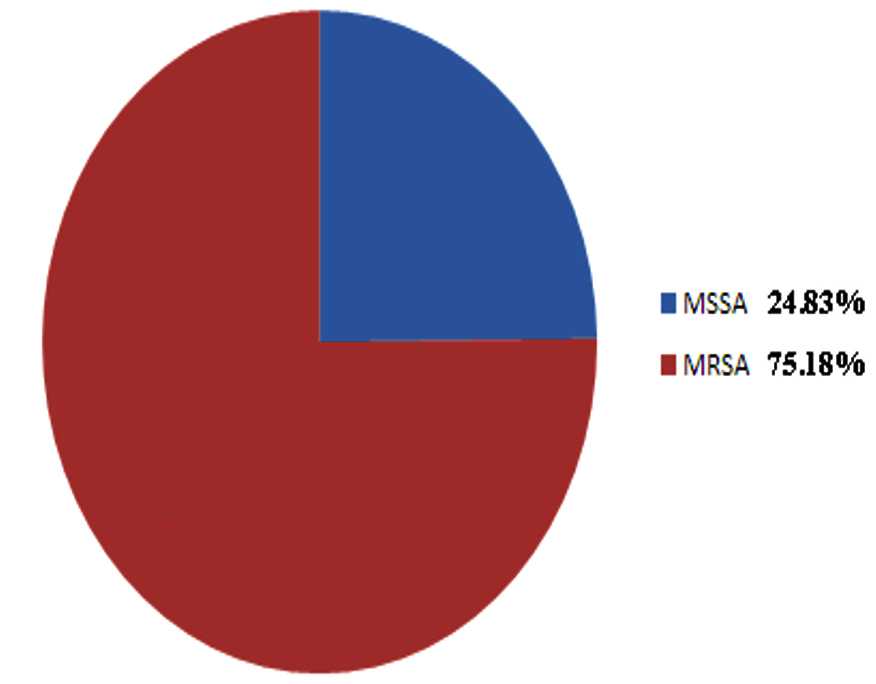
Fig. 3. Prevalence of MRSA & MSSA in Staphylococcus aureus
The prevalence of culture positive pus samples in our study is 50.73%. The observation of this study very well coincide with the works reported by various authors across the country. S. aureus was found to be the most commonly occurring pathogen in study group done by Tiwari et al5, Lee C. Y et al6, and zafar A et al7. However Duggal Swati et al8 and Basu et al9 found Pseudomonas to be the most common isolate. Also, Ramesh kannan S et al10. found Escherichia coli to be the most common organism isolated from pus samples. Staphylococcus aureus was found to be 100% sensitive to Vancomycin & Linezolid which agrees with studies of Chauhan et al11. Enterobacteriseiae members mostly show high sensitivity towards Imepenem which is similar to the study done by Duggal Swati et al8 and Chauhan M et al. Patients with Acinetobacter strains had shown high sensitivity towards Piperacillin/Tazobactam as found by other authors like Rao Raghav et al12
The result of the above study exemplify there is an increasing need for gaining knowledge about the pattern of microbes and their antibiotic sensitivity and resistance, which varies in a geographical manner. The isolates from this study showed that Staphylococcus aureus was the most isolated organisms from the pus culture report followed by Klebsiella, Pseudomonas, Proteus, Citrobacter, E. coli and Acinetobacter. In Staphylococcus aureus Vancomycin showed highest sensitivity followed by Enterobacterecia showed highest sensitivity to Imepenem, Levofloxacin. Nonfermenter like Pseudomonas and Acinetobacter also showed highest sensitivity to Piperacillin/Tazobactam. Knowledge of causative agents of pyogenic infection and their antibiotic sensitivity pattern is very essential for the judicial administration of empirical therapy before culture result are available. Antibiotic sensitivity of microorganism varies from place to place and time to time, hence regular monitoring of bacterial sensitivity to antibiotics is essential. However there is a scope for further study of microorganism in other clinical specimen also to know their antibiotic sensitivity will invariably add to the knowledge of our microbiologist and clinician.
- Koneman,W.K.,Allen,S.D.,janda,W.M.,Schreckenberger,P.c.,Propcop,G.W., Woods G.L. and Winn, W.C., jr. Philadelphia. Color Atlas and Textbook of Diagnostic Microbiology, 6th ed. Lippincott-Raven publisher. 2005; 624-662.
- Chauhan M, Manish S and Mohajan S.Aerobic Bacterial Profile and antibiotic sensitivity pattern of pus isolates in a tertiary care hospital. Int. J. Curr. Microbiol. App. sci, 2005; 4(5); 784-787.
- Parajuli P, Basnytat SR, Shrestha R, Shah PK, Gurung P. Identification antibiotic susceptibility pattern of aerobic bacterial wound isolates in Scheer memorial hospital. JSM Microbiology, 2014; 2(2): 34.
- Clinical and Laboratory Standard Institute. Performance Standards for antimicrobial susceptibility testing ;Clinical and Laboratory Standards Institute, Wayne, 2012.
- Tiwari P , Kaur S. Profile and Sensitivity Pattern of bacteria isolated from various culture in a tertiary care hospital in Delhi. India J Public health, 2010; 54(4): 213-5.
- Lee CY , Chen PY ,Huang FL ,Lin CF .Microbiology spectrum and susceptibility pattern of clinical isolates from the pediatric intensive care in the simple medical centre-6 years experience. J Microbiol Immunol Infect, 2009; 42(2): 160-5; 7.
- Zafar A, Anwar N, Ejaz H. Bacteriology of infected wounds- A study conducted at children’s hospital, 2008.
- Duggal S,Khetri PK, Parihar RS, Arora R. Antibiogram of various Bacterial Isolation from Pus Sample in a Tertiary care centre in Rajasthan. International journal of science and research, 2013; 4: 438.
- Basu S, Ramcharan Panray T, Bali Singh T, Gulati AK, Shukla VK, A; prospective, drescritive study to identify the microbiological profile of chronic wounds in Outpatients, Ostomy Wound manage, 2009; 55(1): 14-20.
- Rameshkannan S, Nileshraj G, Rameshprabu S, Mangaiarkkarasi A, Meher Ali R. Pattern of pathogens and their sensitivity isolated from pus culture reports in a tertiary care hospital, puducherry. Indian Journal of Basic and Applied Medical Research, 2014; 4(1): 243 – 248.
- Chauhan M, Manish S and Mohajan S. Aerobic Bacterial Profile and antibiotic sensitivity pattern of pus isolates in a tertiary care hospital. Int. J. Curr. Microbiol.App.Sci, 2005; 4(5): 784-787.
- Rao R, Biswas DR. Aerobic Bacterial Profile and Antimicrobial Susceptibility Pattern of Pus Isolates in a South Indian Tertiary Care Hospital. IOSR Journal of Dental and Medical Sciences, 2014; 59-62.
© The Author(s) 2017. Open Access. This article is distributed under the terms of the Creative Commons Attribution 4.0 International License which permits unrestricted use, sharing, distribution, and reproduction in any medium, provided you give appropriate credit to the original author(s) and the source, provide a link to the Creative Commons license, and indicate if changes were made.