


ISSN: 0973-7510
E-ISSN: 2581-690X
Microbial interactions are frequently categorized according to how they affect each population in a binary system. We aimed to determine the interaction between P . aeruginosa, S . aureus, and E . coli in-vitro. In this experimental hospitalized patients’ sputum, urine, and blood samples were used to collect a total of 90 clinical isolates for the study in Damanhour Medical National Institute, Behira, Egypt, followed by accurate identification and testing for antibiotic sensitivity. To examine the effect of the supernatant of P. aeruginosa on S. aureus and E. coli determined MIC using broth microdilution method. We also measured the activity of lasA protease by assessing the S. aureus cell lysis potential of P. aeruginosa culture supernatants. Extraction of pyocyanin was made to determine the change in the cell nature of S. aureus upon exposure to pyocyanin by using a scanning electron microscope and the shape of colonies on the culture media was determined. Finally, we detect lasA, operon phz, phzM, phzS and rhlAB genes for P. aeruginosa. P. aeruginosa showed a great impact on S. aureus isolates resistant to different antibiotics as it facilitates their killing and may drive the normal colonies of S. aureus into SCVs. The ability to form biofilm by S. aureus and E. coli decreased in the presence of Pseudomonas supernatant.
Biofilm, Microbial Interactions, P. aeruginosa Interactions, E.coli Interactions, S. aureus Interactions, Operon phz
In the previous ten years, there has been an increasing comprehension of the most prevalent bacterial lifestyle is the biofilm mode of growth.1 Structured, surface associated bacterial colonies in a matrix of extracellular cells are known as biofilms. Living in a biofilm offers protection from hostile environment that frequently poses risks such as mechanical stress, desiccation, and biocides2
In a single biofilm, different species typically coexist in which they either enhance one another’s fitness or compete for nutrients and space.3,4 The majority of bacteria have evolved communication techniques that work in a cell density-dependent manner to communicate within and between species, such as quorum sensing, which makes use of tiny, diffusible chemicals. In addition, many bacteria release antibiotic components to eliminate rivals, which are frequently also controlled by quorum sensing5,6
Microbial interactions are frequently categorized according to how they affect each population in a binary system. The condition of neutrality occurs when neither population is impacted by the presence of the other. Competition is an interaction between two populations that hinders both populations’ ability to grow as they fight for a nutrient. The phenomenon known as “commensalism” happens when one population benefits from the presence or actions of another while the beneficiary is unaffected. Mutualism is a type of interaction where both populations gain something from it. It might take the form of obligatory interactions like symbiosis, facultative interactions like protocooperation, or interactions that increase the output of a particular product (synergism). Syntrophy is the name for protocooperation in which a growth factor or energy source is exchanged.7
Predation, in which one creature is devoured by another, and parasitism, in which one organism is penetrated intracellularly by another, are examples of direct negative interactions. Although this classification uses a binary system, which is useful for defining interactions, interactions in a natural community can be complex and include mixed interactions, in which more than one type of interaction takes place between two species, as well as interactions involving multiple species.7
The population densities of a Lactobacillus sp and a Streptococcus sp have grown in continuous culture, using whey as a substrate, were similar in mixed cultures and individual cultures of each species.8,9 Furthermore, When P. aeruginosa and K. pneumonia were grown in a mixed-species biofilm, neither the product (cellular and extracellular carbon) generation rate nor the glucose to oxygen consumption ratio changed from what was observed for monoculture biofilms in an annular reactor.10,11
Vital link between microorganisms and bacteria is the predation of bacteria by microbial eukaryotes and bacteriophages food chains,12,13 and has affects across numerous contexts on the composition and structure of the bacterial community.14 Predation is the primary reason for bacterial death in both freshwater and marine settings.15,16 In some aquatic environments, top-down control by predation also appears to regulate bacterial population sizes.17
P. aeruginosa, which accounts for 16% of nosocomial pneumonia infections, 10% of bloodstream infections, 8% of surgical wound infections, and 12 % of hospital acquired UTI, is one of the four most common bacteria that cause nosocomial infections.18,19 P. aeruginosa results in bacteremia and then the death rates can reach as high as 50% in burn wounds.20 Infection of P. aeruginosa may be acute or chronic, as it colonizes through the attachment by type IV pili and flagella.21,22
P . aeruginosa is a predominant cause of lung infections and mortality in cystic fibrosis patients, and also that infected burn patients.23,24 Extracellular factors secreted include exotoxin A prussic acid, phospholipases, zinc metalloprotease (LasB), elastase (LasA), and alkaline protease. Factors related to cell include exoenzyme S, pili, lipopolysaccharide, type III secretion system, alginate, and flagella.25,26
S. aureus maintains a leading role as a nosocomial pathogen in different countries. The prevalence of transient and persistent S. aureus nasal carriage varies by geographical location, age, gender, and ethnicity. Studies have shown carriage ranges from 9 % in Indonesia to 37 % in Mexico.27,28
Carriage is highest amongst newborns (up to 70 %) but steadily decreases in childhood. In Egypt, a randomized study in Egypt on healthcare workers in different hospital departments was conducted to test for the effect of linezolid on nasal and throat colonization. A total of 134 healthcare workers were screened, and 43 (32%) were found to be MRSA carriers (41 nasal carriers and two nasal plus throat carriers).29
The prevalent extraintestinal E. coli infections, UTIs are brought on by uropathogenic E. coli (UPEC). The meningitis-associated E. coli pathotype, which also causes sepsis, is a more frequent source of extraintestinal infections. The E. coli pathotypes associated with extraintestinal infections have recently been given the name ExPEC.30 The different pathotypes of E. coli often belong to clonal groups that share the O (lipopolysaccharide, or LPS) and H (flagellar) antigens, which define SEROGROUPS (O antigen alone) or SEROTYPES (O and H antigens).31
This work aims to determine virulence factors of selected P . aeruginosa, S. aureus, and E.coli isolated from different human clinical samples then extract some extracellular substances produced by P. aeruginosa and study their activity against different bacterial isolates as well as determine the interaction between P . aeruginosa and S . aureus and E. coli in-vitro.
Bacterial strains
A ninety clinical isolates were obtained from the sputum, urine, and blood samples of hospitalized patients in Damanhour Medical National Institute, Behira, Egypt, after the permission of the Hospital General Manager from January to June 2018. They were examined under aseptic conditions, for the eventual presence of P . aeruginosa, S . aureus, and E . coli in the Department of Microbiology and Immunology, Faculty of Pharmacy, Damanhour University. PAO1 P. aeruginosa strain and ATCC 25923 S. aureus strain were conduct. The identification of P. aeruginosa isolates and E.coli were validated to the species level by using automated Vitek 2 system (Bio-Merieux, I‘ Etoile, France), while Gram-positive isolates were subjected to a coagulase test and catalase test after culturing on Mannitol salt agar (Blackburn distribution, UK).
Antimicrobial susceptibility
Antibiotic discs were tested for antimicrobial susceptibility by the disc diffusion approach. Ampicillin (AMP,10μg), Amoxicillin/Clavulanic acid (AMC,30μg), Azithromycin (AZM,15μg), Aztreonam (ATM,30μg), Cefazoline (CZ,30μg), Cefepime (FEB,30μg), Cefoperazone (CFP,30 μg), Ceftazidime (CAZ,30μg), Chloramphenicol (C,30μg), Ciprofloxacin (CIP, 5μg), Clindamycin (DA,2μg), Doxycycline (DOX,30μg), Erythromycin (ERY,30μg), Gentamicin (CN,10μg), Imipenem (IPM, 10μg), Meropenem (MEM,10μg), Levofloxacin (LEV, 5μg), Linezolid (LZN,30μg), Nitrofurantoin (F,100μg), Ofloxacin (OFX,5μg), Pipracillin/Tazobactam (TPZ,110μg), Tetracycline (TE,30μg) Trimethoprime / Sulphamethoxazole (TMP / SMX, 1.25 / 23.75 μg), Vancomycin (VA, 30μg) (Oxoid, UK) to all isolates. The CLSI (2020) was used to classify the obtained values into sensitive or moderate or resistant.
Molecular detection of the virulence genes of P. aeruginosa
The oligonucleotide primers synthesized by Thermo Fisher Scientific32 used for the amplification of lasA genes (the genes responsible for lasA enzyme formation), rhlAB gene (the genes responsible for rhamnolipid formation ) and operon phz, phzM and phzS (responsible for pyocyanin formation ) in P. aeruginosa by PCR technique Table 5. P. aeruginosa isolates’ genomic DNA was extracted by boiling.15 A 25 μl reaction volume was used for all PCRs, with mixtures that contained: 10 μl of PCR Master Mix reagents (2X TOPsimple™ DyeMIX-nTaq PCR Master Mix, India), 5 pmol of the forward and reverse primers and 5 μL of the DNA template. The PCR cycling parameters were: Initial denaturation for 2 minutes at 95°C, denaturation 30 seconds at 95°C, annealing at 55°C for 1 min [for lasA, rhlAB,phzM, and phzS] and at 50°C for 1 min [for operon phz], extension 1 min at 72°C, final extension 5 min at 72°C. DNA fragments were detected on 1% agarose gel (GeneDireX – MB755-0100, USA) with ethidium bromide staining.
Quantitative determination of biofilm formation
The microtiter plate technique was used to assess each isolate’s capacity to generate a biofilm of E. coli and S. aureus. A 96-well polystyrene microtiter plate was filled with 200 L of the freshly infected medium after overnight nutrient broth cultures had been diluted 1:100 in fresh nutrient broth. Negative control wells were just filled with broth. Each well’s contents were aspirated after 24 hours of incubation at 37°C, and then each well was washed with 250 µl of sterile physiological saline. Plates were then stained with 0.2 ml of 2% crystal violet for 5min. The extra stain was removed by rinsing with running water. The dye that was bound to the adherent cells was eluted with 160 µl of 95% (v/v) ethanol after the plates had dried by air. The optical density (OD) was measured at 630 nm by using an automated reader. Assays were performed in triplicate and the average was taken.33
Determination of the effect of supernatant of P. aeruginosa on biofilm formation
P. aeruginosa isolates were grown in MHB at 37°C for approximately 20 h. The cultures were pelleted and supernatants were passed through a 0.2 μm sterile filter. This was made according to Gomes et al. technique with some modifications, formation of biofilm by S. aureus and E. coli was performed as individual cultures. The 96-well polystyrene microplate was filled with 180μl of TSB broth, inoculated with 20 μl of individual bacterial suspension, 50 μl of P. aeruginosa supernatant and incubated at 35°C for 24 h. The wells washed three times with 250 ml of distilled water and the biofilm formation was determined based on the ODs of bacteria films.33
Pyocyanin extraction assay from P. aeruginosa
The method of Ralli et al., 2005 was followed with slight modifications. A 5 ml of overnight grown liquid culture in LB broth was inoculated into a 50 ml nutrient broth medium in a 250 ml flask and incubated at 37°C for 24 hours. A 5 ml aliquot was transferred to a 15 ml conical flask and centrifuged at 1300xg for 25 minutes at 4°C. The supernatant was filtered through a 0.2 μm sterile filter and pyocyanin was extracted from the filtered supernatant with 3 ml of chloroform after vortexing to mix and centrifuging at 4°C for 10 minutes at 1300xg. The pyocyanin (bottom layer) was transferred to a new 15 ml test tube and 1 ml of 0.2N HCl was added. The mixture was centrifuged as described above and the pink color obtained from the extraction was transferred to a cuvette and the absorbance was measured at A520. Microgram quantities of pyocyanin were calculated by multiplying the absorbance at 520nm by 17.072.34 For the effect of pyocyanin on S. aureus colonies, we used an agar diffusion assay in which wells were filled with various concentrations of pyocyanin (25, 50, and 100 μg/ml) within the agar streaked with S. aureus.35
We use also scanning electron microscope assay to detect the difference between SCV cells and normal cell size. Then the size of the former colonies after incubation for 24 hours at 37°C was observed. The colonies grown around the pyocyanin wells were then determined under a scanning electron microscope to detect the size and shape of the cells from the small colony variants. A few of colonies of fresh culture S. aureus isolates removed and fixed by immersing them immediately in 4F1G (Fixative, phosphate buffer solution ) PH=7.4 at 4°C for 3 hours. The culture was then post fixed in 2% OsO4 in the same buffer at 4°C for 2 hours. Samples were washed in the buffer and dehydrated at 4°C through a graded series of ethanol. Samples of S. aureus isolates were dried by means of a critical point method, mounted using carbon paste on an AL- stub and coated with gold up to a thickness of 400 A in a sputter–coating unit (JFC-1100 E). Observations of cells morphology in the coded isolates were performed in a Jeol JSM- 5300 scanning electron microscope operated between 15 and 20 KeV.34
Staphylolytic enzyme effect on S. aureus culture
LasA protease activity was measured by determining the ability of P. aeruginosa culture supernatants to lyse S. aureus cells. Briefly, an overnight culture of S. aureus was boiled for 10 min, followed by centrifugation for 10 min at 10,000X g. The resulting pellet was re-suspended in 10 mM Na2PO4 (pH 7.5) to an optical density at (OD600 nm) of approximately 0.8. An overnight culture of P. aeruginosa was centrifuged at 10,000X g for 10 min to pellet the cells, and then the supernatant was passed through a 0.2-μm pore-size filter for sterilization. A 100 μl aliquot of the supernatant was then added to 1ml of S. aureus suspension. LasA activity results in clearance of the suspension (reduced turbidity), indicative of S. aureus cell lysis, as measured by the D600 at 2, 6, 10, 14, 18, 22, 26, 30, 45, 60, 90, 120 min.36
Effect of P . aeruginosa supernatant on S . aureus and E . coli susceptibility to antibiotic killing
Supernatant was prepared as mentioned before, 5 ml of culture was pre treated with 0.5 ml sterile supernatant and returned to the incubator for a further 30min. A 30min pre-exposure was routinely used as we attempted to emulate the situation in vivo. Antibiotics [ciprofloxacin, gentamicin, and vancomycin] were 2-fold serially diluted with sterile distilled water. Microtiter minimal inhibitory concentration tests were done according to the standard technique (CLSI 2020). MICs were determined using the microdilution method. Briefly, approximately 5 x 10⁵ CFU were incubated with varying concentrations of ciprofloxacin, and gentamicin for S. aureus and E. coli, while incubation of S. aureus only with varying concentrations of vancomycin in a total volume of 200 μl MHB in a 96-well plate. Where indicated, 34 μl MHB was replaced with sterile P. aeruginosa supernatant. MICs were determined following incubation at 37°C for 24 h.37
Identification of clinical isolates
The identification of the 90 isolates revealed that 42 P. aeruginosa, 28 S. aureus, and 20 E. coli.
Antimicrobial susceptibility testing
The antibiotic susceptibility of the E. coli, S. aureus, and P. aeruginosa isolates were determined by the disc diffusion method using different antibiotics. Every S. aureus isolate was susceptible to vancomycin. P. aeruginosa was resistant to tested antibiotics as follows: imipenem (26.2%), meropenem (38.1%), gentamicin (50%), amikacin (57.1%), aztreonam (38.1%), ciprofloxacin (64.2%) and ceftazidime (35.7%) as in Table 1. All S. aureus isolates were sensitive to linezolid (100%) and reported percentages of resistance to other antibiotics as follows: gentamicin (71.4%), erythromycin (55.6%), chloramphenicol (42.8%), cotrimoxazole (53.5%), tetracycline (71.4%), doxycycline (57.1%), clindamycin (17.8%), erythromycin (53.5%), levofloxacin (55%), ciprofloxacin (60.7%) and vancomycin (14.2%) as in Table 2. The resistance of the E . coli isolates listed as follows: imipenem (0%), meropenem (0%), amoxicillin/clavulanic acid (65%), amikacin (20%), nitrofurantoin (35%), gentamicin (45%), ciprofloxacin (70%), levofloxacin (55%) and cefepime (75%) as shown in Table 3.
Table (1):
Antimicrobial susceptibility test for P. aeruginosa isolates using antibiotic discs.
| P. aeruginosa (Total no. = 42) | |||
|---|---|---|---|
| Sensitive | Intermediate | Resistant | |
| Amikacin [AKN] | 14 | 4 | 24 |
| Aztreonam [ATM] | 23 | 3 | 16 |
| Cefepime [FEP] | 15 | 7 | 20 |
| Ceftazidime [CAZ] | 22 | 5 | 15 |
| Ciprofloxacin [CIP] | 15 | 0 | 27 |
| Gentamicin [CN] | 13 | 8 | 21 |
| Imipenem [IMP] | 24 | 7 | 11 |
| Levofloxacin [LEV] | 14 | 2 | 26 |
| Meropenem [MEM] | 22 | 4 | 16 |
| Ofloxacin [OFX] | 10 | 11 | 21 |
| Pipracillin/Tazobactam [TPZ] | 23 | 3 | 16 |
Table (2):
Antimicrobial susceptibility test for S. aureus isolates using antibiotic discs.
| S. aureus (Total no. = 28) | |||
|---|---|---|---|
| Sensitive | Intermediate | Resistant | |
| Amikacin [AKN] | 15 | 6 | 7 |
| Azithromycin [AZM] | 4 | 4 | 20 |
| Chloramphenicol [C] | 13 | 3 | 12 |
| Ciprofloxacin [CIP] | 3 | 8 | 17 |
| Clindamycin [DA] | 20 | 3 | 5 |
| Doxycycline [DOX] | 7 | 5 | 16 |
| Erythromycin [ERY] | 6 | 7 | 15 |
| Gentamicin [CN] | 3 | 5 | 20 |
| Linzolide [LNZ] | 28 | 0 | 0 |
| Tetracycline [TE] | 2 | 6 | 20 |
| Trimethoprim-sulfamethoxazole (TMP/SMX) | 10 | 3 | 15 |
| Vancomycin [VA] | 18 | 6 | 4 |
Table (3):
Antimicrobial susceptibility test of E. coli using antibiotic discs in (mm).
| E. coli (Total no. = 20) | |||
|---|---|---|---|
| Sensitive | Intermediate | Resistant | |
| Amikacin [AKN] | 13 | 3 | 4 |
| Amoxicillin/ clavulanic acid [AMC] | 5 | 2 | 13 |
| Cefazoline [CZ] | 4 | 5 | 11 |
| Cefepime [FEP] | 4 | 1 | 15 |
| Cefoperazone [CFP] | 6 | 0 | 14 |
| Ciprofloxacin [CIP] | 3 | 3 | 14 |
| Gentamicin [CN] | 10 | 1 | 9 |
| Imipenem [IMP] | 20 | 0 | 0 |
| Levofloxacin [LEV] | 8 | 1 | 11 |
| Meropenem [MEM] | 20 | 0 | 0 |
| Nitrofurantoin [F] | 9 | 4 | 7 |
Table (4):
Biofilm formation by S. aureus and E.coli with and without P. aeruginosa supernatant.
| S. aureus | S. aureus & supernatant | E. coli | E. coli & supernatant | |||||
|---|---|---|---|---|---|---|---|---|
| No. | % | No. | % | No. | % | No. | % | |
| Non-biofilm former | 1 | 4% | 7 | 28% | 0 | 0 | 0 | 0 |
| Weak biofilm former | 11 | 44% | 18 | 72% | 5 | 33.3% | 8 | 53.3% |
| Moderate biofilm
former |
13 | 52% | 0 | 0 | 6 | 40% | 7 | 46.7% |
| Strong biofilm former | 0 | 0 | 0 | 0 | 4 | 26.7 % | 0 | 0 |
| Total | 25 | 100% | 25 | 100% | 15 | 100% | 15 | 100% |
Table (5):
Primers used in conventional PCR.
| Gene | Direction | Amplicon size (bp) | Primer sequence | Reference |
|---|---|---|---|---|
| Las A | F | 514 | 5\ CGCCATCCAACCTGATGCAAT 3\ | (76) |
| R | 5\ AGGCCGGGGTTGTACAACGGA 3\ | |||
| rhlAB | F | 151 | 5\ TCATGGAATTGTCACAACCGC 3\ | (70) |
| R | 5\ ATACGGCAAAATCATGGCAAC 3\ | |||
| Operon
phz |
F | 448 | 5\ CCGTCGAGAAGTACATGAAT 3\ | (77) |
| R | 5\ CATAGTTCACCCCTTCCAG 3\ | |||
| phzM | F | 875 | 5\ ATGGAGAGCGGGATCGACAG 3\ | (74) |
| R | 5\ ATGCGGGTTTCCATCGGCAG 3\ | |||
| phzS | F | 664 | 5\ TGCGCTACATCGACCAGAG 3\ | (77) |
| R | 5\ CGGGTACTGCAGGATCAACT 3\ |
Molecular detection of lasA, rhlAB, operon phz, phzM and phzS of P. aeruginosa isolates by using conventional PCR
The five virulence genes were detected in 31 P. aeruginosa isolates by conventional PCR technique using the previously mentioned primers and thermal cycling conditions in the materials and methods section. All 31 isolates were positive for lasA, rhlAB, phzM, and phzS genes, and only one isolate was negative for operon phz while the other 30 isolates were positive for it as shown in Figure 1-5.

Figure 1. Agarose gel showing PCR amplicons of lasA gene with a size 514 bp in P. aeruginosa isolates. All lanes were positive samples

Figure 2. Agarose gel showing PCR amplicons of operon phz with a size 448 bp in P. aeruginosa isolates. All lanes were positive samples, except the first lane

Figure 3. Agarose gel showing PCR amplicons of phzM gene with a size 875 bp in P. aeruginosa isolates. All lanes were positive samples
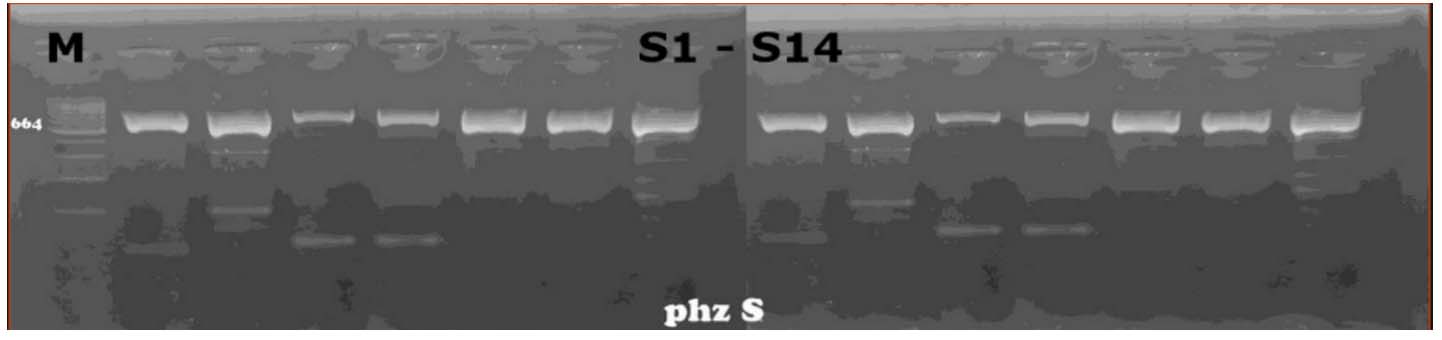
Figure 4. Agarose gel showing PCR amplicons of phzS gene with a size 664 bp in P. aeruginosa isolates. All lanes were positive samples

Figure 5. Agarose gel showing PCR amplicons of rhlAB gene with a size 151 bp in P. aeruginosa isolates. All lanes were positive samples
Biofilm formation and the effect of pseudomonal supernatant on biofilm formation
When the biofilm forming ability of our clinical isolates was investigated using the microtitre plate method, most S. aureus isolates were weak biofilm formers (44%) and moderate biofilm formers (52%). However, E.coli isolates were (33%) weak biofilm formers, and about (40%) were moderate biofilm formers while strong biofilm formers were (26.7%) as in (Table 4). After the addition of P . aeruginosa supernatant to the isolates of S. aureus or E. coli biofilm formation ability decreased. Also, the effect of P . aeruginosa supernatant on S. aureus isolates and changed in biofilm formation by these isolates. Results showed that 4% of S. aureus isolates were non-biofilm former, while 44% of S. aureus isolates were weak biofilm former and 52% of S. aureus isolates were moderate biofilm former. After the addition of P. aeruginosa supernatant to S. aureus isolates, 28% of S. aureus became non-biofilm former and the rest 72% became weak biofilm former as shown in Figure 6,7.

Figure 6. The effect of P. aeruginosa supernatant on biofilm formation of 25 S. aureus isolates

Figure 7. The effect of P. aeruginosa supernatant on biofilm formation of 15 E. coli isolates
Effect of Pyocyanin on S. aureus colonies
The assay detects the effect of pyocyanin extracted from P. aeruginosa with different concentrations (25, 50, and 100 μg/ml) on S. aureus colonies formation, in which P. aeruginosa supernatant derived S. aureus to form SCVs near to the well that was filled with P. aeruginosa supernatant compared to far colonies which appear to be normal and zone of inhibition around the wells with high concentrations (50 and 100 μg/ml). Upon comparing the size of normal cells with SCV cells using the scanning electron microscope technique as shown in Figure 8,9, we found that the diameter of SCV cells is smaller than normal cells. This explains the effect of pseudomonal products on the metabolism and growth of staphylococcal cells.

Figure 8. SEM image showed the size of the normal cell of S. aureus isolate at magnification power 60000x (cell sizes range from 800-900 nm)

Figure 9. SEM image showed the size of SCV cells of S. aureus isolate at magnification power 60000x (cell sizes range from 500-700 nm)
Staphylolytic activity on the culture of S. aureus
All tested isolates showed a decrease in optical density within 120 minutes, this means that the Staphylolytic enzyme produced by P . aeruginosa showed a great effect on S. aureus isolates with different degrees of reduction in optical density, about 57.7% of isolates show a reduction in OD higher than 50%, about 30.8% of isolates show reduction lower than 40% in OD while only 5 isolates show percentage higher than 70% reduction in OD as shown in Figure 10.

Figure 10. The mean optical density for 26 isolates of S. aureus after the addition of P. aeruginosa supernatant
Determination of MIC of Ciprofloxacin, Vancomycin and Gentamicin on S. aureus isolates
Vancomycin, gentamicin, and ciprofloxacin MIC measurements against isolates revealed that 80% of isolates were ciprofloxacin resistant, and 20% were intermediately. After the addition of the supernatant of P. aeruginosa to ciprofloxacin, 62.5% of resistant isolates became sensitive, while 37.5% were still resistant but showed lower MIC than ciprofloxacin alone, the 20% intermediate strains became sensitive after addition of supernatant of P. aeruginosa to ciprofloxacin as shown in Figure 11. In the test of MIC to vancomycin to S. aureus strains 20% were resistant, 60% were sensitive while 20% were intermediate sensitive. After the addition of the supernatant of P. aeruginosa all S. aureus isolates became sensitive as shown in Figure 12. Finally, we tested isolates of S. aureus against gentamicin, 70% of them were resistant to gentamicin, while 30% showed intermediate sensitivity. After the addition of the supernatant of P. aeruginosa all intermediate sensitive isolates became sensitive, while 42.9% of resistant isolates were still resistant and the remaining 57.1% of resistant isolates became sensitive, all these results are shown in Figure 13.

Figure 11. The MIC of ciprofloxacin against 10 S. aureus isolates with and without P. aeruginosa supernatant

Figure 12. The MIC of vancomycin against 10 S. aureus isolates with and without P. aeruginosa supernatant

Figure 13. The MIC of gentamicin against 10 S. aureus isolates with and without P. aeruginosa supernatant
Determination of MIC of Ciprofloxacin and Gentamicin on E. coli isolates
Determination of MIC of ciprofloxacin and gentamicin showed that 100% resistant to ciprofloxacin. After addition of supernatant of P. aeruginosa to ciprofloxacin, 100% of resistant isolates were still resistance but showed lower MIC than ciprofloxacin alone as shown in Figure 14. Also, we tested isolates of E. coli to gentamicin, 100% of them were resistant to gentamicin alone. After addition of supernatant of P. aeruginosa all isolates were still resistant but showed lower MIC than ciprofloxacin alone as shown in Figure 15.

Figure 14. The MIC of ciprofloxacin against 10 E. coli isolates with and without P. aeruginosa supernatant

Figure 15. The MIC of Gentamicin against 10 E. coli isolates with and without P. aeruginosa supernatant
One of the most common nosocomial pathogens to be isolated in our hospitals is P. aeruginosa, so healthcare professionals need to be informed about the rising rate of nosocomial microbial resistance and the effective use of antibiotics to treat such infections.38
Organisms having innate resistance to that antibiotic class, organisms with acquired resistance to antibiotics, and susceptible organisms all contribute to the evaluation of an antibiotic’s spectrum of activity. The therapeutic usage of antibiotics initiates the most crucial resistance mechanisms. Due to the pressure of natural selection brought on by the presence of antibiotics in the bacterial living environment, antibiotic resistance is a form of evolution. Contrary to their adaptability, bacteria only have a small number of mechanisms for developing resistance to different antibiotics: altering the target molecule so that it is no longer recognised by the antibiotic, producing bacterial enzymes that alter the antibiotic molecule, or preventing antibiotic takeover by lowering bacterial cell permeability or by the development of active efflux systems. The simultaneous utilisation of the aforementioned pathways may lead to a phenotype that is resistant to particular antibiotic classes. But the emergence of antibiotic-resistant strains is due to chromosomal DNA alterations (vertical evolution) or the acquisition of foreign genetic material (horizontal evolution).39
In the current study, the resistance of P. aeruginosa to some B-lactam antibiotics was as follow imipenem (26.2%), meropenem (38.1%), ceftazidime (35.7%) and aztreonam (38.1%). In contrast to our results, Kirecci et al., studied patterns of P . aeruginosa strains that were obtained from different clinical isolates’ antibiotic susceptibility and reported higher percentages of resistance than ours against imipenem (100%), meropenem (100%) and ceftazidime (82.7%) (38).
Also, Bertrand et al., reported the resistance results as follow: ceftazidime (21.5%), aztreonam (38.7%) and imipenem (26.9%). While Brown et al., reported that resistance of P. aeruginosa to tested antibiotics in Jamaica and the results listed were as follow: ceftazidime (19.6%) and imipenem (9.8%). On the other hand, Orrett et al., reported antibiotic resistance survey of P. aeruginosa isolated from clinical sources and the results listed were as follow: ceftazidime (20%), aztreonam (9.8%) and imipenem (0%).40
In Egyptian hospitals Saied et al., studied the pathogens that cause nosocomial bloodstream infections have antibiotic resistance in university hospitals and reported the resistance of P. aeruginosa as follow: imipenem (23.5%), aztreonam (70.6%) and ceftazidime (76.5%).41
In our study, we tested ciprofloxacin antibiotic as an example of quinolones to P. aeruginosa and the resistance was (64.2%). While Kirecci et al., reported that resistance was (73.3%).38 In the contrary, Bertrand et al., reported the resistance was (38.3%).40 While Brown et al., reported that resistance of P. aeruginosa was (23.5%).42 Orrett et al., reported the least resistance to ciprofloxacin (11.8%).43 Like our results, in Egyptian hospitals Saied et al., reported the resistance was (64.7%).41
Finally, we tested the resistance of P . aeruginosa to gentamicin and amikacin and it was (50%) and (57.1%) respectively. Like our results Kireçci et al., reported that resistance was gentamicin (54.7%) and amikacin (62.7%).38 Bertrand et al., reported that resistance to amikacin was (22.8%).40 Compared to our results, Brown et al., reported that resistance to amikacin was (0%) and gentamicin (21.6%).42 On the other hand, Orrett et al., reported the resistance to amikacin was (2.5%).43 While In Egyptian hospitals Saied et al., reported that resistance was gentamicin (70.6%) and amikacin (52.9%).41
In our study, all S. aureus isolates tested for susceptibility to some antibiotics as follow: linezolide as an example of oxazolidinone and its resistance was (0%). While when we tested the susceptibility to gentamicin as an example for aminoglycosides the resistance was (71.4%). In the contrary, Onwubiko et al., reported that resistance was (7.6%).44 Similarly, Ayepola et al., reported that resistance of S. aureus to gentamicin was (4.6%).45 While in Egyptian hospitals, EL Kholy et al., reported that the resistance was (57%).46 And the same result reported by Saied et al., that gentamicin resistance was (56%).41
In this study, we tested S. aureus isolates susceptibility for tetracycline and doxycycline and the resistance results were as follow (71.4%) and (57.1%) respectively. On other hand, Onwubiko et al., reported the resistance to tetracycline was (68.8%).44 While in Cairo, Egypt, EL Kholy et al., reported that resistance of S. aureus to doxycycline was (30%).46 On the other hand Saied et al., reported that resistance to tetracycline was (80%).41
In our study, we tested ciprofloxacin antibiotic as an example of quinolones to S . aureus and the resistance was (60.7%). Similarly, Saied et al., reported that resistance was (56%) (41). In comparison to our results, Onwubiko et al., reported that the resistance was (31.1%) (44). Furthermore, in Cairo, Egypt, EL Kholy et al., reported that resistance was (49%).46 Moreover, we use erythromycin as an example of macrolide and the resistance was (53.5%). Similarly, Onwubiko et al., reported the resistance was (47.6%).44 Likewise, in Egyptian hospitals, EL Kholy et al., reported that resistance was (49%).46 While Saied et al., reported that resistance of S . aureus to erythromycin was (48%).41
In this study, the resistance of S. aureus to chloramphenicol was (42.8%). Similarly, EL Kholy et al., reported that resistance was (47%) (46). While Onwubiko et al., reported that the resistance was (38.1%).44 In the current study, we tested the resistance of S. aureus to cotrimoxazole was (53.5%). Likewise, Saied et al., reported that resistance was (48%).41 In the contrary, Onwubiko et al., reported that the resistance was (84.5%).44 Similarly, Ayepola et al., reported that resistance was (84.3%).45 We tested S. aureus susceptibility to levofloxacin as an example of quinolones; the resistance was (55%). In contrast to our results, Ayepola et al., reported that resistance was (5.5%).45 S. aureus resistant to clindamycin in our study was (17.8%). While, EL Kholy et al., reported that resistance was (36%).46 In comparison to our results, Saied et al., reported that resistance of S. aureus to clindamycin was (44%).41 In this study, the resistance of S . aureus to vancomycin was (14.2%). While EL Kholy et al., reported that all isolates were sensitive to vancomycin.46 Also, Saied et al., reported that all isolates were sensitive to vancomycin.41
Antibiotic use in humans and other animals places selection pressure on pathogenic and commensal bacteria, leading to the formation and spread of resistant strains, which is what causes antimicrobial resistance in E. coli.47 In the current study, we tested E . coli isolates for antibiotic susceptibility and use imipenem, amoxicillin/clavulanic acid and cefepime as examples for B-lactams and the resistance was (0%), (65%) and (75%) respectively. On the other hand, Abozahra et al., reported that resistance was imipenem (70%) and cefepime (100%).48 In contrast to our results, Kahlmeter et al., reported the E. coli resistant to amoxicillin/clavulanic acid in Austria in 2008 was (8.9%).49 Similarly, in the same study, the resistance in Greece in 2008 was reported as (4.3%).49
Our present work recorded that we tested the resistance of amikacin and gentamicin as examples of aminoglycosides and the results was (20%) and (45%) respectively. On the other hand, Abozahra et al., reported the resistance of amikacin was (7%) and gentamicin (14%).48 And in comparison, to our results, in Egyptian hospitals, Saied et al., reported resistance to E. coli as follows: amikacin (40.9%) and gentamicin (68.2%).41 We select ciprofloxacin and levofloxacin to represent quinolones in our study and the results of resistance were as following ciprofloxacin (70%) and levofloxacin (55%). In contrast to our results, Abozahra et al., reported the resistance to levofloxacin was (7%).48 Likewise, Kahlmeter et al., reported the resistance to ciprofloxacin in Austria in 2008 was (4.1%) and in Greece in 2008 (5.7%).49 Finally, the resistance of E. coli was tested to nitrofurantoin it was (35%). On the other hand, Delisle et al., reported that E. coli resistance was (4.6%).50 Similarly, Kahlmeter et al., reported the resistance to E. coli in Austria in 2008 was (8.9%) and in Greece in 2008 was (0%).49
Biofilm enhances the adhesion of bacteria to surfaces and shields them from the host immune system and antimicrobial treatment.51 Bacterial biofilm is often associated with long-term persistence of organisms in various environments as it increases the bacterial resistance to antibiotics.32 Among the most bacterial causes of both community-acquired and hospital-acquired illnesses is S. aureus. The capacity of this bacterium to establish a biofilm, a multicellular population that is challenging to eliminate with host defences or antibiotics, on catheters and other indwelling devices, is one factor contributing to the widespread nature of infections caused by this disease.52
In this study, (44%) of S. aureus were weak biofilm former, (52%) were moderate biofilm former and (4%) were non-biofilm former. Similarly, Di Ciccio et al., tested the biofilm formation by S. aureus on polystyrene surfaces and reported that, (44%) of S. aureus biofilm former were weak producer, (44%) of them were moderate producer and (12%) were strong producer.53 In comparison with El-far et al., they reported that (28%) of their isolates were intermediate biofilm former and (72%) of them were strong biofilm former.54
P. aeruginosa supernatant containing rhamnolipids has a great effect on biofilm formation in other bacterial strains, as they inhibit adhesion of competing bacteria and promote biofilm dispersal. According to the Pseudomonas strain and carbon source many different rhamnolipid homologs are produced. In our study, after addition Pseudomonas aeruginosa supernatant containing rhamnolipids to S. aureus biofilms, (51.3%) reduction occurred in biofilm formation. Likewise, Rodrigues et al., reported that (33.8%) reduction occur in their S. aureus isolates after addition of rhamnolipids.55
In contrast, do Valle Gomes et al., reported that after addition of rhamnolipids for 12 hours on S. aureus biofilms, the biofilm formation was reduced to (67.8%,58.5%) according to the (1%, 0.25%) concentration respectively.33
The current work shows isolates of E.coli showed biofilm formation results were as follow: (53.3%) of the isolates were weak biofilm former, while (46.7%) of them were moderate biofilm formers. On the other hand Abozahra et al., reported that (40%) of their E.coli isolates were non-biofilm former, (24.3%) were weak-biofilm former, (32.8%) were moderate-biofilm former and (2.8%) were strong-biofilm former.48 Elsayed et al., reported that the biofilm formation in E.coli isolates were as follows: (23.42%) of E.coli isolates were non-biofilm former, (21.7%) were weak-biofilm former, (10.8%) were moderate-biofilm former and (44%) were strong-biofilm formers.56 This prevalence of biofilm formation among E coli isolates may be due to the major factors associated with uro pathogenic E.coli virulence as fimbrial adhesives, which enhance durability and stimulate innate host responses by mediating attachment to specific receptors.57
In our study, after addition of Pseudomonas aeruginosa supernatant containing rhamnolipids to E. coli biofilm, (23.4%) reduction in biofilm formation occurred. In contrast, Bhattacharjee et al., reported that (55 fold) reduction occurred to their E.coli isolates.58 While Shen et al., reported that rhamnolipids showed (~60%) reduction in the biofilm formation of E.coli isolates.59
Pyocyanin produced during Pseudomonas biofilm formation, enabling P. aeruginosa to successfully compete with other bacteria and even fungi, through blocking the oxidative respiration and inhibiting growth of them.60 In this study we use agar diffusion assay to show the effect of pyocyanin with different concentrations (25, 50 and 100 μg/ml) on S. aureus colonies and cells then confirming the results by using scanning electron microscope. We found that S. aureus colonies became smaller [SCVs] and zone of inhibition was formed around the well containing pyocyanin at high concentrations (50 and 100 μg/ml).
Biswas et al., studied the effect of presence of P. aeruginosa with S. aureus and the ability of S. aureus to convert into SCVs and reported that at concentration 100nM of pyocyanin, colonies become smaller and dispersed and at concentration more than that 200nM of pyocyanin, zone of inhibition surrounded by a zone of SCVs was observed. Noto et al. studies shows the resistance of S. aureus to pyocyanin and found that at higher concentrations, pyocyanin nearly completely inhibited S. aureus growth, with growth being reduced at low concentrations. Despite being typically more tolerant to low quantities of pyocyanin, the SCVs were sensitive to higher concentrations of pyocyanin, with near complete inhibition of growth at (24 μg/ml). In contrast to our results, Leanse et al., reported that pyocyanin potentiate the antimicrobial blue light killing of MRSA, after addition of (6.25 μg/ml) of pyocyanin to MRSA biofilm, the viability of MRSA reduced by 2.84 log10 than 1.28 log10 by antimicrobial blue light only. Increasing the concentration of pyocyanin to (25 μg/mL), improved the antimicrobial effects most dramatically with a 3.62 log10 CFU reduction.
P. aeruginosa secretes a staphylolytic endopeptidase known as LasA protease or staphylolysin that lyses S. aureus cells by destroying pentaglycine in their cell walls.60 It breaks down peptide bonds in proteins or peptides that include Gly-Gly pairs, and just like lysostaphin, it lyses staphylococci by breaking down pentaglycine cross-links in the peptidoglycan of S. aureus cells. Numerous S. aureus strains can be destroyed by LasA protease, and in vitro experiments have demonstrated that it can stop S. aureus cells from growing.
The majority of isolates in the current study (57.7%) showed low level of staphylolytic activity (>30% staphylolysis) and (19%) of isolates showed very high staphylolytic activity (>70% staphylolysis). In comparison to our results, Eid et al., studied certain virulence factors’ phenotypic and genetic characterization in P . aeruginosa strains isolated from different clinical sources in Mansoura University Hospitals and reported the majority (65%) of isolates manifested low levels of staphylolytic activity (≤ 10% staphylolysis). While, higher staphylolytic activity (≥ 20% staphylolysis) was detected in tested strains. During the study of Radlinski et al., on the effect of staphylolysin in treatment of MRSA endophthalmitis he reported that (27.7%) of isolates showed high level of staphylolytic activity (>70 % staphylolysis) and about (22.2%) of isolates manifested low level of staphylolytic activity (<10 % staphylolysis).37
Regarding the MICs of vancomycin, gentamicin and ciprofloxacin for S. aureus, we found that most of S. aureus (80%) were resistant to ciprofloxacin, (70%) of them were resistant to gentamicin and only (20%) of them resistant to vancomycin. After addition of P. aeruginosa supernatant to all isolates, we reported the following results: only 30% of S. aureus isolates were still resistant to ciprofloxacin, 30% of them were resistant to gentamicin and all (100%) S. aureus isolates became sensitive to vancomycin.
On the other hand, Radlinski et al., reported that the majority of P. aeruginosa supernatants were antagonistic towards ciprofloxacin killing and dramatically potentiated vancomycin killing of S. aureus, resulting in (100-1,000) times more killing than the control culture.37 On the other hand, Girard et al., reported that all isolates (100%) were sensitive to ciprofloxacin and also all of them (100%) were sensitive to gentamicin and vancomycin.61
The MIC for E. coli revealed that ciprofloxacin and gentamicin were completely resistant to all of the E . coli isolates. After addition of P. aeruginosa supernatant, all (100%) E . coli isolates were still resistant to ciprofloxacin and gentamicin. As opposed to, Fasugba et al., reported that urinary E . coli isolates between 2009 and 2013 were (6.8%) resistant against ciprofloxacin and (5.2%) were resistant against gentamicin (62). On other hand, Chamoun et al., reported that resistance of E. coli isolates to gentamicin between 2011 and 2013 was (31.2%) and resistance to ciprofloxacin was (27.8%).63
Proteolytic enzymes and pyocyanin have become key characteristics linked to P . aeruginosa pathogenicity because of their variety of biological functions. In the present study, we reported that all 31 (100%) tested P. aeruginosa isolates were to have lasA genes. On other hand, Galdino et al., reported that (85.42%) of tested P. aeruginosa isolates were evidenced to have lasA gene.64 While Finnan et al., reported that lasA gene was positive in (29.4%) of P. aeruginosa isolates.65
On other hand, Fazeli et al., during the studying multidrug-resistant P . aeruginosa virulence gene profiles obtained from hospital infections in Iran, reported that P. aeruginosa isolates that give positive results for lasA gene were as follow: (26%) of isolates were positive.66 In contrast, Pournajaf et al., reported that lasA gene was positive in (26.6%) of total isolates.67 While Najafi et al., reported that lasA gene was positive in (30%) of total isolates.68 On other hand, Mapipa et al., reported that lasA gene was positive in (55.5%) of total isolates.69
In the present study, we reported that all 31 (100%) tested P. aeruginosa isolates were evidenced to have rhlAB gene. Sabharwal et al., reported that rhlAB gene was found to be positive in 50% of strains.70 On other hand, Ertugrul et al., studied some P. aeruginosa virulence genes of isolates from diabetic patients, he reported that rhlAB gene was evidenced in (100%) of all isolates71. Nahar et al., classified P. aeruginosa isolates into gentotypes 1, 2 and 3. His results were as follow: rhlAB gene was positive in (64.29%) of genotype 1 isolates, positive in (100%) of all isolates of genotype 2 and 3.72 By contrast, Berber et al., reported that rhlAB gene was evidenced in (96.2%) of all isolates.73
In the present study, we reported that all 31 (100%) tested P. aeruginosa isolates were evidenced to have phzM and phzS genes, and only one isolate lacked operon phz, while the other 30 (96.7%) isolates were evidenced to have this phz operon.
On other hand Haghi et al., reported that phzM gene was evidenced in (45.1%) of isolates and phzS gene was in (27.9%) of isolates.74 Contrary to our findings, Pournajaf et al., reported that phzS gene was positive in (64.3%) of total isolates.67 While, Abd El-Baky et al., reported that operon phz was evidenced in (80%) of isolates, (40%) of isolates were positive for phzS gene while (73.3%) of isolates were positive for phzM gene.75
Pseudomonas aeruginosa has a great effect on S. aureus and E. coli in vitro; this effect varies from species to another depending on the species and extracellular secretions produced. P. aeruginosa showed great impact on S. aureus isolates resistance to different antibiotics as it facilitates their killing and may drive the normal colonies of S. aureus into SCVs. When S. aureus and E. coli were exposed to Pseudomonas supernatant, their capacity to form biofilm decreased.
ACKNOWLEDGMENTS
The authors would like to thank Dr. Safaa El Mesiry, (Head of Microbiology Department, Damanhour Medical institute) and Dr. Thorya El Belekdar, (Chemist in Microbiology Department, Damanhour Medical Institute) for their unlimited cooperation in collecting isolates from different departments.
CONFLICT OF INTEREST
The authors declare that there is no conflict of interest.
AUTHORS’ CONTRIBUTION
SMA and RRA conceived and designed the study. HMA, IAA, SMA, RRA and SAS conducted the experiments. SMA, RRA, IAA and SAS analyzed the data. SMA, RRA and IAA wrote the manuscript. All authors read and approved the final manuscript for publication.
FUNDING
None.
DATA AVAILABILITY
All datasets generated or analyzed during this study are included in the manuscript.
ETHICS STATEMENT
This study was approved by the Institutional Ethics Committee, Faculty of Pharmacy at Damanhour University, Egypt.
INFORMED CONSENT
Written informed consent was obtained from the participants before enrolling in the study.
- Burmolle M, Ren D, Bjarnsholt T, Sorensen SJ. Interactions in multispecies biofilms: do they actually matter? Trend Microbiol. 2014;22(2):84-91.
Crossref - Flemming HC, Wingender J. Relevance of microbial extracellular polymeric substances (EPSs)-Part I: Structural and ecological aspects. Water Sci Technol. 2001;43(6):1-8.
Crossref - Haw TT, Aziz NAA, Yahaya MA, et al. P-NU005. Nerve cross-sectional area as a surrogate marker of peripheral nerve degeneration in amyotrophic lateral sclerosis. Clin Neurophysiol. 2021;132(8):e118.
Crossref - Jende JME, Hauck GH, Diem R, et al. Peripheral nerve involvement in multiple sclerosis: demonstration by magnetic resonance neurography. Ann Neurol. 2017;82(5):676-685.
Crossref - Federle MJ, Bassler BL. Interspecies communication in bacteria. J Clin Invest. 2003;112(9):1291-1299.
Crossref - Taj MK, Wei YL, Samreen Z, Taj I, Hassani TN, Ling JX. Quorum sensing and its different signals systems in bacteria. Int J Res Appl Nat Soc Sci. 2014;2:117-124.
- James GA, Beaudette L, Costerton JW. Interspecies bacterial interactions in biofilms. J Indust Microbiol Biotechnol. 1995;15(4):257-262.
Crossref - Lewis PM. A note on the continuous flow culture of mixed populations of lactobacilli and streptococci. J Appl Bacteriol. 1967;30(2):406-409.
Crossref - Siebel MA, Characklis WG. Observations of binary population biofilms. Biotechnol Bioeng. 1991;37(8):778-789.
Crossref - Odenyo AA, Mackie RI, Stahl DA, White BA. The use of 16S rRNA-targeted oligonucleotide probes to study competition between ruminal fibrolytic bacteria: development of probes for Ruminococcus species and evidence for bacteriocin production. Appl Environ Microbiol. 1994;60(10):3688-3696.
Crossref - Cheng KJ, McAllister TA, Kudo H, et al. Microbial strategy in feed digestion. In: Journet M, (ed). Recent Advances on the Nutrition of Herbivores. Malaysia: Malaysian Society of Animal Production; 1991. 181-187.
- Pernthaler J. Predation on prokaryotes in the water column and its ecological implications. Nature Rev Microbiol. 2005;3(7):537-546.
Crossref - Clarholm M. Bacteria and protozoa as integral components of the forest ecosystem-their role in creating a naturally varied soil fertility. Antonie Van Leeuwenhoek. 2002;81(1):309-318.
Crossref - Thingstad TF. Elements of a theory for the mechanisms controlling abundance, diversity, and biogeochemical role of lytic bacterial viruses in aquatic systems. Limnol Oceanogr. 2000;45(6):1320-1328.
Crossref - Huber H, Hohn MJ, Rachel R, Fuchs T, Wimmer VC, Stetter KO. A new phylum of Archaea represented by a nanosized hyperthermophilic symbiont. Nature. 2002;417:63-67.
Crossref - McCliment EA, Voglesonger KM, O’Day PA, Dunn EE, Holloway JR, Cary SC. Colonization of nascent, deep-sea hydrothermal vents by a novel Archaeal and Nanoarchaeal assemblage. Environ Microbiol. 2006;8(1):114-125.
Crossref - Jahn U, Hohn MJ, Kronner M, et al. Ignicoccus hospitalis sp. nov., the host of ‘Nanoarchaeum equitans’. Int J Syst Evolut Microbiol. 2007;57(4):803-808.
Crossref - Weinstein RA, Gaynes R, Edwards JR, National Nosocomial Infections Surveillance System. Overview of nosocomial infections caused by gram-negative bacilli. Clin Infect Dis. 2005;41(6):848-854.
Crossref - Lizan-Garcia M, Peyro R, Cortina M, Crespo MD, Tobias A. Nosocomial infection surveillance in a surgical intensive care unit in Spain, 1996-2000: a time-trend analysis. Infect Control Hosp Epidemiol. 2006;27(1):54-59.
Crossref - Haynes Iii A, Ruda F, Oliver J, et al. Syndecan 1 shedding contributes to Pseudomonas aeruginosa sepsis. Infect Immun. 2005;73(12):7914-7921.
Crossref - De Bentzmann S, Roger P, Dupuit F, et al. Asialo GM1 is a receptor for Pseudomonas aeruginosa adherence to regenerating respiratory epithelial cells. Infect Immun. 1996;64(5):1582-1588.
Crossref - Feldman M, Bryan R, Rajan S, et al. Role of flagella in pathogenesis of Pseudomonas aeruginosa pulmonary infection. Infect Immun. 1998;66(1):43-51.
Crossref - Tredget EE, Shankowsky HA, Rennie R, Burrell RE, Logsetty S. Pseudomonas infections in the thermally injured patient. Burns. 2004;30(1):3-26.
Crossref - Lyczak JB, Cannon CL, Pier GB. Lung infections associated with cystic fibrosis. Clin Microbiol Rev. 2002;15(2):194-222.
Crossref - Bradbury RS, Roddam LF, Merritt A, Reid DW, Champion AC. Virulence gene distribution in clinical, nosocomial and environmental isolates of Pseudomonas aeruginosa. J Med Microbiol. 2010;59(8):881-890.
Crossref - Goldufsky J, Wood S, Hajihossainlou B, et al. Pseudomonas aeruginosa exotoxin T induces potent cytotoxicity against a variety of murine and human cancer cell lines. J Med Microbiol. 2015;64(Pt 2):164.
Crossref - Hamdan-Partida A, Sainz-Espunes T, Bustos-Martinez J. Characterization and persistence of Staphylococcus aureus strains isolated from the anterior nares and throats of healthy carriers in a Mexican community. J Clin Microbiol. 2010;48(5):1701-1705.
Crossref - Lestari ES, Severin JA, Filius PMG, et al. Antimicrobial resistance among commensal isolates of Escherichia coli and Staphylococcus aureus in the Indonesian population inside and outside hospitals. Eur J Clin Microbiol Infect Dis. 2008;27(1):45-51.
Crossref - Sadek S-EA, Abdelrahman AT, Abdelkader NG, Abdelrahim MEA. Clinical and microbiological effect of linezolid on methicillin-resistant Staphylococcus aureus (MRSA) colonization in healthcare workers in Egypt. Middle East J Sci Res. 2013;15(10):1440-1449.
- Russo TA, Johnson JR. Proposal for a new inclusive designation for extraintestinal pathogenic isolates of Escherichia coli: ExPEC. J Infect Dis. 2000;181(5):1753-1754.
Crossref - Nataro JP, Kaper JB. Diarrheagenic escherichia coli. Clin Microbiol Rev. 1998;11(1):142-201.
Crossref - Ponnusamy P, Natarajan V, Sevanan M. In vitro biofilm formation by uropathogenic Escherichia coli and their antimicrobial susceptibility pattern. Asian Pac J Trop Med. 2012;5(3):210-213.
Crossref - do Valle Gomes MZ, Nitschke M. Evaluation of rhamnolipid and surfactin to reduce the adhesion and remove biofilms of individual and mixed cultures of food pathogenic bacteria. Food Control. 2012;25(2):441-447.
Crossref - Ralli P. Impaired virulence factor production in a dihydroorotate dehydrogenase mutant (pyrD) of Pseudomonas aeruginosa. United States: University of North Texas; 2005.
- Biswas L, Biswas R, Schlag M, Bertram R, Gotz F. Small-colony variant selection as a survival strategy for Staphylococcus aureus in the presence of Pseudomonas aeruginosa. Appl Environ Microbiol. 2009;75(21):6910-6912.
Crossref - Diggle SP, Winzer K, Lazdunski A, Williams P, Camara M. Advancing the quorum in Pseudomonas aeruginosa: MvaT and the regulation of N-acylhomoserine lactone production and virulence gene expression. J Bacteriol. 2002;184(10):2576-2586.
Crossref - Radlinski L, Rowe SE, Kartchner LB, et al. Pseudomonas aeruginosa exoproducts determine antibiotic efficacy against Staphylococcus aureus. PLoS Biol. 2017;15(11):e2003981.
Crossref - Kirecci E, Kareem RD. Antibiotic susceptibility patterns of Pseudomonas aeruginosa strains isolated from various clinical specimens. Sky J Microbiol Res. 2014;2:13-17.
- Manu D, Lupan I, Popescu O. Mechanisms of pathogenesis and antibiotics resistance in Escherichia coli. Ann Roman Soc Cell Biol. 2011;16(2):7-19.
- Bertrand X, Thouverez M, Patry C, Balvay P, Talon D. Pseudomonas aeruginosa: antibiotic susceptibility and genotypic characterization of strains isolated in the intensive care unit. Clin Microbiol Infect. 2001;7(12):706-708.
Crossref - Saied T, Elkholy A, Hafez SF, et al. Antimicrobial resistance in pathogens causing nosocomial bloodstream infections in university hospitals in Egypt. Am J Infect Control. 2011;39(9):e61-e65.
Crossref - Brown PD, Izundu A. Antibiotic resistance in clinical isolates of Pseudomonas aeruginosa in Jamaica. Rev Panam Salud Publica. 2004;16(2):125-130.
Crossref - Orrett FA. Antimicrobial susceptibility survey of Pseudomonas aeruginosa strains isolated from clinical sources. J Natl Med Assoc. 2004;96(8):1065-1069.
- Nwankwo EO, Nasiru MS. Antibiotic sensitivity pattern of Staphylococcus aureus from clinical isolates in a tertiary health institution in Kano, Northwestern Nigeria. Pan Afr Med J. 2011;8:4.
Crossref - Ayepola OO, Olasupo NA, Egwari LO, Becker K, Schaumburg F. Molecular Characterization and Antimicrobial Susceptibility of Staphylococcus aureus Isolates from Clinical Infection and Asymptomatic Carriers in Southwest Nigeria. PLoS One. 2015;10(9):e0137531.
Crossref - El Kholy A, Baseem H, Hall GS,Procop GW, Longworth DL. Antimicrobial resistance in Cairo, Egypt 1999-2000: a survey of five hospitals. J Antimicrob Chemother. 2003;51(3):625-630.
Crossref - Stapleton PJ, Lundon DJ, McWade R, et al. Antibiotic resistance patterns of Escherichia coli urinary isolates and comparison with antibiotic consumption data over 10 years, 2005-2014. Ir J Med Sci. 2017;186(3):733-741.
Crossref - Abozahra R, Abdelhamid S, Wen MM, Abdelwahab I, Baraka K. A Nanoparticles based Microbiological Study on the Effect of Rosemary and Ginger Essential Oils against Klebsiella pneumoniae. Open Microbiol J. 2020;14:205-212.
Crossref - Kahlmeter G, Poulsen HO. Antimicrobial susceptibility of Escherichia coli from community-acquired urinary tract infections in Europe: the ECO.SENS study revisited. Int J Antimicrob Agents. 2012;39(1):45-51.
Crossref - Delisle G, Quach C, Domingo MC, et al. Escherichia coli antimicrobial susceptibility profile and cumulative antibiogram to guide empirical treatment of uncomplicated urinary tract infections in women in the province of Quebec, 2010-15. J Antimicrob Chemother. 2016;71(12):3562-3567.
Crossref - Sevanan M, Pongiya U, John N. Antimicrobial Susceptibility Pattern of Biofilm Producing Escherichia coli of Urinary Tract Infections. Curr Res Bacteriol. 2011;4:73-80.
Crossref - Valle J, Toledo-Arana A, Berasain C, et al. SarA and not sigmaB is essential for biofilm development by Staphylococcus aureus. Mol Microbiol. 2003;48(4):1075-1087.
Crossref - Ciccio P, Vergara A, Festino AR, et al. Biofilm formation by Staphylococcus aureus on food contact surfaces: Relationship with temperature and cell surface hydrophobicity. Food Control. 2014;50:930-936.
Crossref - El-Far A, Samir S, El-Gebaly E, et al. Assessment of eugenol inhibitory effect on biofilm formation and biofilm gene expression in methicillin resistant Staphylococcus aureus clinical isolates in Egypt. Infect Genet Evol. 2021;89:104722.
Crossref - Rodrigues LR, Banat IM, van der Mei HC, Teixeira JA, Oliveira R. Interference in adhesion of bacteria and yeasts isolated from explanted voice prostheses to silicone rubber by rhamnolipid biosurfactants. J Appl Microbiol. 2006;100(3):470-480.
Crossref - Gawad W, Helmy O, Tawakkol W, Hashem AM. Antimicrobial Resistance, Biofilm Formation, and Phylogenetic Grouping of Uropathogenic Escherichia coli Isolates in Egypt: The Role of Efflux Pump-Mediated Resistance. Jundishapur J Microbiol. 2018;11(2):e14444.
Crossref - Ulett GC, Valle J, Beloin C, Sherlock O, Ghigo J-M, Schembri MA. Functional analysis of antigen 43 in uropathogenic Escherichia coli reveals a role in long-term persistence in the urinary tract. Infect Immun. 2007;75(7):3233-3244.
Crossref - Bhattacharjee A, Nusca TD, Hochbaum AI. Rhamnolipids Mediate an Interspecies Biofilm Dispersal Signaling Pathway. ACS Chem Biol. 2016;11(11):3068-3076.
Crossref - Shen Y, Li P, Chen X, et al. Activity of Sodium Lauryl Sulfate, Rhamnolipids, and N-Acetylcysteine Against Biofilms of Five Common Pathogens. Microb Drug Resist. 2020;26(3):290-299.
Crossref - Hotterbeekx A, Kumar-Singh S, Goossens H, Kumar SM. In vivo and In vitro Interactions between Pseudomonas aeruginosa and Staphylococcus spp. Front Cell Infect Microbiol. 2017;7:106.
Crossref - Girard LP, Ceri H, Gibb AP, Olson M, Sepandj F. MIC versus MBEC to determine the antibiotic sensitivity of Staphylococcus aureus in peritoneal dialysis peritonitis. Perit Dial Int. 2010;30(6):652-656.
Crossref - Fasugba O, Mitchell BG, Mnatzaganian G, Das A, Collignon P, Gardner A. Five-Year Antimicrobial Resistance Patterns of Urinary Escherichia coli at an Australian Tertiary Hospital: Time Series Analyses of Prevalence Data. PLoS One. 2016;11(10):e0164306.
Crossref - Chamoun K, Farah M, Araj G, et al. Surveillance of antimicrobial resistance in Lebanese hospitals: retrospective nationwide compiled data. Int J Infect Dis. 2016;46:64-70.
Crossref - Galdino ACM, Viganor L, Ziccardi M, et al. Heterogeneous production of proteases from Brazilian clinical isolates of Pseudomonas aeruginosa. Enferm Infecc Microbiol Clin. 2017;35(10):630-637.
Crossref - Finnan S, Morrissey JP, O’Gara F, Boyd EF. Genome diversity of Pseudomonas aeruginosa isolates from cystic fibrosis patients and the hospital environment. J Clin Microbiol. 2004;42(12):5783-5792.
Crossref - Fazeli N, Momtaz H. Virulence Gene Profiles of Multidrug-Resistant Pseudomonas aeruginosa Isolated From Iranian Hospital Infections. Iran Red Crescent Med J. 2014;16(10):e15722.
Crossref - Pournajaf A, Razavi S, Irajian G, et al. Integron types, antimicrobial resistance genes, virulence gene profile, alginate production and biofilm formation in Iranian cystic fibrosis Pseudomonas aeruginosa isolates. Infez Med. 2018;26(3):226-236.
- Najafi K, Kafil H, Shokrian S, et al. Virulence genes and antibiotic resistance profile of Pseudomonas aeruginosa isolates in Northwest of Iran. J Pure Appl Microbiol. 2015;9(Spl. Edn. 1):383-389.
- Mapipa Q, Digban TO, Nnolim NE, Nwodo UU. Antibiogram profile and virulence signatures of Pseudomonas aeruginosa isolates recovered from selected agrestic hospital effluents. Sci Rep. 2021;11(1):11800.
Crossref - Sabharwal N, Dhall S, Chhibber S, Harjai K. Molecular detection of virulence genes as markers in Pseudomonas aeruginosa isolated from urinary tract infections. Int J Mol Epidemiol Genet. 2014;5(3):125.
- Ertugrul BM, Oryasin E, Lipsky BA, Willke A, Bozdogan B. Virulence genes fliC, toxA and phzS are common among Pseudomonas aeruginosa isolates from diabetic foot infections. Infect Dis. 2018;50(4):273-279.
Crossref - Nahar N, Asad S, Ahmed T, et al. In silico assessment of the genotypic distribution of virulence and antibiotic resistance genes in Pseudomonas aeruginosa. J Appl Pharm Sci. 2017;7(7):055-061.
- Berber I, Avsar C, Yegin Z, Tekerci M, Civek S. Molecular epidemiology of Pseudomonas aeruginosa clinical isolates. Braz J Infect Dis. 2016;20(2):224-225.
Crossref - Haghi F, Zeighami H, Monazami A, Toutouchi F, Nazaralian S, Naderi G. Diversity of virulence genes in multidrug resistant Pseudomonas aeruginosa isolated from burn wound infections. Microb Pathog. 2018;115:251-256.
Crossref - Abd El-Baky RM, Mandour SA, Ahmed EF, Hashem ZS, Sandle T, Mohamed DS. Virulence profiles of some Pseudomonas aeruginosa clinical isolates and their association with the suppression of Candida growth in polymicrobial infections. PLoS One. 2020;15(12):e0243418.
Crossref - Lomholt JA, Poulsen K, Kilian M. Epidemic population structure of Pseudomonas aeruginosa: evidence for a clone that is pathogenic to the eye and that has a distinct combination of virulence factors. Infect Immun. 2001;69(10):6284-6295.
Crossref - Nowroozi J, Sepahi AA, Rashnonejad A. Pyocyanine biosynthetic genes in clinical and environmental isolates of Pseudomonas aeruginosa and detection of pyocyanine’s antimicrobial effects with or without colloidal silver nanoparticles. Cell J. 2012;14(1):7.
© The Author(s) 2023. Open Access. This article is distributed under the terms of the Creative Commons Attribution 4.0 International License which permits unrestricted use, sharing, distribution, and reproduction in any medium, provided you give appropriate credit to the original author(s) and the source, provide a link to the Creative Commons license, and indicate if changes were made.