

ISSN: 0973-7510
E-ISSN: 2581-690X
Amalnala lake is situated in the Gadchandur town of Chandrapur district in Maharashtra, India. The lake water was turning green in colour in the month of september. This study gives an insight into the causes and factors responsible for the greening of the lake adjacent to Manikgarh limestone mine in the month of September. It was noted that, phosphate concentration in lake water showed rise after July (2020, 2021) and peaked in August (2020, 2021). The phosphates were mainly contributed by organophosphate pesticides such as monocrotophos, profenofos, and chlorpyrifos, which were identified by liquid chromatography triple quadrupole mass spectrometry (LC MS/MS). The rise in phosphates showed complete correlation with the rainfall and chlorophyl a (chl a) content in September (2020, 2021). Similarly, the nitrate concentration of the lake showed peak in August (2020, 2021) followed by the rise in chl a content in September (2020, 2021). Chemical oxygen demand (COD) and biological oxygen demand (BOD) of the lake was calculated and represented in terms of COD/BOD. The COD/BOD were highest in September (2020, 2021). Positive correlation was observed between the pH, total dissolved solids, and electrical conductivity of Amalnala Lake and Amalnala Stream which flows into the lake. This stream mainly carries the contaminants from open cast Manikgarh limestone mines to Amalnala Lake. Chl a was mainly contributed by two dominant species of cyanobacteria, Phormidium species CCALA 726 which was identified by 16S rRNA sequencing and Microcystis aeruginosa which was identified by using the keys given by Desikachary and Komarek and Anagnostidis. This study thus concluded that the pesticides, nitrates, and Amalnala Stream contributed in the growth of cyanobacteria which causes the greening of the lake.
Phosphates, Nitrates, Cyanobacteria, Phormidium, Microcystis, Manikgarh Cement Limestone Mine
Amalnala lake is a freshwater lake situated near the Gadchandur town of Chandrapur district and is located near the foothills of the Manikgarh hills. The lake is surrounded by the agricultural fields and Manikgarh cement limestone mine. The excessive use of the fertilizers and the pesticides in agricultural practices play a role in the nutrient enrichment of the lake.1 This lake is the source of agriculture and drinking water in and surrounding areas. Inland fresh water lakes have low total dissolved solids hence they are widely preferred as a source for the drinking water, domestic usage, and agricultural practices. The excessive use of fertilizers, pesticides in agriculture, detergents from households and harmful chemicals from the industrial waste are the main sources of polluting the water bodies. Hyperaccumulation of these chemicals causes decrease in the dissolved oxygen of the water bodies with the respective rise in biological and chemical oxygen demand. This phenomenon is known as eutrophication.2 It has become a worldwide problem and directly related to the economy of the state. In eutrophication there is the excessive addition of the particulate matter (organic) and the nutrients (inorganic) such as carbon, phosphorous and nitrogen. It causes decrease in the aquatic life, increase in the cyanobacterial and algal population, water turbidity and rise in the sedimentation. One of the harmful effects is the increase in the nitrogen loading which causes to the phytoplankton blooming, anoxia, algal blooms, and brown tides.3 Phosphorous is known to affect the algal population in fresh water.4 Therefore, the nitrogen and phosphorous regulation is essential for the regulation and management of the eutrophic fresh water bodies. Heavy algal blooms affect fishing and their weight often causes damage to the fishing net. Prediction and control of these harmful blooms have been taken seriously by many countries and they spend millions of dollars on it. These things are interdependent on the physiological and chemical parameters of the water bodies which regulate the overall ecology of the system. Many physiological and chemical factors like dissolved oxygen, biological oxygen demand, chemical oxygen demand, phosphate, nitrate, carbonate, bicarbonate, COD/BOD ratio affects the growth of microalgal populations.5
Agriculture is the major nonpoint source of nitrogen and phosphorous rich nutrients in the lakes and rivers. The use of inorganic and organic fertilizers and the pesticides causes excessive building up in the land. The organophosphorus chemicals then by leach out in ground water or by runoff adds into the water body causing pollution.6 Pesticides are generally organophosphorus compounds and are toxic to the aquatic life. They enter the water system and gets accumulated in the food chain. Pesticides are transported from an application area to other locations in the environment through water.7 Pesticides may retard the growth and the metabolism the flora and fauna of the lake. Pesticides can disrupt the endocrine functions of and adversely affect the reproduction of fish and other aquatic ecosystem. The pesticide residue thus gets transferred from the lower level to the higher level and gets biomagnified.8
Cyanobacteria can utilize the organophosphates present in the water bodies as nutrient and grow luxuriantly.9 Certain cyanobacteria are known to favour the growth in alkaline environments and may produce uniform growths called as blooms. Anthropogenic activities and the mining activities (open cast and underground) are responsible for altering the ecology of nearby waterbodies.1 Limestone mines are generally an open-cast mines.10 The mining activities often are responsible for the suspended particulate matter in air and deposition of these materials on ground surface such as CaCO3, heavy metals such as chromium, arsenic, lead, etc. During heavy rainfall this organic and inorganic pollution find its way to the nearby streams and gets deposited in the nearby waterbodies altering the physiological and chemical parameters.11
The Amalnala lake have shown the signs of eutrophication during past years which was also indicated by the greening of the lake water during September to October months. A lake being the source of drinking and domestic purpose water for surrounding villages and the town, it became important to investigate the cause of the greening and find solution to avoid it in future. Thus, this study is an investigation of the greening of Amalnala lake and focuses on establishing a relationship between seasonal variations of the physiological and chemical parameters such as phosphates, nitrates, chlorophyll a content and impact of limestones mines pollution on the greening of lake.
Sample collection
Amalnala lake is situated near the Gadchandur town of Korpana Tehsil, Chandrapur district, Maharashtra, India (Figure 1)1. Samples were collected at five different locations each time during studying physiological and chemical parameters. Total five samples were collected from East (19°41’47″ N; 79°10’12″ E), west (19°41’42″ N; 79°09’21″ E), north (19°41’58″ N; 79°09’45″ E), south (19°41’06″ N; 79°09’20″ E) directions and middle (19°41’31″ N; 79°09’41″ E) of the lake. Water samples were collected and analyzed from these locations from March 2020 to March 2022 (25 months). To study the effects of pH, total dissolved solids, and electrical conductivity, two sites were selected site A (19°40’26″ N; 79°09’09″ E, at Amalnala stream/river) and site B (19°41’58″ N; 79°09’45″ E, at Amalnala Lake) (Figure 1).1 Samples were collected on 1st, 10th and 30th of each month from July to October in 2020 and 2021.
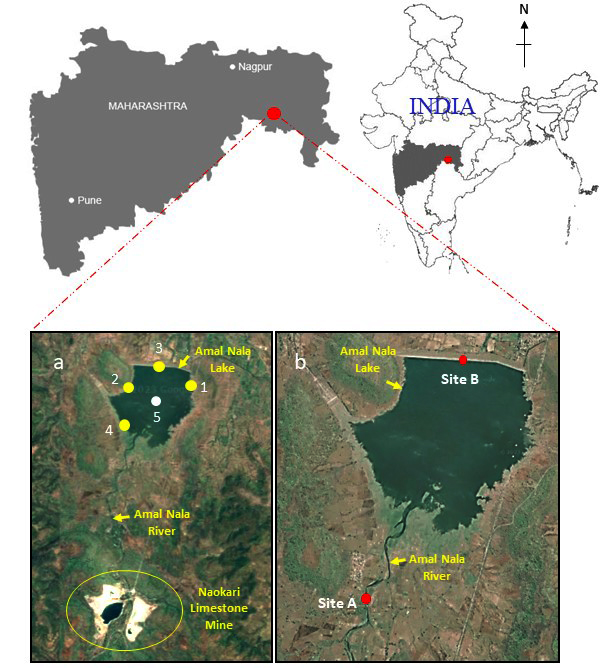
Figure 1. Map of lake Amalnala showing the location of sampling sites.1 The sample collections sites in A, labelled as yellow-coloured points are off-shore collection sites and the white-coloured point is the collection site in open water area. Sample collection sites (Site A and Site B) in B, labelled in red-coloured points are collection points at Amalnala Lake and Amalnala River, respectively
Estimation of physiological and chemical properties
The samples were taken to the laboratory and analysed immediately for physiological and chemical parameters such as pH, total dissolved solids (TDS), electrical conductivity (EC) using portable pH meter, TDS meter and EC meter probe. Dissolved oxygen (DO) was measured with the help of the digital DO meter having the oxygen probe, biological oxygen demand, chemical oxygen demand, phosphate, nitrate was done according the well-established methods.12
Pesticide analysis of lake water
Lake water sample (750 ml) was mixed with sodium chloride (150 g) and shaken vigorously till sodium chloride dissolves completely. To this mixture dichloromethane (100 ml) was added and shaken vigorously for 1 min by releasing pressure intermittently. The lower organic layer was collected in a conical flask and 50 ml of dichloromethane was again added to the sample. This process was repeated for two times. Again the lower layer of organic phase was collected in a conical flask and Na2SO4 (25 gm) was added to the mixture and the flask was shaken till Na2SO4 flows freely. The mixture was concentrated on a rotary evaporator and then transferred into the test tube followed by 3-4 times washing by dichloromethane. Dichloromethane was evaporated on the vaccum rotary concentrator and final volume was made up with acetonitrile for liquid chromatography triple quadrupole mass spectrometry (LC MS/MS) analysis (2 ul). The concentration of the standard taken was 0.1 ppm. The samples were analyzed by the LC MS/MS Shimadzu 8040 (Shimadzu, Japan). The column used was phenomenox-kinetex (2.6 um) C18 100 A, 100 x 3 mm. Gradient separations were performed within 24 min at the flow rate of 0.4 mL min-1 and the column temperature of 40°C (Table 1). The mobile phase A consists of 5 mM ammonium formate in water/methanol (80/20 v/v) and mobile phase B consist of 5 mM ammonium formate in methanol:water (90/10 v/v).
Table (1):
Gradient elution timetable used for the LC-MS method
Time (min) |
% B |
% A |
|---|---|---|
0 |
35 |
65 |
2 |
35 |
65 |
7 |
60 |
40 |
9 |
60 |
40 |
14 |
95 |
05 |
17 |
85 |
15 |
19 |
70 |
30 |
21 |
35 |
65 |
24 |
35 |
65 |
24 |
0 |
100 |
A, 5 mM ammonium formate/methanol (80/20 v/v)
B, 5 mM ammonium formate/methanol (5/95 v/v)
LC, Liquid chromatography, MS, mass spectrophotometry
Isolation and identification of the cyanobacteria in Amalnala lake
The cyanobacteria were identified by two approaches by studying the morphological characters using the standard identification protocols and by the 16S rRNA sequencing of the isolated strain. For studying morphological characters, the samples were studies under compound microscope with 100 X resolution (Acculab, India). For genetic identification, the lake sample was used to isolate the pure culture of the cyanobacteria in BG-11 medium under the continuous illumination at 30°C. Serial dilution method was employed for the isolation of pure cultures. The test tube with 10-6 dilution was selected for the experiment. The petri plates were incubated for 8/16 h light/dark cycles at 29 ± 1°C at 1500 lux fluorescent light. Fully grown colonies were sequenced. DNA of the cyanobacteria was isolated from lake sample using Biopure™ kits for Bacterial genomic DNA isolation. The 16S rRNA gene was amplified by PCR from the above isolated DNA. The primers used for the amplification of 16S rRNA gene were CGGACGGGTGAGTAACGCGTGA (CYA106F) and GACTACTGGGGTATCTAATCCCATT (CYA781R). The PCR conditions were 94°C for 5 min (1 cycle) followed by 94°C for 60 sec (35 cycles), 60°C for 60 sec, 72°C for 60 sec and final extension of 68°C for 10 min. Amplified PCR product was subjected to electrophoresis using Agarose gel 1% along with 1 kb Marker in TAE buffer and visualized by staining with ethidium bromide (Supplementary Figure 1). PCR product was purified by washing with sodium acetate and 70% of ethanol and eluted from the gel. Forward and reverse sequencing reactions of PCR amplicon were carried out on ABI 3730XL sequencer to obtain the sequence. The assembled DNA sequence was used to carry out BLAST with the database of NCBI. The phylogenetic tree was constructed with the help of T-coffee software, EMBL-EBI.13
Determination of the Chl a content
The total Chl a content of the lake water was determined by using a slightly modified protocol of previous study.14 The lake samples were centrifuged at 5000 rpm for 10 min to collect cyanobacterial cells as pellet. The pellet was then redissolved in 100 % ethanol and vortexed. The tube was then incubated at 75°C for 10 min. The samples were then sonicated for 10 min in ultrasonic bath. The mixture was then subjected to centrifuge at 4000 rpm for 10 min. The supernatant was collected and the reading was taken at 665 and 750 nm in UV-vis spectrophotometer (UV-1780, Shimadzu, Japan). The absorbance value at 665 nm is corrected by subtracting absorbance value at 750 nm. The absorbance value greater than 0.010 A.U. is the indication of the nonspecific turbidity. The concentration of Chl a were calculated by applying following formula;
Concentration of Chl a = 11.90 × OD665 × Ve / Vs × I
Where, OD665 is the absorbance at 665 nm; Ve is volume of ethanol (mL); Vs is volume of water sample (Litre); I is the pathlength of the cuvette (cm). The final concentration of Chl a was expressed in µg/L.
Statistical analyses
All data are expressed either as mean ± standard error (SE) or mean ± standard deviations (SD) in different experiments. The statistical analysis was performed using the ‘Multi-Variate Statistical Package’ (MVSP version 3.22). Results are shown as the means of values and SD of independent measurements (n = 5) and a result was considered statistically significant when the p value was < 0.05. The means were compared using one-way ANOVA followed by Duncan’s multiple range tests.15
This study gives an insight into the causes and factors responsible for the greening of the Amalnala lake situated adjacent to Manikgarh limestone mine. The colour of the water was turning green in the month of September. For understanding this phenomenon, the physiological and chemical parameters, variations in phosphates, nitrates and chl a content along with identification of the dominant cyanobacterial species was carried out.
Isolation and molecular identification of most dominant cyanobacterial species
Lake sample was taken back to laboratory and processed within 1 h of collection. Isolation of cyanobacterial colonies was done by spread plate method.16,17 The serial dilution test tube (10-6 dilution) was selected for the isolation of single cell cyanobacteria. The petri plates were incubated for 8/16 h light/dark cycles at 29 ± 1°C at 1500 lux fluorescent light at pH 7.1 for 7 days and 14 days of subculture. The isolated colonies were subculture and examined under microscope for confirming its axenicity (Figure 2). Single colony could be isolated as the pure culture. For more precise identification the culture was sequenced. The isolate was taken for complete 16S rRNA gene analysis. The sequence obtained after the analysis was checked with the BLASTn. The phylogenetic tree was constructed using cladogram. The query sequence and obtained sequence shared a single evolutionary branch. The sequences of KT343916 (Phormidium autumnale BB-1 16S ribosomal RNA gene, partial sequence) and AB003167 (Phormidium ambiguum IAM M-71 gene for 16S ribosomal RNA) share a common evolutionary branch with query indicating their close homology and evolutionary relation. All the other 7 sequences belong to another homologous group sharing a single branch. The obtained 16S rRNA sequence showed the highest nucleotide congruency i.e., 100% sequence identity with the cyanobacteria Phormidium sp. CCALA 759 (Accession number: SUB13777482) (Suppl. Figure 1). Lake water observed under compound microscope, which showed the presence of Microcystis aeruginosa along with Phormidium sp. CCALA 759 as two dominant cyanobacterial species. Microcystis aeruginosa was identified by using the keys given by Desikachary and Komarek and Anagnostidis (Figure 2).18-20
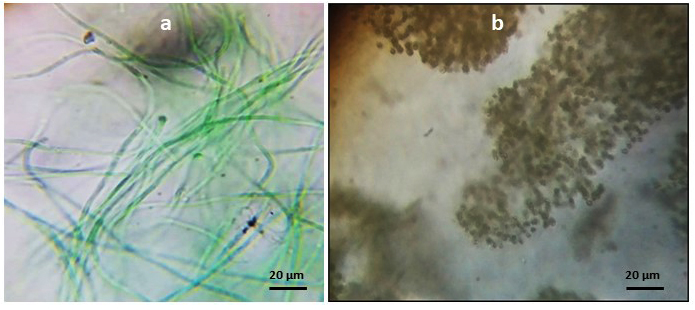
Figure 2. Cyanobacterial strains under microscope. A. Phormidium species CCALA 726, B. Microcystis aeruginosa. Bar 20 µm (A, B)
Role of phosphates on greening of Amalnala lake
Samples taken from Amalnala lake were tested for the presence of the phosphates. The results showed a sharp rise in the phosphate concentration in the month of June which peaked in the August. The data showed two years readings. Both the years data almost showed same results. The phosphate concentration was highest (1.8 and 1.74 ppm in the 2020 and 2021, respectively) in the months of August. The rise in the phosphates is linked to the presence of pesticides in the lake water which was confirmed by LC-MS/MS of water in the month of August. The August month was chosen because of high concentration of phosphates in lake water in this month. The water showed the presence of monocrotophos, hexaconazole, profenofos, chlorpyrifos, cypermethrin (Figure 3, Figure 4 and Table 2). Monocrotophos, profenofos and chlorpyrifos belongs to the class of organophosphate pesticides.21 Monocrotophos is widely applied on cotton, rice, and sugarcane.22 The agricultural fields surrounding the lake dominates in the cotton plantation. Being readily soluble in water and reduced sorption in soil, it leaches into the ground water and may contaminate the water. Apart from this the rainwater may dissolve the topical pesticide and may flow into the lake to lead the increase phosphate concentration of the lake. Profenofos and chlorpyrifos are applied onto the green leafy vegetables and same mechanism applies for these pesticides for their way to lake water.21 Determination of chlorophyll a (chl a) content is widely and most common method to represent the cyanobacterial populations of the water.23 The chl a showed decline and increase in the concentration in the lake water. It started rising from the month of July and peaked at September. The results from both the year showed similarity in their patterns (17.1 and 14.2 µg/ml in 2020 and 2021, respectively). Rise and decline in phosphate and chl a content showed same trends. The highest phosphate content in the month of August served as a nutrition for the Cyanobacteria and the population of cyanobacteria rose in the month of September 2020 and September 2021 (Figure 3). Biological oxygen demand (BOD) and chemical oxygen demand (COD) are the two important factors are pollution indicators of any water body. Higher COD/BOD ratio indicates the pollution of the lake with organic pollutants. Amalnala Lake showed highest COD/BOD of 5.38 in September 2020 and 5.72 in September 2021 (Table 3). These results also support the hypothesis of inflow of pesticides and fertilizers in the lake from surrounding agricultural fields.
Table (2):
Retention time and m/z ratio of the isolated pesticides from the lake sample in August
No. |
Analyte |
tR [min] |
m/z |
|---|---|---|---|
1. |
Monocrotophos |
1.625 |
224.00 > 127.05 |
2. |
Hexaconazole |
15.141 |
314.10 > 70.05 |
3. |
Profenofos |
16.856 |
372.90 > 302.80 |
4. |
Chlorpyrifos |
17.759 |
351.90 > 199.80 |
5. |
Cypermethrin |
19.304 |
433.10 > 190.95 |

Figure 3. Seasonal variations of phosphates, nitrates, rainfall in Amalnala Lake. A is phosphate variations, B is chl a variations and C is the rainfall data of the region. Each value is the mean ± SD from five independent experiments. Mean values are significantly different at P ≤ 0.05 level, n = 5
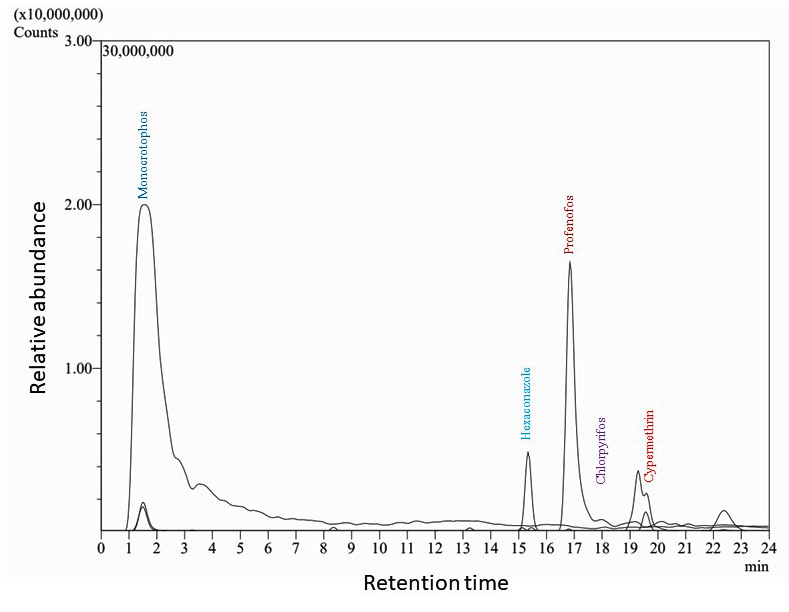
Figure 4. LC MS/MS chromatogram of the Amalnala Lake water sample in the month of September
Nitrates and its effect on the greening of Amalnala lake
Different samples taken from Amalnala lake were tested for the presence of the nitrates. One major source of nitrates water bodies is an excessive use of fertilizers.24 The results showed a rise in the nitrate concentration in June which showed highest concentration in the August. Trends of results remained same for both the years (March 2020 and March 2022). The nitrate concentration was highest in the months of August (0.258 ppm and 0.26 ppm in August 2020 and August 2021, respectively). Nitrogen concentration greater than the normal levels has been a serious concern worldwide. Excessive nitrates act as a toxic pollutant since they are readily soluble in the water. Application of fertilizers in agriculture have contributed tremendously in the increasing the production but at the same time it acts the main source of contamination of water bodies. Overuse of the fertilizers results in leaching of the nitrate rich compounds in the ground groundwater and other waterbodies.25,26 Major crops grown around the lake are pigeon pea (Cajanus cajan L.) and cotton (Gossypium herbaceum) which utilize 10:26:26 (Nitrogen: Phosphorous: Potassium), 20:20:0:13 (Nitrogen: Phosphorous [P2O5]: Sulphur), Urea N-46 etc. as a widely used fertilizers. The monitoring of nitrates is followed by monitoring the cyanobacterial growth by estimating chl a content of the lake water. The chl a showed steady decline and increase in the concentration in different months of the year. It started rising from the month of July and peaked at September. The results from both the year showed similarity in their patterns (17.1 and 14.2 µg/ml in 2020 and 2021, respectively). Rise and decline in nitrate and chl a content showed similar trends. Such correlations are also shown in earlier researches.11,27 The highest nitrate content in the month of August enhances nutrition level of the lake and provided suitable environment for the cyanobacteria to flourish. Thus, the population of cyanobacteria showed rise in the month of September 2020 and 2021 (Figure 3).
Table (3):
Variations in dissolved oxygen, biological oxygen demand and chemical oxygen demand of Amal Nala Lake in year 2020, 2021 and 2022
| Months | Year | DO (ppm)# | BOD (ppm)# | COD (ppm)# | COD/BOD |
|---|---|---|---|---|---|
| Mar | 2020 | 5.01 ± 0.15 e | 3.70 ± 0.02 i | 18 ± 0.10 j | 4.86 |
| Apr | 5.22 ± 0.11 e | 4.20 ± 0.01 e, f | 20 ± 0.09 h | 4.76 | |
| May | 5.11 ± 0.02 e, f | 4.60 ± 0.16 d | 21 ± 0.07 g | 4.56 | |
| June | 4.89 ± 0.01 f, g | 4.90 ± 0.12 c | 24 ± 0.11 d | 4.89 | |
| July | 4.78 ± 0.13 g | 5.20 ± 0.09 a | 26 ± 0.15 c | 5.00 | |
| Aug | 3.74 ± 0.09 j | 5.10 ± 0.08 a, b | 26 ± 0.08 c | 5.09 | |
| Sep | 2.10 ± 0.12 k | 5.20 ± 0.12 a | 28 ± 0.12 a | 5.38 | |
| Oct | 3.80 ± 0.12 j | 4.60 ± 0.15 d | 21 ± 0.07 g | 4.56 | |
| Nov | 5.70 ± 0.09 d | 4.10 ± 0.06 f | 17 ± 0.11 k | 4.14 | |
| Dec | 5.80 ± 0.03 d | 4.02 ± 0.01 f, g | 15 ± 0.13 m | 3.73 | |
| Jan | 2021 | 6.30 ± 0.12 b, c | 3.50 ± 0.13 i | 11 ± 0.17 o | 3.14 |
| Feb | 6.60 ± 0.08 a | 3.64 ± 0.15 i, j | 10 ± 0.14 p | 2.74 | |
| Mar | 5.90 ± 0.09 d | 4.10 ± 0.12 f | 19 ± 0.11 i | 4.63 | |
| Apr | 5.15 ± 0.13 e | 4.32 ± 0.05 e | 21 ± 0.08 g | 4.85 | |
| May | 4.78 ± 0.07 g | 5.20 ± 0.08 a | 23 ± 0.16 e | 4.42 | |
| June | 4.32 ± 0.13 h | 5.26 ± 0.12 a | 27 ± 0.12 b | 5.13 | |
| July | 4.09 ± 0.15 i | 4.95 ± 0.13 b, c | 26 ± 0.21 c | 5.25 | |
| Aug | 3.81 ± 0.09 j | 4.78 ± 0.09 c | 27 ± 0.01 b | 5.64 | |
| Sep | 2.30 ± 0.08 k | 4.89 ± 0.11 c | 28 ± 0.12 a | 5.72 | |
| Oct | 3.85 ± 0.17 j | 4.80 ± 0.13 c | 22 ± 0.09 f | 4.58 | |
| Nov | 5.67 ± 0.15 d | 4.12 ± 0.09 f | 17 ± 0.08 k | 4.12 | |
| Dec | 6.48 ± 0.01 a, b | 4.02 ± 0.07 f, g | 16 ± 0.13 l | 3.98 | |
| Jan | 2022 | 6.28 ± 0.08 b, c | 4.03 ± 0.03 f, g | 12 ± 0.12 n | 2.98 |
| Feb | 6.42 ± 0.09 a, b, c | 3.88 ± 0.04 h | 11 ± 0.09 o | 2.83 | |
| Mar | 6.20 ± 0.12 c | 2.48 ± 0.07 j | 09 ± 0.01 q | 3.75 |
Where, DO, BOD and COD stands for dissolved oxygen, biological oxygen demand and chemical oxygen demand, respectively. Each value is the mean of three independent experiments ± SD and are significantly different at P ≤ 0.05 level. # Means followed by the same letter are not significantly different at 5 % level by Duncan’s test.
Physiological and chemical parameters contribute in growth of cyanobacteria
Manikgarh limestone mine located near the lake produces 6000 tons/day of limestone. These mines are open cast mines and contribute in the air pollution of the region. Limestone mainly composed of calcium carbonate (CaCO3). Open cast mining leads to the emission of dust and deposition of the released particles. Also, the heavy metals trapped in the limestone deposits may leach out and settle on to the surface. The climate of the region is hot and dry except from the month of June to September when south-west monsoon winds contribute in the main rainfall of the region (Figure 3) (CRIS, IMD, India). One of the most important aspects of the region is a perennial Amalnala River flowing across the middle of the mining area. This river is mainly fed by the springs and rainwater. This water is blocked downstream which lead to the formation of Amalnala lake. It is the main source of water supply of the region.28 As suggested by the rainfall statistics of the region samples were taken at the stream at point A and Amalnala lake at point B for the analysis for establishing a relationship between the stream water and lake water relationships. The pH of the stream and lake increased in correlation (R2 = 0.989). These results indicated the interdependence of lake water on the stream. During rainy season, the stream water may act as a source of many alkaline compounds such as calcium carbonates and other alkaline compounds which could have been deposited on the ground-surface from the Manikgarh open cast mining activities. Stream water also showed the positive correlation in terms of the total dissolved solids (TDS) of stream and the lake (R2 = 0.88). This indicated that the stream is carrying the higher amount of TDS into the lake. This data is also supported by studying the electrical conductivity of the stream and lake water simultaneously which also showed the positive corelation (R2 = 0.76). Thus, the stream water carries alkaline total dissolved solids which contribute in enhancing the electrical conductivity of the lake and thus increases the pH of lake towards alkalinity (Figure 5 and 6). Thus, favouring the growth of Phormidium species CCALA 726 and Microcystis aeruginosa (Figure 2). Phormidium species are filamentous and fast growing in nature and shows resilience to highly salty and alkaline conditions (200 g/L salinity and pH 11.2).29,30 Microcystis aeruginosa blooms are to flourish well in elevated pH of 9.2 in the studies conducted at Lake Erie, United States/Canada.31
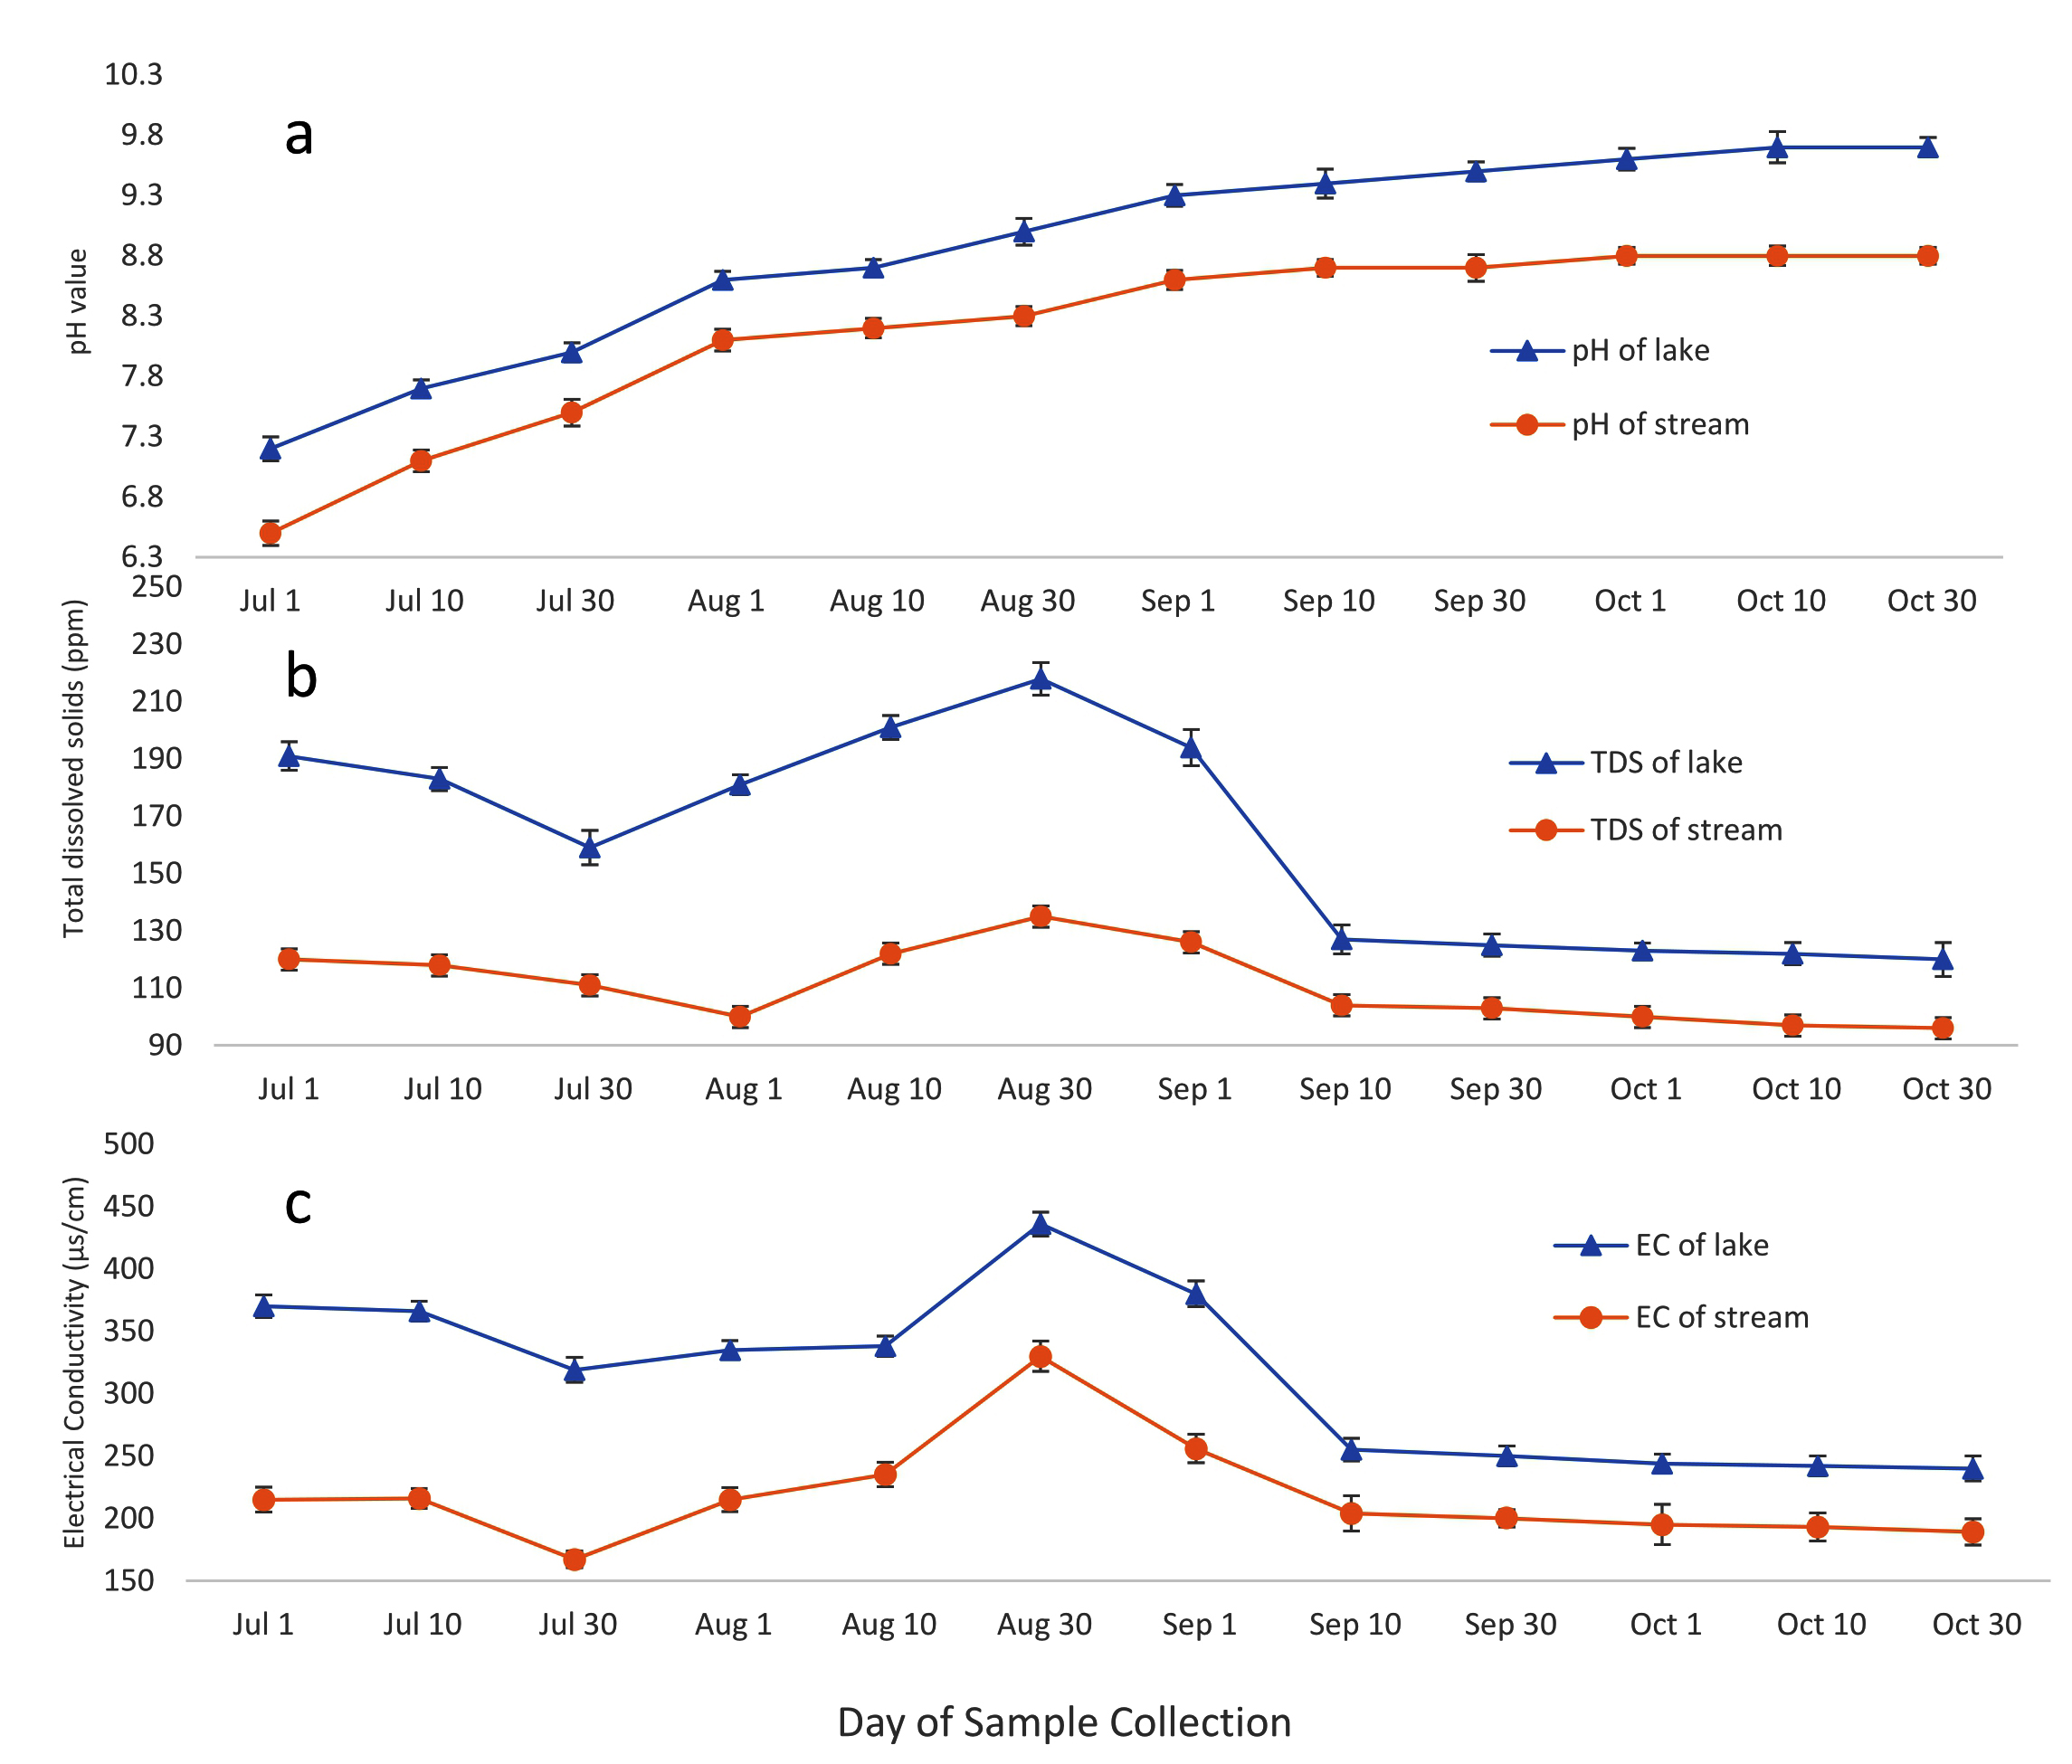
Figure 5. Seasonal variations of pH (A), total dissolved solids (B) and electrical conductivity (C) of the Amalnala Lake and Amalnala River. Each value is the mean ± SD from five independent experiments. Mean values are significantly different at P ≤ 0.05 level, n = 5
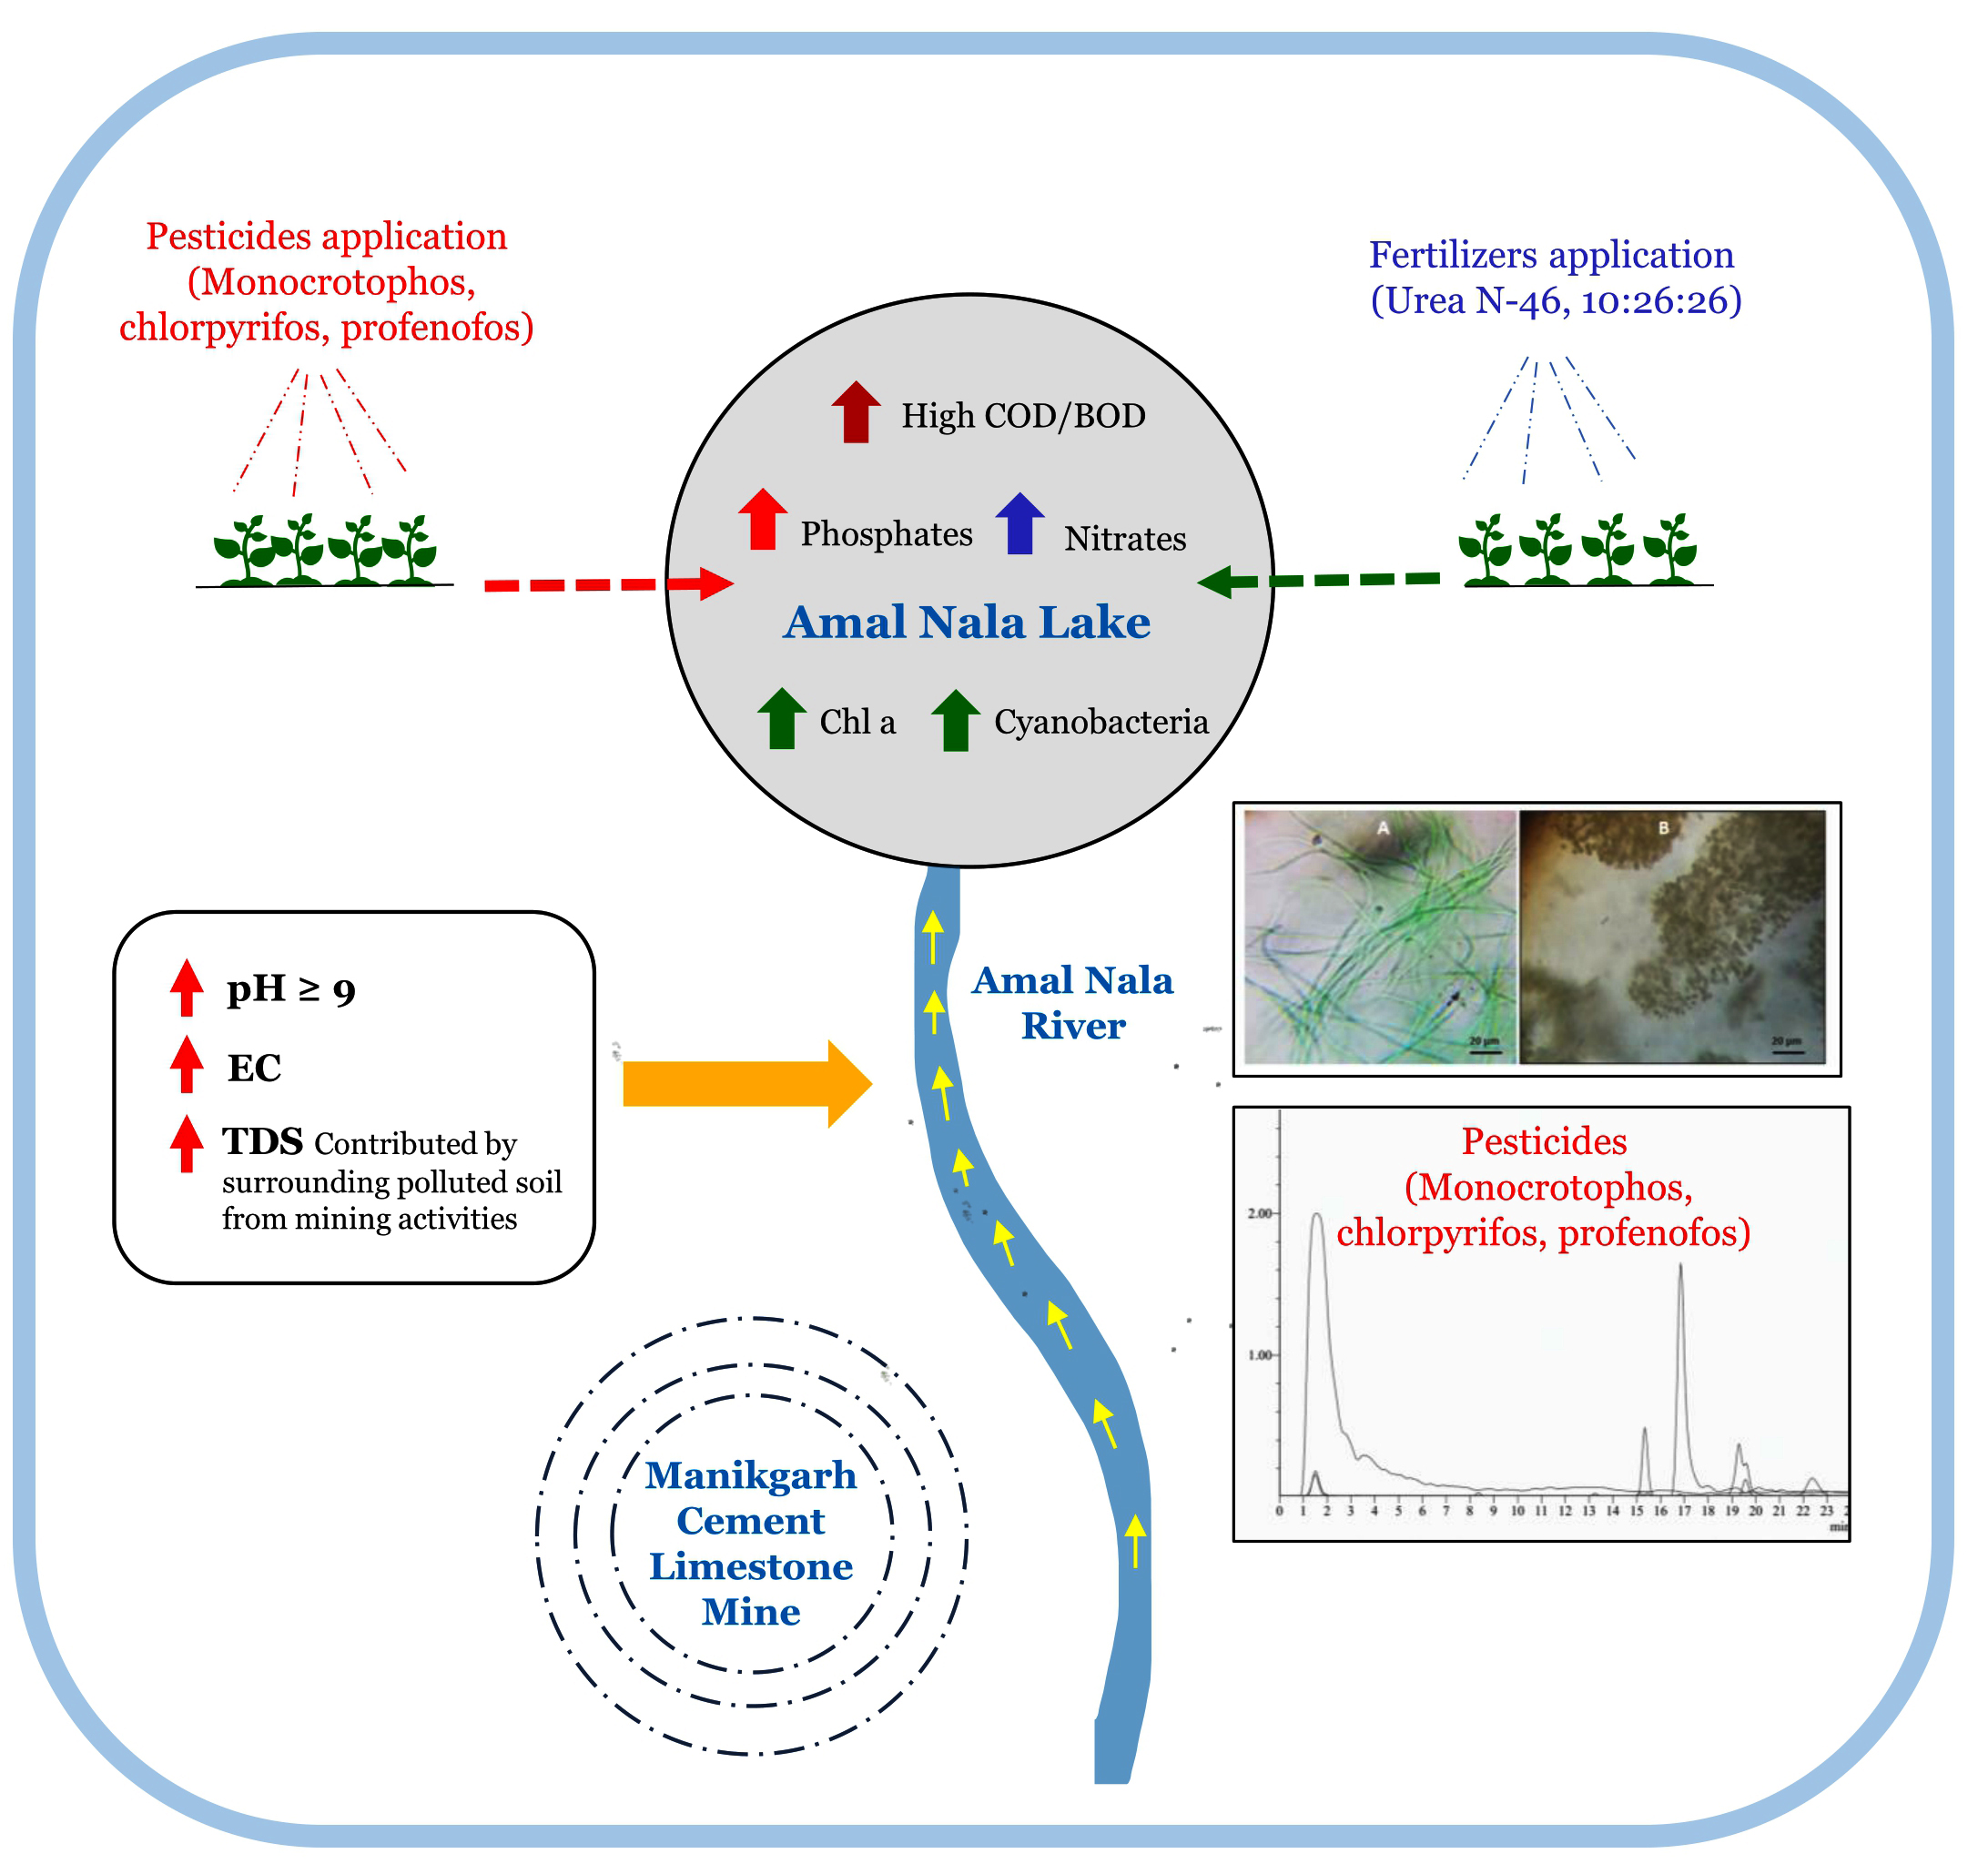
Figure 6. Reasons for greening of Amalnala Lake
Reasons for greening of Amalnala Lake are being discussed in this research. A thorough analysis of the lake water suggests that the pesticides such as monocrotophos, chlorpyrifos and profenofos are responsible for enhancing the phosphate content of the lake water during rainy season (July-September). Similarly, the overuse of fertilizers which are the sources of nitrates also increased during the rainy season. Phosphates and nitrates served as the nutrients for the bloom of Phormidium spp. CCALA 726 and Microcystis aeruginosa. This was correlated by estimating seasonal variations in chl a content of the lake water. The lake is fed by the Amalnala River/stream which flows downstream from Manikgarh hills and adjacent to Manikgarh Limestone open-cast mines and finally into the Amalnala Lake. The surface pollution by limestone mine of nearby areas by alkaline materials are carried away to the stream by run-off water from polluted areas in the rainy season and ultimately it enters the lake by increasing the pH, TDS, and electrical conductivity of the lake. These overall conditions are favourable for the growth of cyanobacteria and greening of the Amalnala Lake.
Additional file: Additional Figure S1.
ACKNOWLEDGMENTS
The authors would also like to acknowledge Mr. Sanjay Pimpalkar for assistance in sample collection, Dr. Shailendra Deo for encouraging and granting permissions for research in laboratory. The authors are also thankful to the Science and Engineering Research Board (SERB), India, for supporting this work in part by a grant [SRG/2021/000440 to U. R. Moon].
CONFLICT OF INTEREST
The authors declare that there is no conflict of interest.
AUTHORS’ CONTRIBUTION
AAD performed statistical analysis. URM designed and performed the experiments. URM and VSW wrote the manuscript. VSW reviewed the manuscript. URM edited the manuscript. URM and VSW read and approved the final manuscript for publication.
FUNDING
None.
DATA AVAILABILITY
All datasets generated or analyzed during this study are included in the manuscript and/or in the supplementary files.
ETHICS STATEMENT
Not applicable.
- Moon UR, Durge AA, Wadhai VS. Greening of Amal Nala Lake, Gadchandur, Chandrapur district (M. S.) – Probable reasons. J Adv Sci Res. 2021;ICITNAS:19-24.
- Klapper H. Control of Eutrophication in Inland Waters, 1st Ed. Ellis Horwood Ltd. Chichester, UK. 1991.
- Hodgkiss IJ, Ho KC. Are changes in N: P ratios in coastal waters the key to increased red tide blooms? Hydrobiologia. 1997;352:141-147.
Crossref - Correll DL. The role of phosphorus in the eutrophication of receiving waters: A review. J Environ Qual. 1998;27(2):261-266.
Crossref - Doucette GJ, Medlin LK, McCarron P, Hess P. Detection and surveillance of harmful algal bloom species and toxins. Harmful Algal Blooms. 2018;1:39-40.
Crossref - Sharpley AN, Rekolainen S. Phosphorous in agriculture and its environmental implication. In: Tunney H, Carton OT, Brookes PC, Johnston AE (eds.) Phosphorous loss from soil to water, 1st Ed. Wallingford, CAB International, UK 1997:1-54.
- Barbash JE, Resek EA. Pesticides in ground water: Distribution, trends, and governing factors. In: Gilliom RJ (eds.) Pesticides in the hydrologic system, Lewis publishers 1996;590.
- Kim SK. Trophic transfer of organochlorine pesticides through food-chain in coastal marine ecosystem. Environ Eng Res. 2020;25(1):43-51.
Crossref - Sankarnarayanan A, Poyil MF, Karruppiah P, Mohideen AP. Effect of physico-chemical parameters on the population diversity of potentially harmful microalgae during post-monsoon season along the Malabar coast. J Pure Appl Microbiol. 2021;15(4):2382-2393.
Crossref - Soni AK. Evaluation of hydrogeological parameters associated with limestone mining: a case study from Chandrapur, India. Mine Water and Environ. 2007;26(2):110-118.
Crossref - Heron J. The seasonal variation of phosphate, silicate, and nitrate in waters of English Lake district 1. Limnol Oceanogr. 1961;6(3):338-346.
Crosserf - Clesceri LS, Greenberg AE, Trussel RR. Standard methods for the examination of water and wastewater. 17th ed. APHA, AWWA, WPCF. 1989.
Crossref - Madeira F, Pearce M, Tivey ARN, et al. Search and sequence analysis tools services from EMBL-EBI in 2022. Nucleic Acid Res. 2022;50(W1):276-279.
Crossref - Yepremian C, Catherine A, Bernard C, Congestri R, Elersek T, Pilkaityte R. Chlorophyll a extraction and determination. Handbook of cyanobacterial monitoring and cyanotoxin analysis. 2016;1:331-334.
Crossref - Moon UR, Sircar D, Barthwal R. et al. Shoot cultures of Hoppea fastigiata (Griseb.) C.B. Clarke as a potential source of neuroprotective xanthones. J Nat Med. 2015;69(3):375-386.
Crossref - Sato N, Katsumato Y, Sato K, Tajima N. Cellular dynamics drives the emergence of supracellular structure in the cyanobacterium, Phormidium sp. KS. Life. 2014;4(4):819-836
Crossref - El-Ibiari NN, El-Ardy O, Salem OMA, Abdelrahman AM. Kinetic study for growth of Phormidium sp. and Chlorella Vulgaris. Int J ChemTech Res. 2015;8:284-289.
- Desikachary TV. Cyanophyta, New Delhi: Indian Council of Agricultural Research. 1959:686.
- Komarek J, Anagnostidis K. Cyanoprokaryota-1. Teil/1st part: Chroococcales. In: S sswasserflora von Mitteleuropa 19/1. Gartner, G, Heynig H, Mollenhauer D, (eds.), Elsevier/Spektrum, Hiedelburg. 1998.
- Komarek J, Anagnostidis K. Cyanoprokaryota-2. Teil/2nd part: Oscillatoriales. In: Susswasserflora von Mitteleuropa 19/2. Edited by: Budel B, Krienitz L, Gnrtner G, Schagerl M. Elsevier/Spektrum, Hiedelburg. 2005.
- Bhamdare H, Pahade P, Bose D, et al. Detection of most commonly used pesticides in green leafy vegetables from Sagar, India, using direct injection hybrid micellar liquid chromatography. Sample Prep Adv. 2022;2:100015.
Crossref - Singh S, Kumar V, Kanwar R, Wani AB, et al. Toxicity and detoxification of monocrotophos from ecosystem using different approaches: A review. Chemosphere. 2021;275:130051.
Crossref - Wojtasiewicz B, Ston-Egiert J. Bio-optical characterization of selected cyanobacteria strains present in marine and freshwater ecosystems. J Appl Phycol. 2016;28:2299-2314.
Crossref - Singh S, Amith AG, Kumar V et al. Nitrates in the environment: acritical review of their distribution, sensing techniques, ecological effects, and remediation. Chemosphere. 2021;287(Part 1):131996.
Crossref - Sebilo M, Mayer B, Nicolardot B, Pinay G, Mariotti A. Long-term fate of nitrate fertilizer in agricultural soils. Proc Natl Acad Sci USA, 2013;110(45):18185-18189.
Crossref - Dahan O, Babad A, Lazarovitch N, Russak EE, Kurtzman D. Nitrate leaching from intensive organic farms to groundwater. Hydrol Earth Syst Sci. 2014;18(1):333-341.
Crossref - Lin SS, Shen SL, Zhou A, et al. Assessment and management of lake eutrophication: A case study in lake Erhai, China. Sci Total Environ. 2021;751:141618.
- Singh KKK, Chauhan RKS. Exploration of subsurface strata conditions for a limestone mining area in India with ground penetrating radar. Environ Geol. 2002;41:966-971.
Crossref - Ataeian M, Vadlamani A, Haines M, et al. Proteome and strain analysis of cyanobacterium Candidatus “Phormidium alkaliphilum” reveals traits for success in biotechnology. iScience. 2021;24(12):103405.
Crossref - Kupriyanova EV, Cho SM, Park YI, et al. The complete genome of a cyanobacterium from a soda lake reveals the presence of the components of CO2 -concentrating mechanism. Photosynth Res. 2016;130(1-3):151-165.
Crossref - Zepernick BN, Gann ER, Martin RM. Elevated pH conditions associated with Microcystis spp. blooms decrease viability of the cultured diatom Fragilaria crotonensis and natural diatoms in Lake Erie. Front Microbiol. 2021;12:598736.
Crossref
© The Author(s) 2024. Open Access. This article is distributed under the terms of the Creative Commons Attribution 4.0 International License which permits unrestricted use, sharing, distribution, and reproduction in any medium, provided you give appropriate credit to the original author(s) and the source, provide a link to the Creative Commons license, and indicate if changes were made.