

ISSN: 0973-7510
E-ISSN: 2581-690X
Bacterial cellulose (BC) stands out as a prominent biopolymer of global importance, distinguished by its unique advantages over plant-derived cellulose. Strains such as Acetobacter xylinum, renowned for their proficient BC production, draw considerable attention in both commercial and biomedical areas. This research aimed to selectively isolate cellulose-producing bacteria with enhanced efficiency from a variety of fruit samples utilizing a cost-effective methodology. A total of 60 fruit samples were selected, and the assessment focused on 17 strains derived from rotten banana, red apple, green apple, and pineapple samples. The evaluation encompassed an examination of bacteriological traits and cellulose synthesis, with subsequent identification of strains achieved through DNA extraction and 16S rRNA PCR analysis. The experimental findings reveal cellulose-producing strains, including model A. xylinum (KCCM 40407) obtained from the Pharmacy lab of COMSATS University Islamabad Abbottabad Campus, Pakistan, designated as number 2, serving as a control. Notably, strains isolated from deteriorated fruits (samples 1, 4, 8, 11, 12, and 15) demonstrated the capacity to produce soluble cellulose. A. xylinum (model strain 2) was cultured under static conditions in HS media, demonstrating remarkable efficacy for cellulose sheet production. Subsequent characterization employing scanning electron microscopy (SEM), Fourier-transform infrared spectroscopy (FT-IR), and X-ray diffraction (XRD) unveiled a nano-fiber mat featuring multi-layered fibers. This eco-friendly approach has the potential for large-scale, high-quality cellulose production, applicable in biomedical and industrial fields. The research highlights an environmentally sustainable and economically viable method for cellulose production, presenting potential applicability across biomedical and industrial arenas on a significant scale.
Acetobacter xylinum, Bacterial Cellulose, Rotten Fruits, Bacterial Identification, 16SrRNA Sequencing, Multi-layered Fibers
Cellulose stands out as the most affordable, abundant, and easily accessible carbohydrate polymer on a global scale.1,2 It is produced by plants and various microorganisms, particularly a multitude of gram-negative bacteria, and is characterized by the chemical formula (C6H10O5). Cellulose produced from microorganisms such as bacterial cellulose (BC) possesses distinctive features, including high purity, biocompatibility, high crystallinity, moldability, biodegradability, excellent water retention capacity, high polymerization, substantial mechanical strength, non-toxicity, and ease of manipulation during biosynthesis.3-6 In contrast, cellulose harvested from plants contains impurities such as lignin, pectin, and hemicellulose.7 Therefore, BC emerges as a preferred alternative, finding applications in industrial waste treatment and biomedical sciences, including drug delivery systems, tissue engineering, wound dressings, medical implants, and transdermal applications.1,8-10 Furthermore, BC exhibits an impressive array of physical, mechanical, and biological characteristics, making it superior to plant cellulose.1,11-17 Additionally, Various genera of bacteria, including Achromobacter, Agrobacterium, Pseudomonas, Acetobacter, Rhizobium, Azotobacter, Sarine, and Alcaligenes, can synthesize cellulose.18 Among them, Acetobacter xylinum is recognized as the most active producer of pure cellulose, garnering significant attention from researchers over the past decades.19-21 Likewise, A. xylinum predominantly produces cellulose in static culture conditions at the liquid surface interface, regulated by the supply of carbon and air into the medium. Notably, BC production can be enhanced by extending growth time and optimizing C-H bonding.22 The production of cellulose by A. xylinum presents unique advantages and opens avenues for further research and development of cellulose-based products across various applications.
The objective of this study was to isolate and identify efficient cellulose-producing bacterial strains. We aimed to employ low-cost and eco-friendly methods for this purpose. These methods included utilizing various rotten fruit sources or molecularly identifying model bacterial strains. The identified strains were then used to synthesize cellulose by employing advanced techniques. Subsequently, we analyzed the properties of the cellulose sheets produced. The main goal was to assess the potential for large-scale production and explore applications in both medical and industrial domains.
In general, this research makes a notable contribution to cellulose synthesis through an environmentally friendly and cost-effective approach. Furthermore, the study offers valuable insights into the variety of bacterial communities present in decaying fruits while demonstrating outstanding efficiency in the synthesis of cellulose sheets within a short duration under static conditions in HS media.
The rest of this paper is organized as follows: Section 2 presents materials and methods. Section 3 provides results and discussion. Section 4 concludes the whole work.
Chemical reagents
The reagents employed in the experiments were sourced exclusively from Al-Rowad (AR) Est Company in Saudi Arabia (KSA). Instruments utilized were generously provided by the laboratory of King Fahad Medical Research Centre (KFMRC) at King Abdulaziz University, KSA, as detailed in the subsequent sections.
The composition of the GEY agar media, along with the respective suppliers, is outlined below:23
- D-Glucose 2.0% (LOBA Chemie, India).
- Yeast extract 1.0% (Techno Pharmachem, India).
- Ethanol 5% (Sigma-Aldrich, US).
- Calcium carbonate (CaCO3) 0.3% (Celtic, UK).
- Agar powder 1.7% ( Hi-Media, India).
The modified HS media, as presented by Hungund and Gupta (2010) and previously interpreted by Hestrin Schramm, encompasses:
- D-(+) Glucose monohydrate 2.0% (w/v) (Loba Chemie, India).
- Bacteriological peptone 0.5% (w/v) (Hi-Media, India).
- Citric acid anhydrous 0.15% (w/v) (Mp Biomedicals, France).
- Di-sodium hydrogen phosphate anhydrous 0.27% (w/v) (Sigma-Aldrich, US).
- yeast extract 0.5% (w/v) (Hi-Media, India).24
- For plating, agar is added to HS media composition according to the volume of the media i.e., for 100 ml, 1.75 (w/v) of agar (Hi-Media, India) is used.9,25,26
The Phosphate buffer solution (PBS) was made for serial dilution comprised of sodium chloride (NaCl) (8 g), Potassium chloride (KCl) (0.2 g), sodium phosphate dibasic (Na2HPO4) (1.44%), potassium phosphate monobasic (Na2H2PO4) (0.245) from Pharmaceutical Solution Industry, KSA, with (7.4) in 1000 ml.27
Equipment used in procedure
Some of the major equipment used in our experiments include the following:
Autoclave (Sanyo Electric, Japan), laminar flow cabinet (Lab Tech, Japan), shaker (Dragon Lab, China), vortex (Labman, UK), incubator (Memmert, Germany), water bath (lab House, China), oven (Lab Tech, Korea), centrifuge (Hettich Mikro 220), Spectrefuge (Labnet Intl. Inc, US), MultiGene Thermal cycler (Labnet Intl. Inc, US), vertical electrophoresis unit (SCIS-PLAS, UK), transilluminator (DATHAN Scientific Co, Ltd, Korea) and Nano-drop 2000c spectrophotometer (Thermo Scientific, UK), Scanning electron microscopy (SEM) (JOEL JSM- 7600F, Tokyo, Japan), Fourier transform infrared microscopy (FT-IR) ( Spectrum 100, Perkin Elmer, USA) and X-ray diffraction (XRD) (X-pert pro-Philips, PAnalytical, Netherlands).
Samples collection
For the isolation of cellulose producing bacteria, samples of rotten fruits from various countries, i.e. Italy, KSA (Jizan region), Africa, Pakistan, and Egypt, were collected from Jeddah supermarket KSA. All the samples were stored in the refrigerator at 4°C. Rotten samples including banana, apple, orange, pear, papaya, kiwi, watermelon, plum mango, and pineapple along with the bacterial culturing strain A. xylinum (KCCM 40407) were obtained from Pakistan.
Media preparation
Bacterial growth assessment involved the utilization of two distinct types of media under both experimental conditions. Furthermore, the preparation of specialized media, termed HS media, involved the use of various chemicals and reagents, while another medium employed in the study is known as GEY agar media.
Isolation of bacteria
About sixty samples from various rotten fruits were taken to investigate them for cellulose synthesis. The samples collected in Saudi Arabia were sourced from different regions, namely KSA (Jizan region), Italy, Egypt, Africa, and Pakistan. This selection was based on previous research indicating that deteriorated fruit samples are an excellent reservoir for cellulose-degrading bacteria.28-32
The process of isolation of bacteria was carried out as given below:
- To synthesize cellulose from decayed fruits, 1 gram of each sample from all rotten fruits was placed in a 250 ml flask, which contained 90 ml of phosphate-buffered saline (PBS) solution. This process was conducted within a laminar flow cabinet, and the mixture was shaken for 2 hours in a shaker operating at 160 to 170 rpm.
- A volume of 1 ml from each flask was extracted and transferred to a 15 ml falcon tube, where it was combined with 9 ml of phosphate-buffered saline (PBS) solution. The mixture was vortexed and subsequently subjected to serial dilution, spanning up to seven dilutions. The pH level of the PBS solution was 6.
- A standard HS and GEY agar media were prepared to analyze the result for growth media.
- The last serially diluted tube of each sample was selected and vortexed for 1 minute.
- The selected samples were then poured onto petri plates with size (8.2 cm ׳ 8.2 cm) through the pour plate method.
- The samples were then transferred into the incubator and cultured statically at 28°C (optimum temperature) for 2 to 3 days minimum.
Biochemical characterization of bacterial isolates
Samples were gathered from each plate and subjected to Gram staining using the three staining steps discussed in the preceding section. This process was employed to analyze the bacteriological properties of the samples. A drop of the sample was placed on a glass slide and evenly spread across the slide’s surface using a loop. After allowing the smear to air dry, it was fixed by microwaving for 30 seconds, creating a biofilm. Subsequently, the smear was stained with a few drops of crystal violet solution for 1 minute, followed by thorough washing with distilled water. Subsequently, a few drops of Gram’s iodine were applied for 1 minute, followed by another round of washing with distilled water, and the smear was allowed to air dry. Next, the smear underwent a 30-second wash with 95% ethanol, followed by another rinse with distilled water. The process concluded with staining using safranin for 1 minute, further washing with distilled water, and a final air-drying period of 1 minute. Following this Gram staining procedure, the slides were collected and examined under a compound microscope.33
Following characterization, a single loopful of each isolate was transferred into 9 ml tubes containing HS and GEY broth media (devoid of agar) and then statically incubated at 28°C for seven days. After incubation, slants were prepared for all bacterial colonies using autoclaved glass slant tubes and stored in the refrigerator at 4°C. Colonies from each slant were subsequently gathered and introduced into tubes containing 5 ml of HS media for activation.
Out of all the samples, approximately 17 were chosen based on suspicion of cellulose production. These selected samples were then inoculated into 5 ml of liquid HS media in conical tubes and incubated for seven days at 28°C. A liquid interface pellicle was formed by only seven of the samples, specifically banana (indicated by numbers 1 and 8), model strain (indicated by number 2), red apple (indicated by numbers 4 and 12), and pineapple (indicated by numbers 11 and 15). Subsequently, these samples were re-cultured and subjected to further analysis.
These strains exhibited the synthesis of cellulose in a dissolved form, which demonstrated solubility in the media. Among the strains, only one exhibited efficient cellulose sheet production, namely the culture of Acetobacter xylinum identified as number 2, obtained from Pakistan. Notably, bananas and apples were predominantly employed in our study due to their favorable outcomes, characterized by distinct clear zones and robust colony growth, surpassing the performance of other selected samples.
DNA isolation
About 1 ml of bacterial culture from each activated sample overnight was transferred into 1.5 ml tubes and centrifuged at 10000 rpm for five minutes. The supernatant was discarded, and the pellets were re-suspended in 200 µl of TES buffer. The suspension was pipetted up and down, followed by vortexing. Subsequently, 20 µl of lysozyme (10 mg/ml) was added, and the mixture was vortexed again. The resulting solution was then incubated in a hot water bath for one hour at 37°C. Afterward, the samples were incubated again for one hour in a water bath after adding 20 µl (10 mg/ml) of proteinase k. After cooling for five minutes, 250 µl of sodium acetate was added and centrifuged at 8000 rpm for five minutes. The clear zone was then transferred into a new tube and 30µl chloroform isoamyl was added to it with ten times inversion and centrifugation at 8000 rpm. Subsequently, the tubes were kept at -4°C in the freezer for five minutes. The aqueous phase collected was transferred into another tube by adding isopropanol in equal volumes to it and kept overnight to prepare it for DNA extraction at -20°C. All the samples were then incubated in a downward position for ten minutes followed by centrifugation at 10000 rpm for five minutes. Furthermore, the pallets were washed with 70% ethanol and centrifuged again at 10000 rpm for five minutes. Elution buffer (30 µl) was added, and pallets were allowed to dry at room temperature for ten minutes to dissolve DNA completely.
In the next step of preparation of gel for separating the DNA fragments 1% of agarose gel was used. About 70 ml of Tris-Acetate EDTA (TAE) buffer, and 0.5 g of agarose (NORGEN BIOTEK CORP, CANADA) were added into a flask and heated up in a microwave on medium-high power for three minutes till the level became 50 ml and the agarose dissolved completely. After cooling for five minutes, staining dye ethidium bromide (EtBr) (InvitrogenTM, US) (3-5 µl) was added to the solution to visualize the DNA before setting the solution and then transferring it into the gel tray followed by placing the gel tray into gel rack with insertion with comb at either side of the gel. The gel was left to fall to room temperature and solid. Then. the gel was submerged into a 1 x TAE buffer.
About 10 µl of samples were then taken and mixed with 2 µl of loading dye by pipetting upend down to avoid air bubbles. The samples were finally added to the wells. For determination of sample size, a 1 kb ladder was used, and then electrophoresis was performed for 30 minutes at 120 v (Solis Biodyne, ESTONIA).34
After isolation, the concentration (Conc) of DNA was checked with a nano-drop 2000c spectrophotometer. In the process of evaluating conc, the type of nucleic acid was DNA. The wavelength was (220-350 nm) while the standard unit was (ng/µl). For resetting the pedestal, 1 µl of D2O was added on top of it and then gently wiped to make sure that it was clean of any other sample. And the, 1 µl of DNA of each sample was loaded carefully at the top of the pedestal for measuring the quantity.
PCR amplification of 16S rRNA and screening
Following the extraction of DNA, the next step involves amplifying the 16S rRNA gene using polymerase chain reaction (PCR) in individual PCR-domed cap tubes with volumes ranging from 0.2 to 0.5 ml. This approach is employed to enhance the precision and efficacy of the results. Based on the manufacturer’s guidelines, the amplification process utilized GoTag Green PCR Master Mix 2X, 60 nmol of each primer, 100 ng AL DNA template, and nuclease-free water. This procedure was conducted in MultiGene thermocyclers and Eppendorf tubes, employing cycles of denaturation, annealing, and strand elongation at various temperatures. Initially, a denaturation step was carried out at 94°C for 5 minutes, followed by 25 cycles of DNA denaturation at the same temperature for 3 seconds. This denaturation process serves to separate the double-stranded DNA into two single strands. Subsequently, the temperature was lowered to 57°C for 30 seconds to facilitate primer annealing. At 72°C, strand elongation occurred for 90 seconds, allowing Taq polymerase to replicate the single-strand DNA. The final step involved elongation at the same temperature of 72°C for 10 minutes, after which the PCR product was analyzed.
For gel electrophoresis analysis, approximately 3 µl of each sample was loaded into the wells of a 1% agarose gel containing ethidium bromide. The electrophoresis process ran for 30 minutes for visualization of the PCR product.
Genome sequencing
Following collection, each sample housed in PCR tubes underwent purification. The 16S rDNA samples were subsequently dispatched to MACROGEN sequencing company, Inc. in Seoul, Korea, for genome sequencing. The sequencing process utilized the automated sequencer ABI 3100 (Applied Biosystems), coupled with the BigDye Terminator Kit v. 3.1 (Applied Biosystems). Sequencing was conducted using the primers 27 F (5′ AGAGTTTGATCMTGGCTCAG – 3′) and 1492 R (5′- TACGGYTACCTTGTTACGACTT -3′).
Once the sequencing was completed, the obtained samples underwent editing procedures using Vector NTI Suite 9 software.
Basic Local Alignment Search Tool (BLAST)
The Basic Local Alignment Search Tool (BLAST) was employed for comparison with the National Center for Biotechnology Information (NCBI) in a programmatic approach. All sequences went through the NCBI BLAST search tool at http://blast.ncbi.nlm.nih.gov to identify non-random sequence similarities. Specifically, the BLAST search focused on 16S ribosomal RNA sequences. During the BLAST search, each sequence was individually subjected to analysis. The hit with the lowest expect-value, indicating multiple non-random alignments, was selected. To ensure the reliability of BLAST outputs, the Blast algorithm parameter was adjusted, reducing the expected threshold to a more stringent value of 1e-6. This precise setting ensured that the Blast results were guided by a lower expected value (e-value), enhancing the precision of the analysis.
Biosynthesis and drying of cellulose from Acetobacter xylinum (Model Strain)
Colonies or cultures derived from Petri plates containing Acetobacter xylinum (model strain), recognized as a promising cellulose-producing strain, were selected. These cultures were then inoculated into a 500 ml bottle filled with 300 ml of liquid HS media using a sterilized loop. The mixture was thoroughly combined and left undisturbed for five to six days at 28°C under static conditions in an incubator. Alternatively, a second method involved pouring approximately 10 ml of the culture directly into a bottle containing 300 ml of liquid HS media, giving it a gentle shake, and incubating it at the same temperature.
Cellulose sheets with dimensions of 7.5 cm x 1.5 cm and a thickness of 1.2 cm formed at the liquid media interface. Selected sheets were transferred to autoclaved; air-locked rectangular containers filled with double-distilled water. The sheets underwent several washes with double-distilled water within a laminar flow cabinet over two to three weeks to eliminate any remaining bacterial colonies. After this thorough washing, the sheets were autoclaved until they achieved sufficient stiffness and were devoid of bacterial colonies, preparing them for further use in the experiment.
The autoclaved cellulose sheets were then placed in an oven for 18 hours at 100°C for drying. The wet and dry weights of the cellulose sheets were measured. Mechanical grinding was employed to convert all dry sheets into powder, and the net weight of the cellulose sheets was determined. Subsequently, the powdered cellulose sheets were collected in a 50 ml falcon tube, yielding a net weight of 7 grams after completely drying in the oven at 100°C for 18 hours.
Characterizing Acetobacter xylinum (Model Strain) synthesized cellulose
The powdered sheets were collected in a 50 ml falcon tube and subjected to scanning electron microscopy (SEM) using a JOEL JSM-7600F instrument from Tokyo, Japan, operated at 5.0 kV. This analysis allowed for the observation of the surface morphology of the BC sheets, presenting images at various magnification levels. Simultaneously, Fourier transform infrared microscopy (FT-IR) was employed to scrutinize the chemical composition of the sheets. The analysis was conducted using a Perkin Elmer spectrophotometer, recording the spectrum between 3339 cm–¹ and 1056 cm–¹.
To assess the crystallinity of the BC sheets, X-ray diffraction (XRD) was performed using a Panalytical X’PERT PRO diffractometer. The X-ray diffraction patterns were recorded at distinct diffraction peaks of cellulose I, specifically at 2 values approximately around 14.5°, 16.5°, and 22.5°. These values were attributed to the planes of (1 1 0), (1 1 0), and (2 0 0) as reported in the literature.35-38
Isolation and identification of bacterial isolates
The fruit samples analyzed comprised a variety, including 4 samples of pineapples, 9 fully rotten red apples, 2 half-rotten red apples, 14 fully rotten bananas, 2 half-rotten bananas, 4 yellow plums, 5 green apples, 4 kiwis, 5 red plums, 3 pears, 2 papayas, and 6 watermelons, as depicted in Figure 1. It is important to note that all procedures were meticulously carried out under a laminar flow cabinet to ensure a controlled environment and prevent contamination.
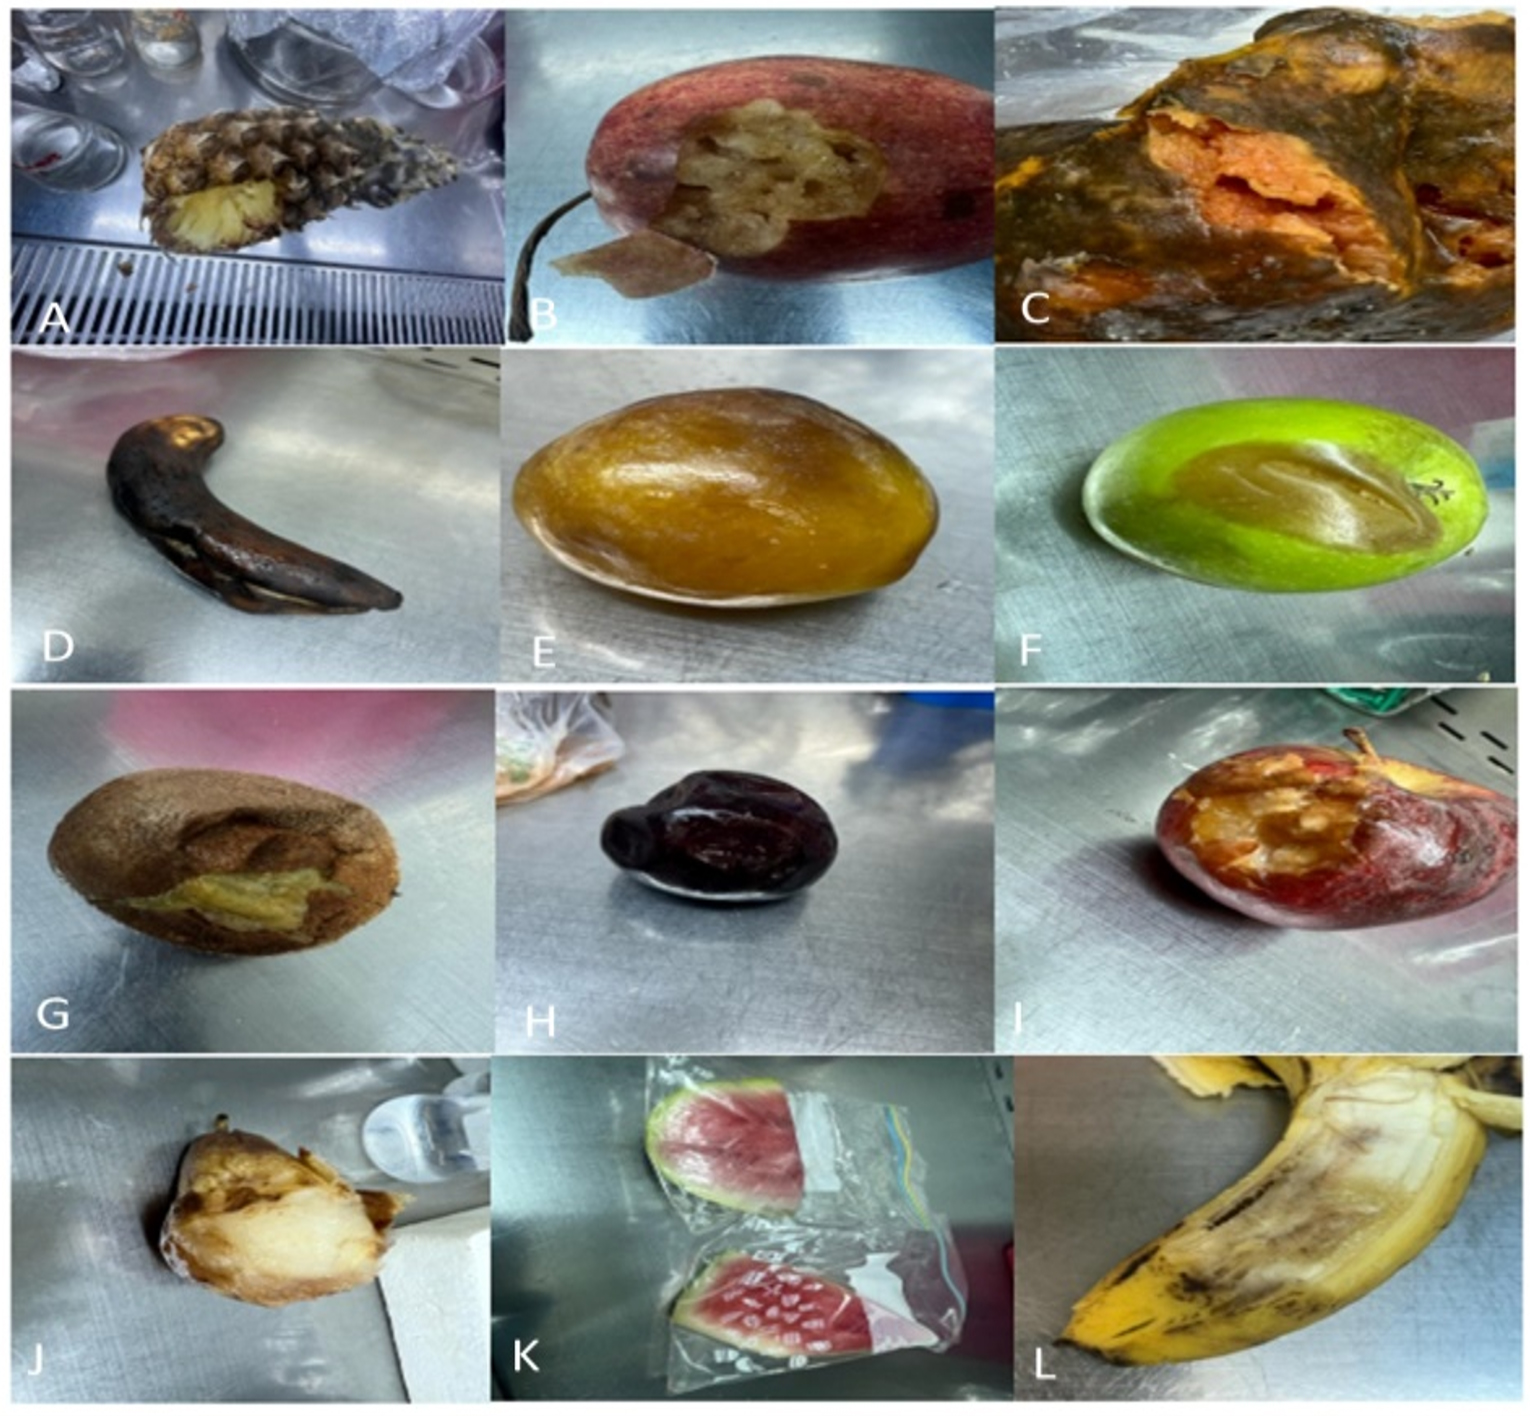
Figure 1. Rotten fruit samples with quantities: (A) Pineapple (4), (B) Fully rotten red apple (9), (C) Papaya (2), (D) Fully rotten Banana (14), (E) yellow Plum (4), (F) Green Apple (5), (G) Kiwi (4), (H) Red plum (5), (I) half rotten Red apple (2) (J) Pear (3), (K) Watermelon (6), and (L) Half rotten banana (2).
Following the incubation period, bacterial colony growth was observed on all plates from both types of media. The colonies were subsequently isolated from both media, as illustrated in Figure 2.

Figure 2. A, B, C, D, E, F, G, H, I, J, K, L, M, and N represent bacterial colony growth of samples on petri plates of both media. After incubation, these colonies were isolated from both media
Morphological characterization
All colonies that developed on HS and agar media plates at 28°C within the 48 to 72-hour timeframe were carefully chosen and documented for their morphological characteristics, including shape and size. Notably, the strain later identified as Acetobacter xylinum strain number 2 exhibited distinct features in terms of polysaccharide secretion compared to other samples. These colonies displayed a broader distribution on the media and exhibited projections inside the media. However, an interesting observation was made: the same strain’s colonies exhibited more evident growth on HS media compared to agar media.
Biochemical characterization
Gram staining was conducted as part of the biochemical characterization of all samples, involving the preparation of bacterial samples and subsequent microscopic examination. The majority of the samples exhibited a pink coloration, indicating their identification as gram-negative bacteria. The results revealed that a predominant portion of the samples belonged to the bacillus category, as depicted in Figure 3.
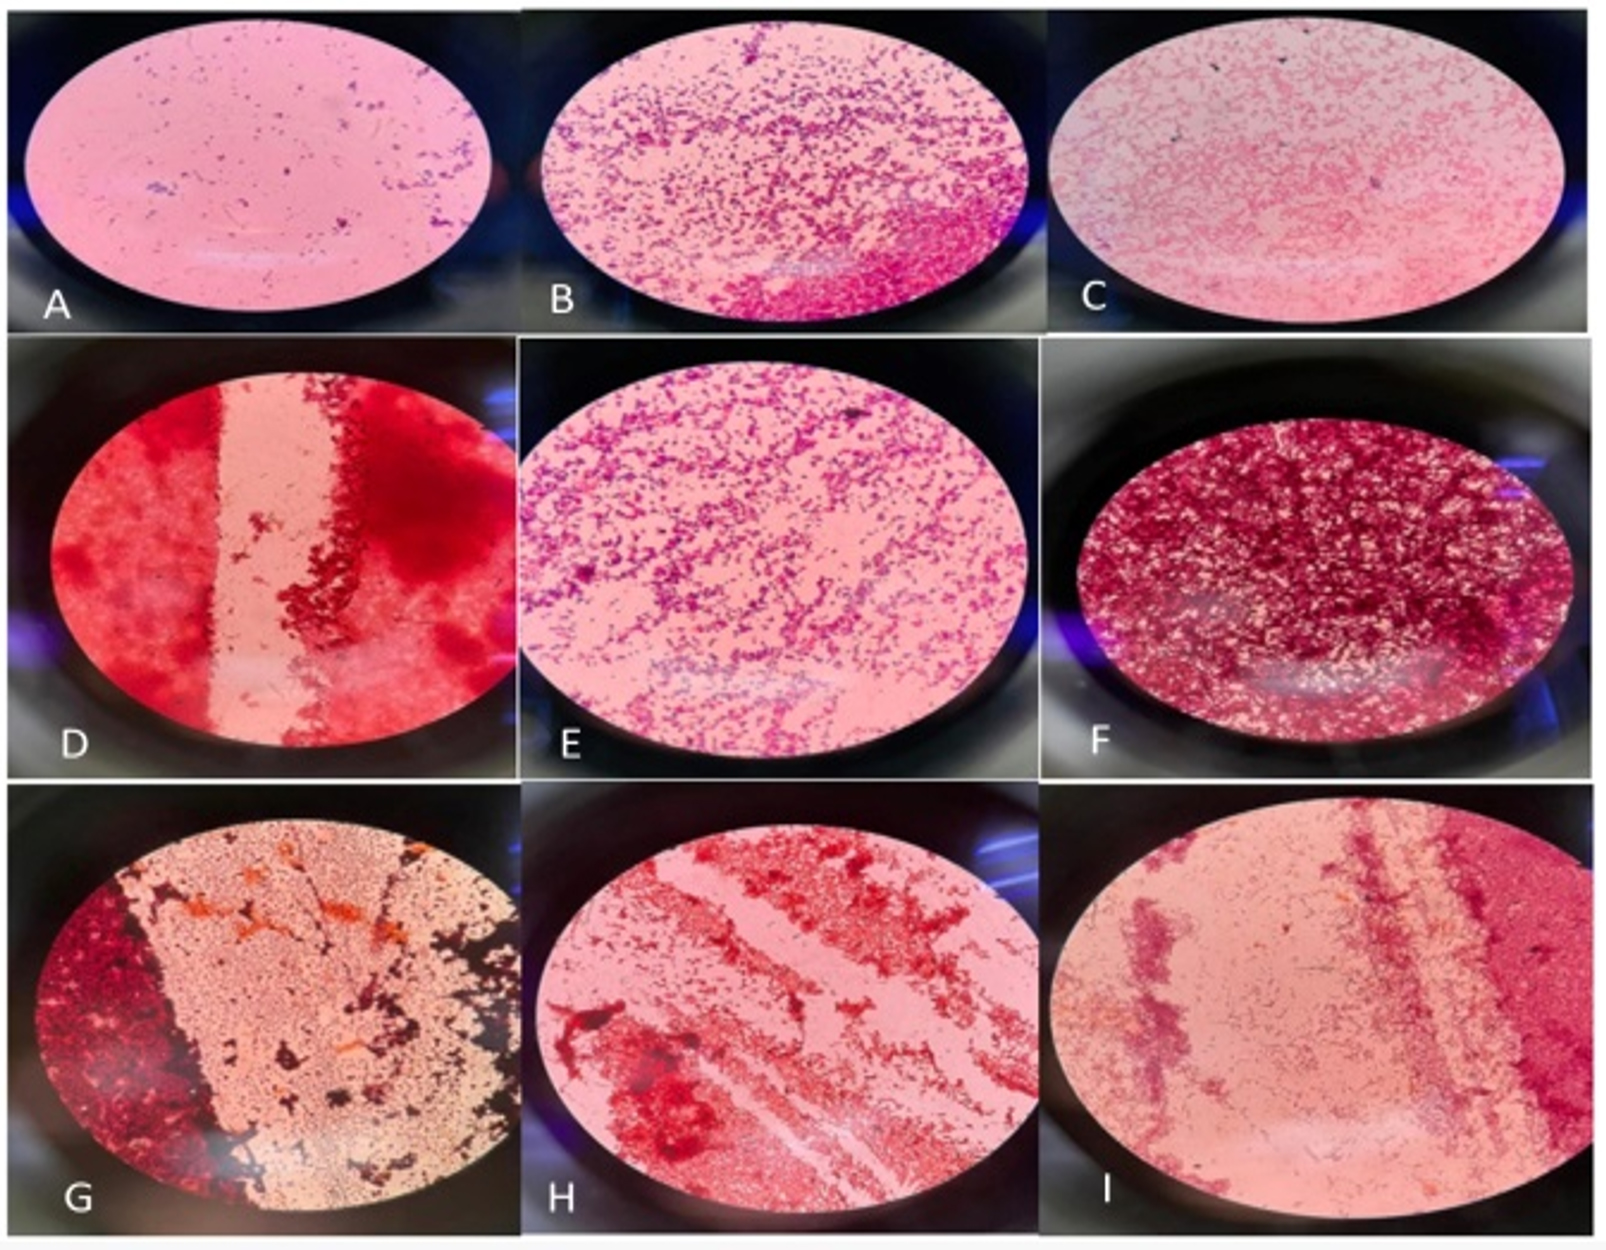
Figure 3. Microscopic view of gram-stained bacterial samples isolated from rotten fruits
The majority of the samples exhibited a pink coloration, indicating their identification as gram-negative bacteria. Moreover, the results indicated that most of the samples were identified as bacillus strains.
In addition, when comparing the cells of all samples, bacterial strains synthesizing cellulose demonstrated more distinct zones on HS media compared to other samples. These cellulose-synthesizing strains also displayed projections on the interior side of the media, as illustrated in Figure 4.

Figure 4. A and B represent the growth of colonies from the Acetobacter xylinum strain. A shows colonies growth from the lower side of the petri plates while B shows the culture growth from above. C represents the prepared and preserved slants of rotten fruit samples in culture tubes. Cellulose-synthesizing bacterial strains have shown clearer zones on HS media as compared to other samples
Molecular identification of bacterial strains through DNA isolation and PCR amplification of 16s rRNA gene
Genomic DNA extraction
The extracted DNA was subjected to electrophoresis, revealing distinct bands when screened under a UV transilluminator. The clear visualization of bands indicates the successful isolation of DNA for the analysis of all selected bacterial strains, as depicted in Figure 5.
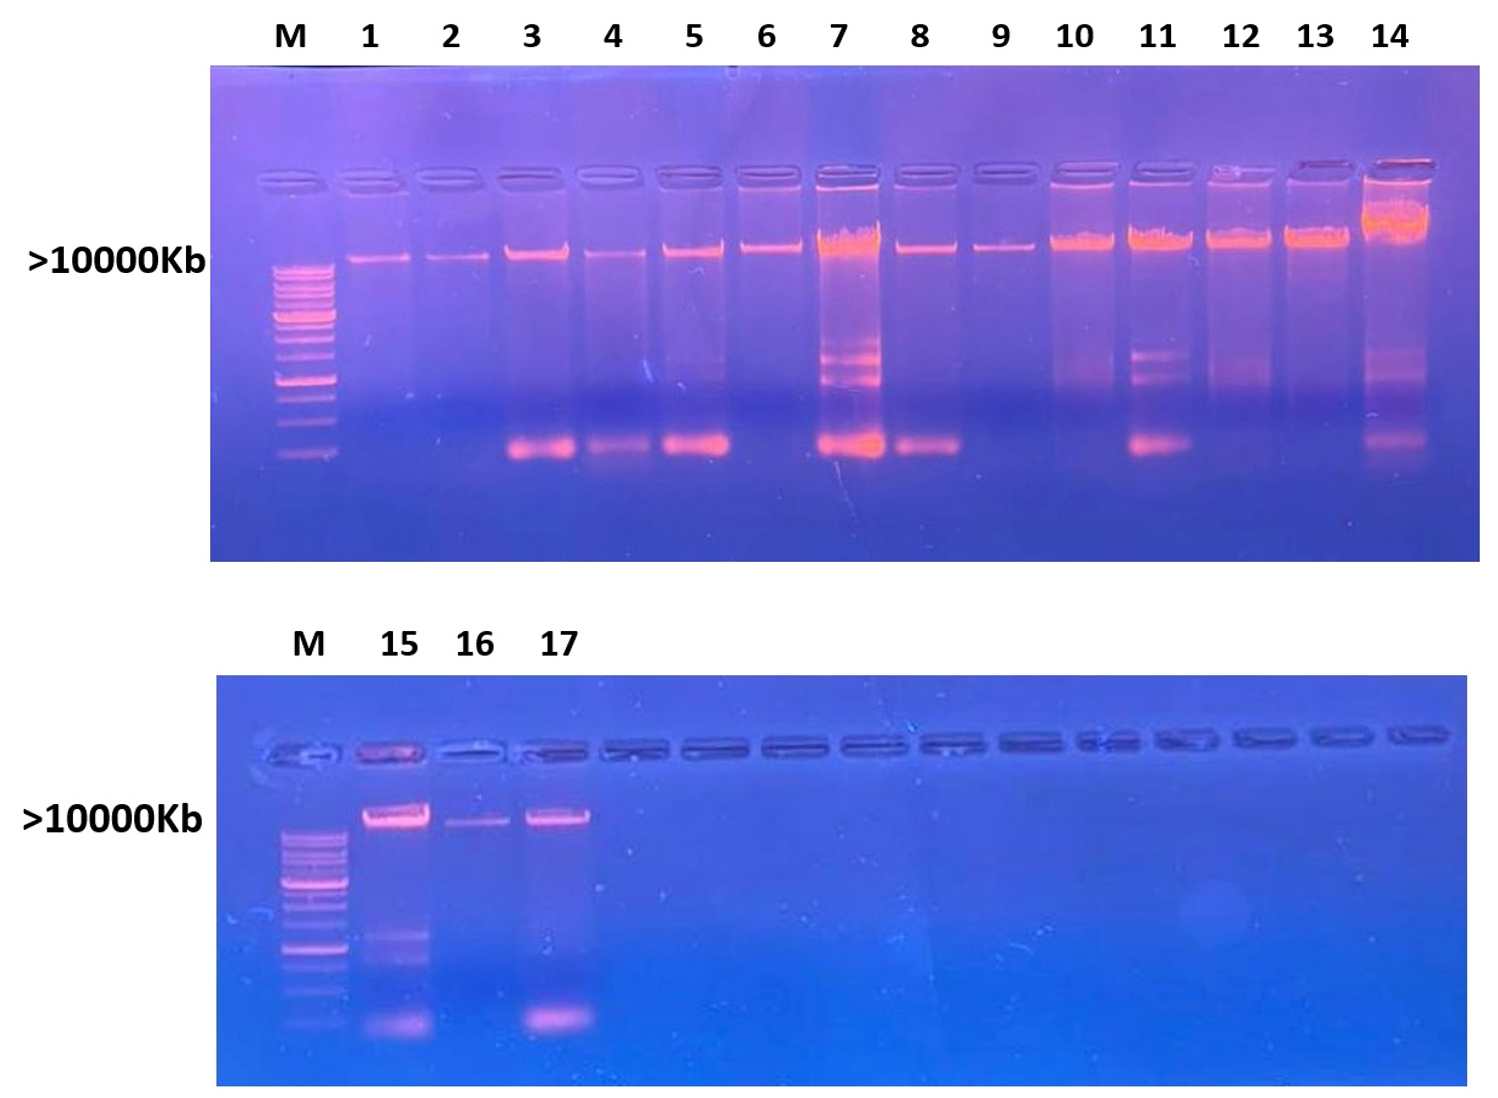
Figure 5. Agarose Gel electrophoresis shows screening of isolated DNA bands (M: DNA molecular weight marker greater than 10,000 Kb. Lane represents bacterial strain as (1) Gluconate xylinum 1, (2) Acetobacter xylinum 2, (3) Levilactobacillus brevis, (4) Acetobacter okinawensis 1, (5) Zymobacter palmae 1, (6) Pseudomonas paraversuta 1, (7) Fructobacillus tropaeoli, (8) Acetobacter okinawensis 2, (9) Zymobacter palmae 2, (10) Pseudomonas paraversuta 2, (11) Gluconobacter xylinum 2, (12) Acetobacter xylinum 1, (13) Klebsiella pneumonia, (14) Klebsiella variicola, (15) Acetobacter Okinawensis 3, and (16) Leuconostoc citreum.
In this study, a total of 17 samples were initially isolated. However, following the results from the BLAST analysis, sample 15 (banana) did not exhibit significant similarity with any sequences in the NCBI database. Consequently, bacterial isolate names were assigned for the remaining 16 samples. The names provided earlier were identified after the completion of genome sequencing.
Quantification of DNA
Analysis with nano-drop shows a good concentration of DNA that was enough for extracting 16s rRNA from each sample as shown in Table 1.
Table (1):
DNA concentration (ng/μl) isolated from bacterial culture using nano-drop 2000c spectrophotometer
Sample # |
Bacterial Strain Names |
Nucleic Acid (ng/μl) |
|---|---|---|
1 |
Gluconobacter xylinum 1 |
379.5 |
2 |
Acetobacter xylinum strain 2 |
268.2 |
3 |
Levilactobacillus brevis |
161.8 |
4 |
Acetobacter okinawensis 1 |
291.9 |
5 |
Zymobacter palmae 1 |
166.7 |
6 |
Pseudomonas paraversuta 1 |
200.3 |
7 |
Fructobacillus tropaeoli |
423.5 |
8 |
Acetobacter okinawensis 2 |
123.1 |
9 |
Zymobacter palmae 2 |
63.3 |
10 |
Pseudomonas paraversuta 2 |
88.0 |
11 |
Gluconobacter xylinum 2 |
647.4 |
12 |
Acetobacter xylinum 1 |
793.8 |
13 |
Klebsiella pneumonia |
347.1 |
14 |
Klebsiella variicola |
742.5 |
15 |
Acetobacter okinawensis 3 |
847.6 |
16 |
Leuconostoc citreum |
91.7 |
16S rRNA gene PCR amplification
Promega PCR Master Mix (2x), macrogen (27F) forward primer with sequence (5- AGA GTT TGA TCM TGG CTC AG -3) and (1492 R) reverse primers with sequence (5- TAC GGY TAC CTT GTT ACG ACT T -3) were used in the procedure as mentioned in Table 2.
Table (2):
Number of nucleotides, primer sequence, and code used in 16s rRNA analysis
No. of nucleotides |
Primer sequence from 5’ to 3’ |
Primer code |
|---|---|---|
20 |
AGAGTTTGATCMTGGCTCAG |
27F |
22 |
ACGGYTACCTTGTTACGACTT |
1492R |
Analysis of PCR product
The amplified bands of 16S rRNA are visible in the electrophoresis results, and they were examined under the UV transilluminator (DATHAN Scientific Co, Ltd), as illustrated in
Figure 6.
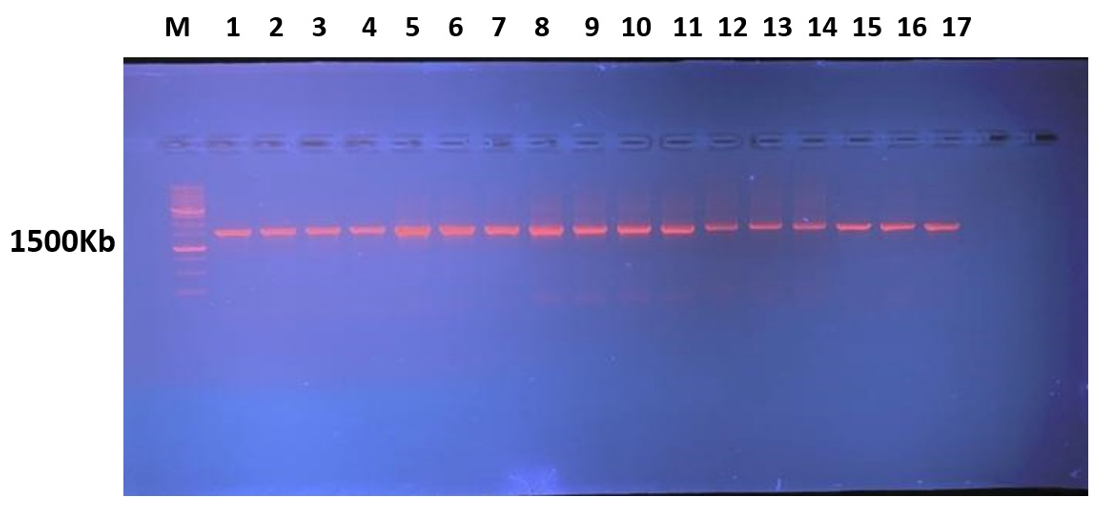
Figure 6. Patterns of 16sRNA bands under study on Agarose Gel electrophoresis of isolated 16sDNA (M: DNA molecular weight marker 1500Kb) using 1Kb ladder (Solis Biodyne). Lane represents as Gluconobacter xylinum 1, (2) Acetobacter xylinum 2, (3) Levilactobacillus brevis, (4) Acetobacter okinawensis 1, (5) Zymobacter palmae 1, (6) Pseudomonas paraversuta 1, (7) Fructobacillus tropaeoli, (8) Acetobacter okinawensis 2, (9) Zymobacter palmae 2, (10) Pseudomonas paraversuta 2, (11) Gluconobacter xylinum 2, (12) Acetobacter xylinum 1, (13) Klebsiella pneumonia, (14) Klebsiella variicola, (15) Acetobacter Okinawensis 3, and (16) Leuconostoc citreum.
16S rRNA sequencing and Identification of Isolated Bacterial Strains and Strain used as control of Work.
The BLAST query results for a total of 16 isolates, which were initially obtained from rotten fruits, are provided in Table 3. Notably, samples with the names 1, 4, 8, 11, 12, and 15 exhibited the synthesis of cellulose in soluble form. Additionally, the isolate with sample number 2 (model strain) is also included in the table. It is important to reiterate that isolate number 17 showed no similarity with any sequence in the NCBI, as previously discussed.
Table (3):
BLAST results of 16s RNA sequences isolated from samples
Isolate |
Blast result |
% Query Coverage |
Percent Identification |
|---|---|---|---|
1 |
Gluconobacter xylinum 1 |
87 |
96 |
2 |
Acetobacter xylinum 2 |
98 |
98 |
3 |
Levilactobacillus brevis |
99 |
99 |
4 |
Acetobacter okinawensis 1 |
99 |
99 |
5 |
Zymobacter palmae 1 |
99 |
98 |
6 |
Pseudomonas paraversuta 1 |
96 |
94 |
7 |
Fructobacillus tropaeoli |
99 |
98 |
8 |
Acetobacter okinawensis 3 |
99 |
99 |
9 |
Zymobacter palmae 2 |
97 |
100 |
10 |
Pseudomonas paraversuta 2 |
98 |
98 |
11 |
Gluconobacter xylinum 2 |
98 |
100 |
12 |
Acetobacter xylinum1 |
98 |
99 |
13 |
Klebsiella pneumonia |
99 |
96 |
14 |
Klebsiella variicola |
97 |
99 |
15 |
Acetobacter okinawensis 2 |
85 |
86 |
16 |
Leuconostoc citreum |
97 |
98 |
BLAST proves highly effective in comparing a query sequence against an extensive collection of other sequences. In our analysis, we specifically searched for sequences of type strains that are most closely related to the sequences of the isolates in our study. Operational taxonomic units (OTUs) were defined with a similarity limit of 97%. The 16S rRNA gene sequences obtained in this study were compared with the NCBI GenBank.
The bacterial culture names provided in the preceding sections were assigned after sequencing results were obtained. For each of the 16 isolate queries, E-values were consistently zero, indicating non-chance alignments of the queries. The percentage of query coverage ranged from 79% to 99%, while the percentage of identification varied from 87% to 100%.
Biosynthesis of cellulose by Acetobacter xylinum (Model Strain) and its characterization
Among all the strains, Acetobacter xylinum strain number 2 was specifically chosen for the synthesis of cellulose sheets. This particular strain exhibited clearer zones and demonstrated cellulose sheet formation at the liquid interface in HS broth media even before the activation process. Subsequently, after culturing sample number 2, the growth of colonies was readily observed. These colonies, or polysaccharides formed on the interface of Acetobacter xylinum-containing HS media plates, were carefully selected for the cellulose synthesis process.
Both methods discussed earlier yielded results for cellulose sheet synthesis at the liquid interface of the media in the bottles, as illustrated in Figure 7. However, it’s noteworthy that the colonies took an additional 2-3 days compared to direct culture for the synthesis of cellulose sheets.
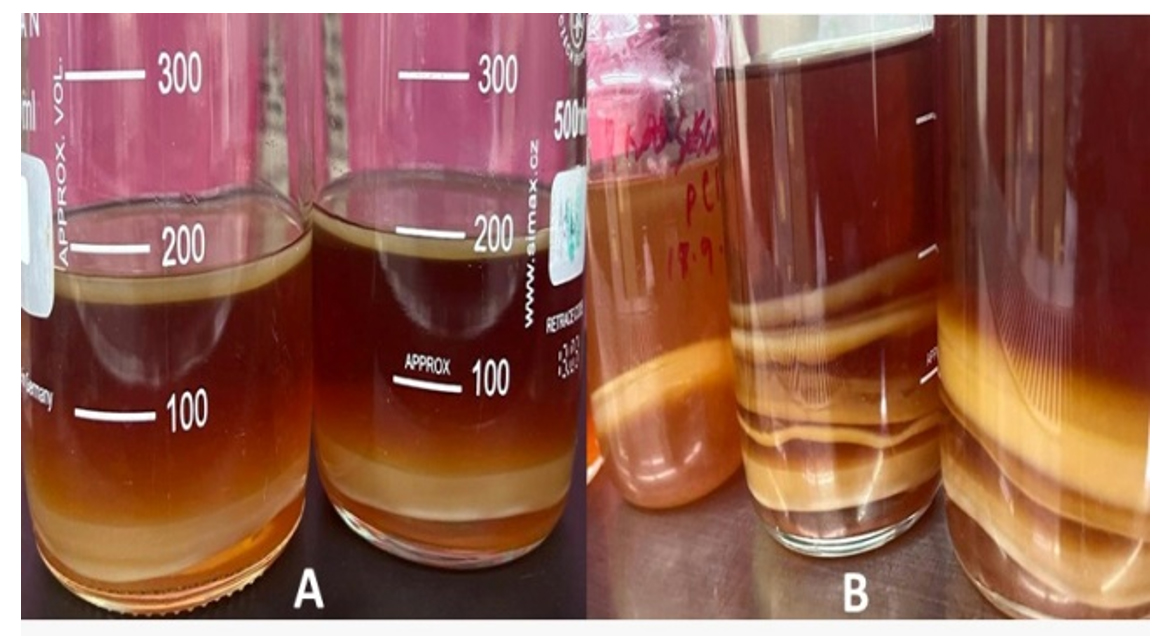
Figure 7. Synthesis of cellulose sheets obtained from Acetobacter xylinum strain 2 at the liquid interface of glass bottles containing 300 ml of Hestrin Schramm (HS) media in a static condition at 28°C in the incubator. Both results show cellulose sheet synthesis at the liquid interface of the media in the bottles
The cellulose sheets underwent a meticulous washing process every 24 hours with double-distilled water to ensure the prevention of fungal growth, avoid contaminations, and eliminate remnants of bacterial colonies. This careful washing continued until the cellulose became clear and achieved sufficient stiffness, as depicted in Figure 8.
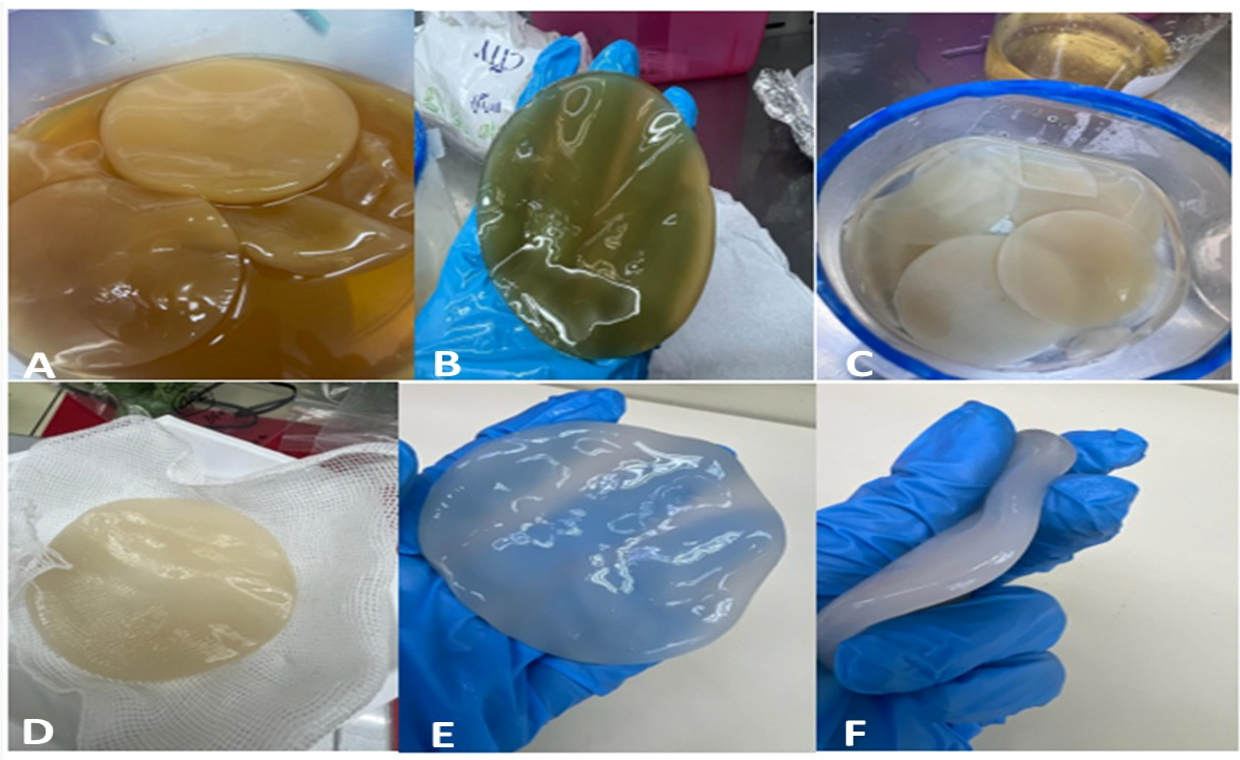
Figure 8. About 11 sheets were extracted from Acetobacter xylinum strain no. 2 shown here. A and B show newly synthesized cellulose sheets in HS media, and C and D illustrate cellulose sheets after wash which still show remnants. E and F represent cellulose sheets after ple times of wash with double distilled water which shows the change in color after each wash. F represents the final clear form and shape of a fully washed and autoclaved cellulose sheet
After autoclaving and then drying, cellulose sheets were transferred into powdered form through mechanical grinding as shown in Figure 9.
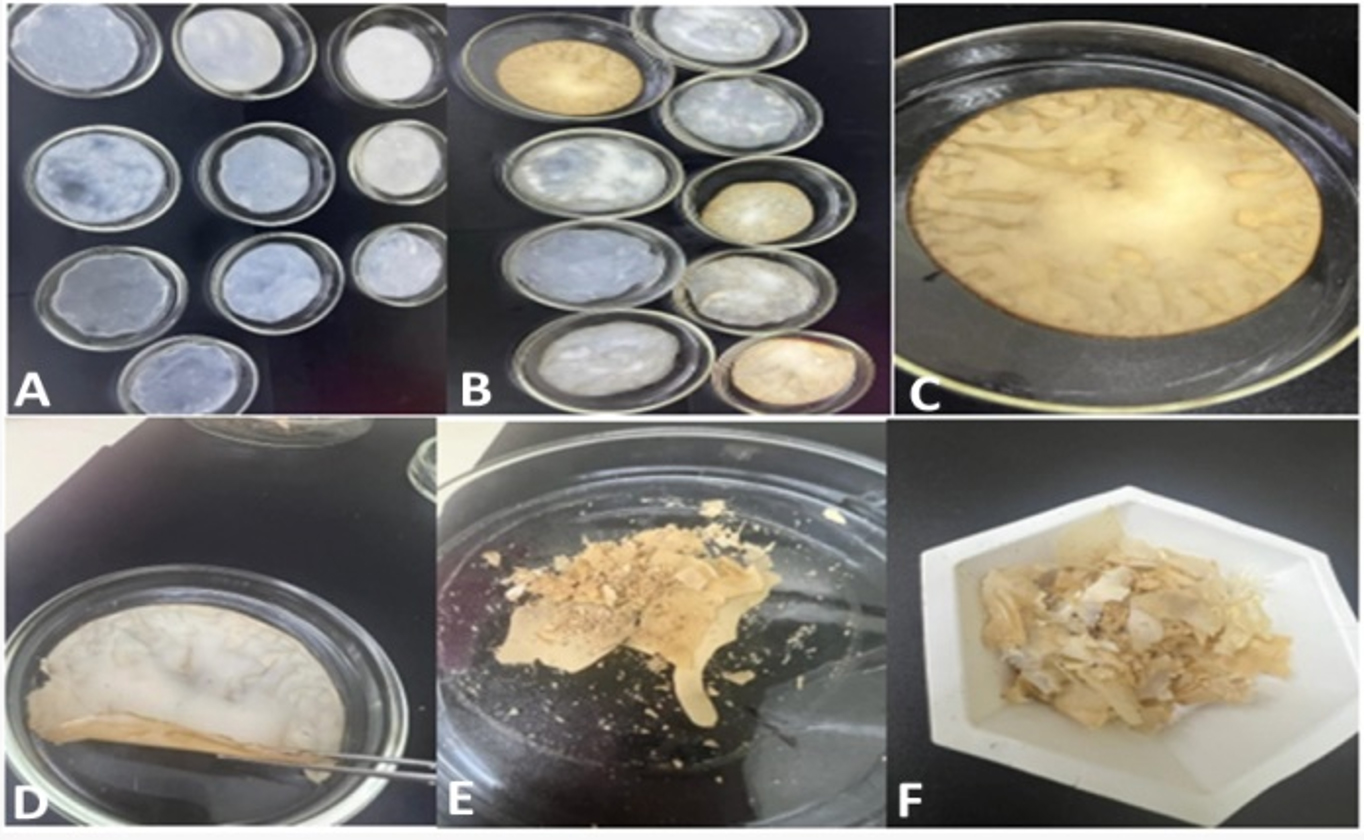
Figure 9. A shows Acetobacter xylinum number 2 strain synthesized wet form of cellulose, B shows the half dry form of cellulose sheets, C and D show completely or 72 hours dried form of cellulose in the oven at 100°C with a vast reduction in cellulose thickness which was then ground. E and F show the ground form of cellulose which was collected then in a falcon tube
All the dry and wet weights of cellulose sheets are mentioned in Table 4. The final 7 grams of dried sheets were then characterized with XRD, FT-IR, and SEM to ensure the properties.
Table (4):
Measurement of wet, dry, and net weight of 11 cellulose sheets synthesized by A. xylinum number 2
Cellulose sheet |
Wet state wt. |
Dry state wt. |
|---|---|---|
1 |
33.906 |
0.919 |
2 |
28.633 |
0.115 |
3 |
25.285 |
0.082 |
4 |
18.792 |
0.060 |
5 |
5.796 |
0.029 |
6 |
5.520 |
0.051 |
7 |
2.434 |
0.005 |
8 |
4.694 |
0.048 |
9 |
0.521 |
0.0438 |
10 |
1.060 |
0.019 |
11 |
18.72 |
0.059 |
Net wt. of dried cellulose |
NA |
7.00 |
Analysis of cellulose sheets
The collected powdered form of all the cellulose sheets was characterized with XRD, FT-IR, and SEM to illustrate cellulose properties.
SEM results of the prepared cellulose at different magnification power
SEM images of the naturally prepared cellulose at various magnification levels are depicted in Figure 10. These images reveal that the cellulose material presents itself as a nanofiber mat, constituting a multi-layered fiber network, with an average diameter measuring 21.5 nm. This observation aligns well with prior research, where prepared cellulose particles exhibited a rod-like structure with dimensions ranging between 10–30 nm in width.38

Figure 10. SEM images of the prepared cellulose at different magnification powers with an average diameter of 21.5 nm obtained from Acetobacter xylinum strain 2
Similar findings were reported in a study of the morphological properties of Betel Nut husk nanocellulose.39 Their results indicated that while microfibers of cellulose were found in a disordered agglomeration position, nanofibers of nanocellulose exhibited a highly ordered and smooth deagglomeration position.
FT-IR spectrum of the naturally prepared cellulose
The FT-IR spectrum of the naturally prepared cellulose is illustrated in Figure 11. The spectrum, obtained using an FT-IR spectrophotometer, reveals distinctive features. A strong band at 3339 cm{ ¹ is attributed to the stretching of hydroxyl groups, while the absorption at 2852 cm{ ¹ originates from C-H stretching. Additionally, the band at 1626 cm{ ¹ arises from the H-O-H bending of absorbed water, the peak at 1369 cm{ ¹ corresponds to O-H bending, and the peak at 1161 cm{ ¹ could be attributed to C-O antisymmetric bridge stretching. Finally, a robust band at 1056 cm{ ¹ is due to the C-O-C pyranose ring skeletal vibration.35,36 Similar FT-IR spectra have also been reported in other studies for Cellulose I.35, 40
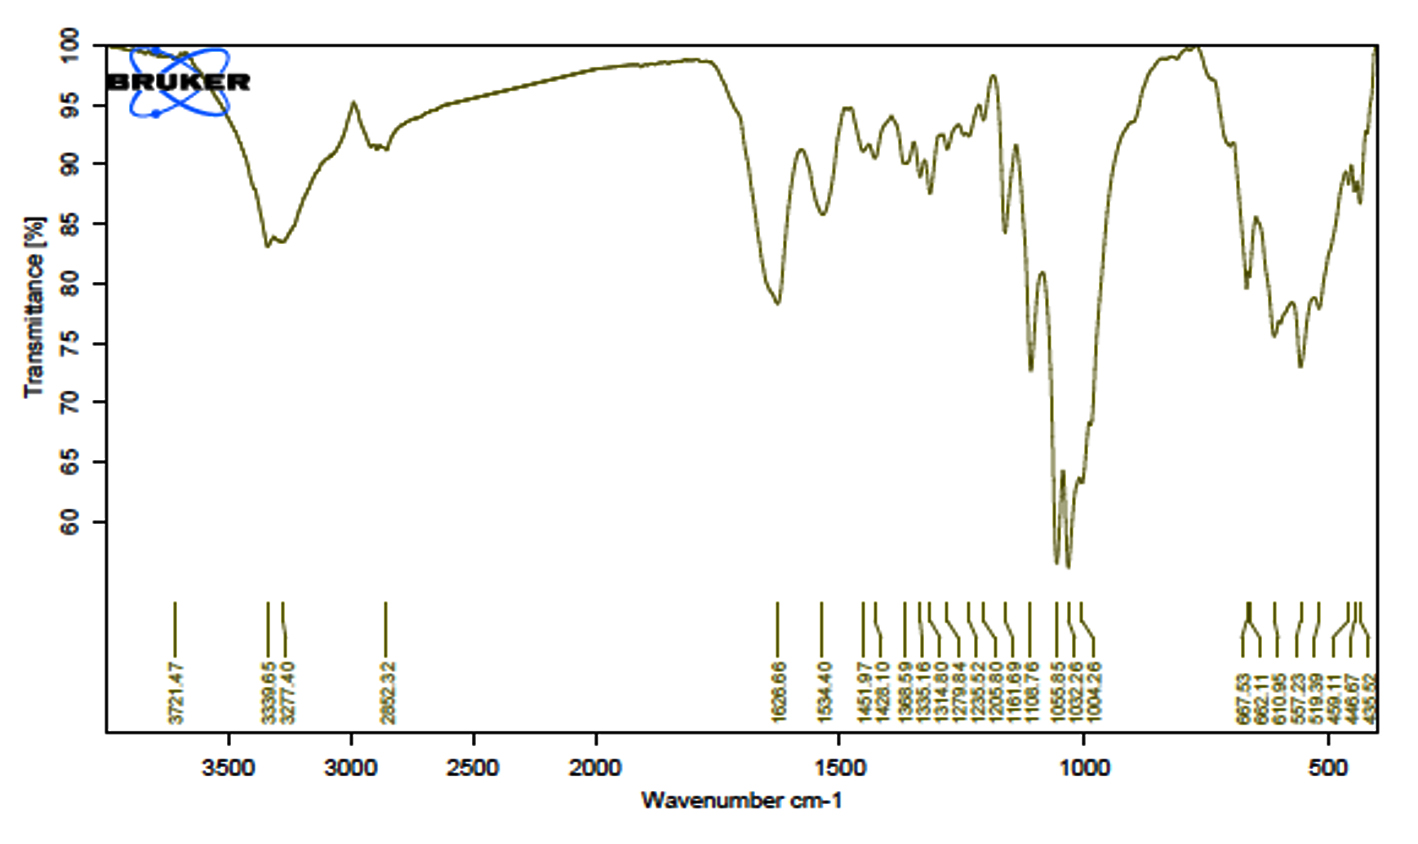
Figure 11. FT-IR spectrum of naturally prepared cellulose obtained from A. xylinum strain 2
XRD patterns of cellulose production
The crystallinity and chemical identity of the naturally prepared cellulose were examined using a Philips x-pert Pro diffractometer for X-ray diffraction (XRD). The analysis, conducted on a collective 7 grams of cellulose, yielded an XRD pattern presented in Figure 12. The results exhibited well-known characteristic diffraction peaks of cellulose I at 2θ values around 14.5°, 16.5°, and 22.5°, corresponding to the planes of (1 1 0), (1 1 0), and (2 0 0), respectively. These findings align closely with previous studies.

Figure 12. XRD pattern for the naturally prepared cellulose with diffraction peaks of cellulose I at 2 values around 14.5°, 16.5° and 22.5° obtained from Acetobacter xylinum strain 2
Furthermore, the impact of cellulose polymorphs on cellulose nanocrystal preparation is also explored in a previous study, noting a similar diffraction pattern attributed to cellulose I, II, and III.38 Similarly, another study analyzed cellulose samples routinely using X-ray diffraction to determine crystal type (polymorph) and crystallinity, obtaining results that echoed the diffraction pattern of cellulose I, consistent with the findings of the present study.37
In this study, we examined the cellulose synthesis capabilities of A. xylinum strain 2, obtained from Pakistan, along with other bacterial samples extracted from various rotten fruits. Our results revealed that all cellulose-synthesizing strains demonstrated a preference for producing a more substantial quantity of cellulose in HS media compared to agar media. Notably, cellulose is synthesized by strains other than A. xylinum 2 was found to be dissolved in the media, while A. xylinum 2 produced cellulose exhibiting a compact layer. Our research highlights A. xylinum strain number 2 as an exceptionally efficient producer of cellulose sheets within a short timeframe (3-4 days).
Analyzing the cellulose produced by A. xylinum through XRD, FTIR, and SEM unveiled well-defined diffraction peaks, a multi-layered fiber network, and strong stretching bands. These findings pave the way for future research endeavors. The approach holds great promise for large-scale, cost-effective bacterial cellulose production at an industrial level. Key cost-reducing factors include the strategic selection of media components, and prioritizing liquid media over agar for enhanced cost-effectiveness and scalability. Optimization of culture conditions, efficient strain selection, and a streamlined production process contribute to reduced resource consumption, shorter production times, and minimized contamination risks.
The optimized production process, particularly beneficial for biomedical and industrial applications, underscores its economic viability for large-scale implementation. We recommend ongoing efforts towards constant enhancement and the exploration of innovative technologies to refine the production process over time.
ACKNOWLEDGMENTS
The authors express sincere gratitude to Ahmad Alhijan Lab at King Fahad Medical Research Center (KFMRC), King Abdulaziz University, Saudi Arabia, for their invaluable support and collaboration throughout the course of this research.
CONFLICT OF INTEREST
The authors declare that there is no conflict of interest.
AUTHORS’ CONTRIBUTION
All authors listed have made a substantial, direct and intellectual contribution to the work, and approved it for publication.
FUNDING
None.
DATA AVAILABILITY
All datasets generated or analyzed during this study are included in the manuscript.
ETHICS STATEMENT
Not applicable.
- Ullah H, Wahid F, Santos HA, Khan T. Advances in biomedical and pharmaceutical applications of functional bacterial cellulose-based nanocomposites. Carbohydr Polym. 2016;150:330-352.
Crossref - Esa F, Tasirin SM, Rahman NA. Overview of bacterial cellulose production and application. Agriculture and Agricultural Science Procedia. 2014;2:113-119.
Crossref - Eslahi N, Mahmoodi A, Mahmoudi N, Zandi N, Simchi A. Processing and properties of nanofibrous bacterial cellulose-containing polymer composites: a review of recent advances for biomedical applications. Polymer Reviews. 2020;60(1):144-170.
Crossref - Sharma C, Bhardwaj NK. Bacterial nanocellulose: Present status, biomedical applications, and future perspectives. Mater Sci Eng C Mater Biol Appl. 2019;104:109963.
Crossref - Khan SB, Tahseen K, eds. Bacterial Cellulose: Synthesis, Production, and Applications. CRC Press, 2021.
Crossref - Portela R, Leawl CR, Almeida PL, Sobral R. Bacterial cellulose: a versatile biopolymer for wound dressing applications. Microb Biotechnol. 2019;12(4):586-610.
Crossref - Saibuatong OA, Phisalaphong M. Novo aloe vera- bacterial cellulose composite film from biosynthesis. Carbohydr Polym. 2010;79(2):455-460.
Crossref - Pradeep HK, Patgel DH, Onkarappa HS, Pratiksha CC, Prasanna GD. Role of nanocellulose in industrial and pharmaceutical sectors – A review. Int J Biol Macromol. 2022;207:1038-1047.
Crossref - Ullah H, Badshah M, Makila E, et al. Fabrication, characterization and evaluation of bacterial cellulose- based capsule shells for oral drug delivery. Cellulose. 2017;24:1445-1454.
Crossref - Badshah M, Ullah H, He F, et al. Development and evaluation of drug-loaded regenerated bacterial cellulose-based matrices as a potential dosage form. Front Bioeng Biotechnol. 2020;8:579404.
Crossref - Almeida IF, Pereira T, Silva NH, et al. Bacterial cellulose membranes as drug delivery systems: an in vivo skin compatibility study. Eur J Pharm Biopharm. 2014;86(3):332-6.
Crossref - Bielecki S, Krystynowicz A, Turkiewicz M, Kalinowska H. Bacterial cellulose. In: Polysaccharides and polyamides in the food industry: properties, production, and patents. 2005:31-84.
- Hu W, Chen S, Yang J, Li Z, Huaping Wang. Functionalized bacterial cellulose derivatives and nanocomposites. Carbohydr Polym. 2014;101:1043-1060.
Crossref - Khan T, Hyun SH, Park JK. Production of glucuronan oligosaccharides using the waste of beer fermentation broth as a basal medium. Enzyme and Microbial Technology. 2007;42(1):89-92.
Crossref - Khattak WA, Khan T, Ul-Islam, et al. Production, characterization and biological features of bacterial cellulose from scum obtained during the preparation of sugarcane jaggery (gur). J Food Sci Technol. 2015;52:8343-8349.
Crossref - Lin SP, Loira I, Catchmark JM, Liu JR, Demirci A, Cheng KC. Biosynthesis, production and applications of bacterial cellulose. Cellulose. 2013;20: 2191-2219.
Crossref - Ul-Islam M, Khan T, Park JK. Nanoreinforced bacterial cellulose-montmorillonite composites for biomedical applications. Carbohydr Polym. 2012;89(4):1189-1197.
Crossref - Avcioglu, NH. Bacterial cellulose: Recent progress in production and industrial applications. World J Microbiol Biotechnol. 2022;38(5):86.
Crossref - Vadanan SV. Bacterial cellulose: from culturing to the development of functional materials. 2020.
- Kim JH, Lee D, Lee YH, Chen W, Lee SY. Nanocellulose for energy storage systems: beyond the limits of synthetic materials. Adv Mater. 2019;31(20):1804826.
Crossref - Suryanto H, Yanuhar U, Mansingh BB. Bacterial Nanocellulose From Agro-Industrial Wastes.” Handbook of Biopolymers. Singapore: Springer Nature Singapore. 2022:1-39.
Crossref - Lahiri D, Nag M, Dutta B, et al. Bacterial cellulose: Production, characterization, and application as antimicrobial agent. Int J Mol Sci. 2021;22(23):12984.
Crossref - Ibrahim SA, Abd-El-Aal SK, Attallah AG, El-Sayd MA. Molecular identification and characterization of some gluconacetobacter strains isolated from some Egyptian fruits. Res J Pharm Biol Chem Sci. 2014;5(4):1617-1627.
- Hungund B, Gupta SG. Improved production of bacterial cellulose from Gluconacetobacter persimmonis GH-2. J Microb Biochem Technol 2010;2(5):127-133.
Crossref - Badshah M, Ullah H, Khan SA, Park JK, Khan T. Preparation, characterization and in-vitro evaluation of bacterial cellulose matrices for oral drug delivery. Cellulose. 2017;24:5041-5052.
Crossref - Badshah M, Ullah H, Khan AR, Khan S, Park JK, Khan T. Surface modification and evaluation of bacterial cellulose for drug delivery. Int J Biol Macromol. 2018;113:526-533.
Crossref - AAT Bioquest, Inc. Quest Calculate™ PBS (Phosphate Buffered Saline) (1X, pH 7.4) Preparation and Recipe. AAT Bioquest, Inc.; 2023.
- Rangaswamy BE, Vanitha KP, Hungund BS. Microbial cellulose production from bacteria isolated from rotten fruit. Int J Polym Sci. 2015;280784.
Crossref - Jahan F, Kumar V, Rawat G, Saxena RK. Production of microbial cellulose by a bacterium isolated from fruit. Appl Biochem Biotechnol. 2012;167:1157-1171.
Crossref - Neelima S, Sreejith S, Shajahan S, et al. Highly Crystalline bacterial cellulose production by Novacetimonas hansenii strain isolated from rotten fruit. Materials Letters. 2023;333:133622.
Crossref - Al-Deresawi TS, Mohammed MK, Khudhair SH. Isolation, Screening, and Identification of Local Bacterial Isolates Producing Bio-Cellulose. J Med Chem Sci. 2023;6(3):622-633.
Crossref - Hasanin MS, Abdelraof M, Hashem AH, Saied HE. Microbial Cell Factories volume. Sustainable bacterial cellulose production by Achromobacter using mango peel waste. Microbial Cell Factories. 2023;22(1):24.
Crossref - Beveridge TJ. Use of the Gram stain in microbiology. Biotech Histochem. 2001;76(3):111-118.
Crossref - Azcarate-Peril MA, Raul RR. Methods for plasmid and genomic DNA isolation from lactobacilli. Food microbiology Protocols. 2001:135-139.
Crossref - Chen W, He H, Zhu H, Cheng M, Li Y, Wang S. Thermo-Responsive Cellulose-Based Material with Switchable Wettability for Controllable Oil/Water Separation. Polymers. 2018;10(6):592.
Crossref - Fatima A, Ortiz-Albo P, Neves LA, Nascimento FX, Crespo JG. Biosynthesis and characterization of bacterial cellulose membranes presenting relevant characteristics for air/gas filtration. J Membr Sci. 2023;674:121509.
Crossref - French AD. Idealized powder diffraction patterns for cellulose polymorphs. Cellulose 2014:885-896.
Crossref - Gong J, Li J, Xu J, Xiang Z, Mo L. Research on cellulose nanocrystals produced from cellulose sources with various polymorphs. RSC Advances. 2017;53:33486- 33493.
Crossref - Sultana T, Sultana S, Nur HP Khan MW. Studies on mechanical, thermal and morphological properties of betel nut husk nano cellulose reinforced biodegradable polymer composites. J Compos Sci. 2020;4(3):83.
Crossref - Li J, Zhang LP, Peng F, et al. Microwave-assisted solvent-free acetylation of cellulose with acetic anhydride in the presence of iodine as a catalyst. Molecules 2009;14(9):3551-3566.
Crossref
© The Author(s) 2024. Open Access. This article is distributed under the terms of the Creative Commons Attribution 4.0 International License which permits unrestricted use, sharing, distribution, and reproduction in any medium, provided you give appropriate credit to the original author(s) and the source, provide a link to the Creative Commons license, and indicate if changes were made.