

ISSN: 0973-7510
E-ISSN: 2581-690X
Pseudomonas syringae pv. maculicola (Psm) is a phytopathogen of a wide range of host plants from the cruciferae family, producing blight. Some strains infect Arabidopsis thaliana, whose genetic characteristics has made it a plant model for analyses of different process, such as resistance to phytopathogens. In this study, we have focused on this bacterium in order to understand how plant-pathogen interactions influence its genome organization. Eight strains of Pseudomonas syringae pv. maculicola were selected and analyzed by RFLP using PacI and PmeI restriction enzymes in order to evaluate the conservation of the number and size of the restriction fragment into the strains. The results show heterogeneity in the structure and composition of the Psm genome. This heterogeneity has not a clearly relationship between the production of coronatine and the presence/absence or copy number of plasmids., The genome dynamics could be related with the pathogenicity island even the genome origin.
Pseudomonas syringae, Pathovar, PFGE, FIGE, UPGMA, RFLP
Pseudomonas syringae pv. maculicola (Psm) is a Gram-negative bacteria that infect mainly cruciferae family. The interaction between plant-phytopathogen has produced a specialization and selection into the phytopathogen for the establishment of compatible or incompatible interactions promoting disease or resistance of the host1. This process is mediated by avr–R interaction, proposed by Flor2, and the guard hypothesis3. The presence of bacterial avr gene and its interaction with the specific R gene from the host avoid the bacteria establishment and initiates the resistance response from the plant, therefore, the absence or presence of specific genes are essentials in this interaction 4, and can be influenced by the bacterial genomic structure and positive selected genes related to pathogen-host interaction5, however remains elusive the origin of the phytopathogen and how the interaction plant-microbe shape the phytopathogen genome. Molecular markers help us to group pathogens that are closely related, as ribotyping, AFLP, RFLP6 and others techniques search into the genome characteristics as enzymes recognition sites, and differences in their conserved sequences between species, as rDNA7. In this study we were interested in understand how the genomic structure of 8 Psm strains change during pathogen-host interaction.
Bacterial strains
The bacterial strains are listed in Table 1. Pseudomonas syringae pv. maculicola (Psm) strains were growth to 28°C in King’ B Medium. Strain PsmCFBP1637 was obtained from Collection Française, de Bacteriés Phytopathogènes (CFBP). Other sources of Psm strains are indicated in Table 1. We used Psm438 twice, from different sources, to check if the source could be a factor to produce genome variation. Production of coronatine was obtained from previous work, for Psm438, PsmICMP921 and PsmGSPB2146, coronatine production was described by Völksch and Weingart8, for PsmM2 we do not detect coronatine by HPLC.
Restriction analysis with PacI and PmeI
The RFLP was realized using restriction enzymes of rare cut sites as PacI (TTAAT/TAA), PmeI (GTTT/AAAC; New England Bio-Labs). The DNA preparation was realized as follow. The strains were growth to reach 60 Klett units in 10 mL of KB, the culture was centrifuged to 8 000 rpm in a Sorvall rotor SS34 during 15 min to 4°C. The pellet was resuspended in 20 mL of Pett IV solution (Tris-HCl pH 7.6, 10 mM; NaCl 1M) and centrifuged to 8 000 rpm during 10 min to 4°C. The pellet was resuspended in 1.6 mL of Pett IV and warm to 50°C, it was mixed with an equal volume of agarose of low melting point (inCert, Lonza Rockland, Inc) of 1.2 % in sterile water. The mix was used to fill the molds using 100 µL by mold (Plug Mold, BioRad). The molds were chill to 4°C during 10 min and each block was pushed into sterile Falcon tubes of 50 mL. Then was add an equal volume of EC solution (Tris-HCl pH 7.6, 6 mM; NaCl 1M; EDTA pH 7.5 1 mM; Brij-58 0.5%; sodium deoxycholate 0.2%; lauril sarcosine 0.5%) and was incubated overnight at 37°C, the solution was eliminated and then was add an equal volume of ESP solution (EDTA pH 9.5, 0.5M; lauril sarcosine, 1%; proteinase K, 1 mg/mL), with gently shake, incubated by two days at 50°C. For restriction analyses, the blocks were washed three times using 20 mL of TE solution (Tris-HCl pH 8.0, 0.01 M; EDTA pH 8.0, 0.05 M) with PMSF 0.1 M incubating for 3 h at 50°C and then washed using 20 mL of TE solution (Tris-HCl pH 8.0, 0.01 M, EDTA pH 8.0, 0.001 M) without PMSF. The restriction reaction was performed in 300 µL, incubating first at 4°C overnight, and at 37°C by two hours.
PFGE
PFGE was performed in 1.2% agarose gel electrophoresis (UltraPure, Invitrogen®) in 0.5X TBE buffer (0.045 M Tris-borate, 0.001 M EDTA, pH 8.0). The electrophoresis was run at 14°C in a Chef Mapper apparatus from Bio-Rad using a linear increase in the pulse intervals. For separation of fragment, the gel was run for 52 h at 5 V/Cm with a pulse time from 60 to 15 s. DNA fragments were resolved and sized by comparison with the Saccharomyces cerevisiae YPH80 chromosomes from BioRad (size range 225-1900 kb). Following electrophoresis, gels were stained with ethidium bromide 30 µg/mL for 30 min in TAE 1X (0.04 M Tris-Acetate, 0.001 M EDTA, pH 8.0), then washed-out in 0.5X TBE buffer. The restriction fragments were analyzed in GelDoc 2000 (BioRad) using Software Quantity One (BioRad version 4.0.3. for Macintosh).
Statistical analysis
The clustering method used was the average-linkage-between-groups, UPGMA method (Unweighted Pair Group with Arithmetic Average). The dendogram were designed using a dissimilarity genetic unit between individuals (OTU, Operative Taxonomic Unit). From zero for the closer OTU to one for the not related OTU. RFLP bands were numerical coded as one for the band presence or zero to absence. Then, the measure of genetic dissimilarity between OTU was calculated as the discrepancy number (0,1 or 1,0) divided by the bands number using during the comparison; for comparison, we used the number and size of PsmM2 bands. The dissimilarity between A and B OTUs was estimated by the formula:
D(A,B)=(S |Ai-Bi| ) / n
Where Ai and Bi, i=1, 2,….n; they are the numerical codes for the band detected. Estimated genetic dissimilarity between OTUs as the sum of the absolute values of the difference divided by the number of bands compared. This method begins with finding a dissimilarity matrix of data with less dissimilarity. The two OTUs with minimum dissimilarity are then grouped. Then discarded less dissimilarity from the matrix, and those data are searched again less dissimilarity and re-grouping, if the minimum dissimilarity occurs between units that are already part of groups, then the dissimilarity between these groups is calculated using the arithmetic average.
Phenotype Diversity in Psm strains
The Psm strains analyzed present differences in coronatine synthesis, rifampicine resistance and also the number of plasmids (Table 1). There is a plasmid that is common in all the strains, but its presence is not necessary for coronatine production, because PsmICMP921 does not have plasmid and do not produce coronatine, while PsmGSPB2146, also does not have plasmid but produces coronatine. It was also interesting that the resistance to rifampicin is not wide distributed into all the strains analyzed, just PsmM2 is rifampicin resistant. As we know that PsmM2 is a classical pathovar maculicola9, the comparison against the rest of Psm give us some clues of how dissimilar are others maculicola strains in comparison with M2.
Table (1):
Strains used in this work. Strain Psm 438 was used twice, but from different sources.
| Strain | Phenotype | Plasmid | Source |
|---|---|---|---|
| (A) ICMP921 | Rif–, Cor– | No | Dr. Cuppels |
| (B) GSPB2146 | Rif–, Cor+ | No | Dr. Rudolph |
| (C) 438 | Rif– Cor+ | 3 | Dr. Cuppels |
| (D) M2 | RifR, Cor– | 1 | Dr. Dangl |
| (E) 307 | Rif–, nd | 4 | Cinvestav UI |
| (F) 308 | Rif–, nd | 5 | Cinvestav UI |
| (G) CFBP1637 | Rif–, nd | 6 | CFBP |
| (H) 438* | Rif–, Cor+ | 3 | Cinvestav UI |
| nd. no determined. Rif, rifampicin; Cor, coronatine. |
|||
Genetic dissimilarity into Psm strains
In order to establish the dissimilarity between strains we conducted a restriction analysis with PacI and PmeI (Table 2). Even the different number of bands, there is not a significant difference in the cut frequency (Kruskal-Wallis rank sum test, p-value = 0.02518) and could be related with the low percent of AT into Psm genome. In Tables 2 and 3, show the dissimilarity index for the eight strains with the two enzymes. The lowest Dissimilarity Index (DI) with PacI is for Psm438-Psm438* (DI = 0) and Psm308-PsmCFBP1637 (DI = 0), for PmeI, the lowest DI is for Psm438-Psm438* (0) and Psm308-PsmCFP1637 (DI =0). For the highest dissimilarity, in the case of PacI, PsmM2-PsmICMP921 (DI = 0.917) and for PmeI, Psm307-PsmGSPB2146 (DI = 0.846). With DI data we construct a dendrogram (Figure 2) for PacI and PmeI and described 3 groups of dissimilarity, A, B and C, which were the same in both restriction analyses. We used the DI = 0.5 as definition of each group, considering 0 as similar and 1 as dissimilar.
Table (2):
Restriction frequency for PacI y PmeI enzymes in the eight genomes of Psm strains.
Enzyme |
ICMP921 |
GSPB2146 |
438 |
M2 |
307 |
308 |
CFBP1637 |
438* |
|---|---|---|---|---|---|---|---|---|
PacI |
4 |
11 |
9 |
12 |
11 |
12 |
12 |
9 |
PmeI |
11 |
8 |
14 |
13 |
13 |
14 |
14 |
14 |
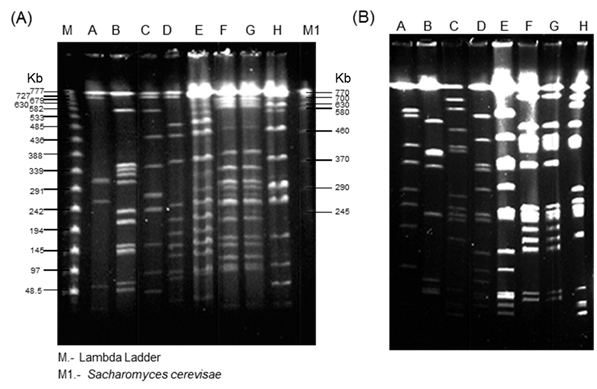
Fig. 1. PFGE for 8 Psm strains with PacI (A) and PmeI (B), electropho-resis conditions are described in materials and methods section. A. ICMP921; B. GSPB2146; C. 438; D. M2, E. 307; F. 308; G, CFBP1637; H. 438*
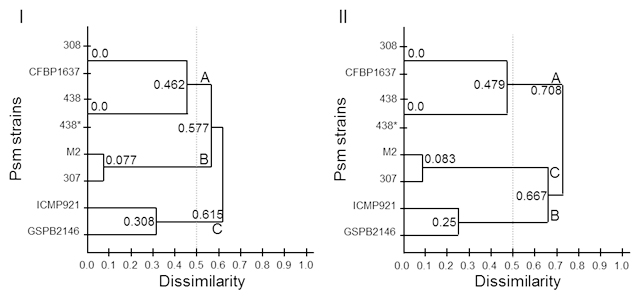
Fig. 2. Genetic dissimilarity for 8 Psm strains, clustering with UPGMA. I obtained with PmeI, and II obtained with PacI
The phenotypical differences between strains in Rifampicin resistance and coronatine synthesis could be used as a good marker to differentiate them. As a coronatine is not conserved between pathovars, it could be possible that it is not necessary for establish the disease during infection process, also result remarkably the absence or presence of the plasmid, but we unknown if the cointegrate plasmid is into the genome, because of that, further analysis has to been made. The enzymes used in this work were selected because its low cut frequency into the Pseudomonas genus (Figure 2) and has been used previously10,11 in Pseudomonas genus. The conservation of number of sites and sizes of the fragment length produce during the restriction analysis was used as a molecular marker for evolutive analysis and as a genome fingerprint. Restriction enzymes PacI and PmeI cut in regions rich in adenine and thymine regions that are not very common for Pseudomonas genus, as their percentage of guanine and cytosine is more than 55 %1, as a cut-off frequency lower than predicted on the basis of this decreased mean percentage in AT, and a higher GC content, as might be the case for Psm ICMP921 and Psm GSPB2146. Into the clustering analysis using UPGMA, Psm strains 308 and Psm CFBP1637 show zero dissimilarity with PmeI enzyme (Table 3I). As the strains 438 and 438*, these strains conserve homology in the cleavage sites, although coming from different laboratories, point high conserved restriction sizes between the same strains, even they were growth in different places. The strains were distributed in three main groups, A, B and C which indicates the genome heterogeneity into the same pathovar, and these groups are conserved in the two analysis, only DI was different, and it could be because the sensibility of each restriction enzyme analysis. We were able to identify specific number and size of the restriction bands, but we were not able to detect some double bands or a single band that are smaller and were lost with the electrophoresis condition, but this assay was enough to establish the dissimilarity between the Psm strains. The genome dynamic into each pathovar is specific and it could be result of the plant-microbe interaction12, and involve the differences in the production of coronatine, affecting the virulence and host selection which each strains infected8. It has been defined 5 phylogroups for Pseudomonas syringae13, where Psm belongs to phylogroup 55, which could be related to the host specificity. And inside the Psm cluster, it has been described at least two closer groups, which are closer to Pseudomonas syringae pv. tomato DC300012. It means that the definition for a pathovar could be related to the genes related to pathogenesis and genes related to infect the right host, and it is not defined completely for the genomics relationship between them. We were interested in study the genomic relationship inside the maculicola’s pathovar and compare how it is distributed. We found that there is an intraspecific genome differences, in which could be related a two different process; i) most of the strains came from an common ancestor, and during the plant-microbe interaction, there is a selective pressure, modifying the genome landscape for each strain; and ii) the strains are from different ancestors, and the acquisition of the pathogenicity island (PI), the strains begin to interact with different host, until they found the right one, and during this process, also appear a selective pressure, selecting the PI, but the genome landscape has not change and reflect the evolutive history of the strain. There is no doubt that there are 5 main phylogroups, but because this phylogropus are defined by PI, the context of the evolutive origin of the strains is unknown. Our results point that the strains Psm307 are closer to PsmM2, and it could be useful for pathogenicity analysis, and it could be relevant that the cloning and sequencing the both PI would result to understand the PI acquisition by vertical or horizontal transfer. There are two strains, PsmICMP921, and PsmGSPB2146, which are the most dissimilarity strains. For these strains, sequencing and comparing housekeeping genes between maculicola pathovars, will point the genetic conservation between them or could establish the identity of another pathovar. Understanding diversity and how it is carried out between phytopathogens facilitate the right measures with the control and diseased crops.
Table (3):
Dissimilarity index obtained with PmeI.
Strains |
ICMP921 |
GSPB2146 |
438 |
M2 |
307 |
308 |
CFBP1637 |
438* |
|---|---|---|---|---|---|---|---|---|
ICMP921 |
**** |
0.308 |
0.308 |
0.769 |
0.692 |
0.615 |
0.615 |
0.308 |
GSPB2146 |
**** |
0.462 |
0.769 |
0.846 |
0.769 |
0.769 |
0.462 |
|
438 |
**** |
0.769 |
0.692 |
0.462 |
0.462 |
0 |
||
M2 |
**** |
0.077 |
0.462 |
0.462 |
0.769 |
|||
307 |
**** |
0.385 |
0.385 |
0.692 |
||||
308 |
**** |
0 |
0.462 |
|||||
CFBP1637 |
**** |
0.462 |
||||||
438 |
**** |
Table (4):
Dissimilarity index obtained with PacI.
Strains |
ICMP921 |
GSPB2146 |
438 |
M2 |
307 |
308 |
CFBP1637 |
438* |
|---|---|---|---|---|---|---|---|---|
ICMP921 |
**** |
0.25 |
0.167 |
0.917 |
0.833 |
0.333 |
0.333 |
0.167 |
GSPB2146 |
**** |
0.4167 |
0.833 |
0.833 |
0.083 |
0.083 |
0.417 |
|
438 |
**** |
0.075 |
0.667 |
0.5 |
0.5 |
0 |
||
M2 |
**** |
0.083 |
0.75 |
0.75 |
0.75 |
|||
307 |
**** |
0.667 |
0.666 |
0.667 |
||||
308 |
**** |
0 |
0.417 |
|||||
CFBP1637 |
**** |
0.5 |
||||||
438* |
**** |
ACKNOWLEDGMENTS
We would like to acknowledgment Dr. Dangl, Dr. Arredondo, Dr. Cuppels and CFBP collection for the strains used in this work, Dalia Rodríguez-Ríos for her technical support.
CONFLICT OF INTEREST
The authors declare that there is no conflict of interest.
- O’Brien HE, Thakur S, Guttman DS. Evolution of plant pathogenesis in Pseudomonas syringae: a genomics perspective. Annu Rev Phytopathol. 2011; 49:269-89.
- Flor HH. Current Status of the Gene-For-Gene Concept. Annu Rev Phytopathol. 1971; 9(1):275-296.
- Gimenez-Ibanez S, Rathjen JP. The case for the defense: plants versus Pseudomonas syringae. Microbes Infect. 2010; 12(6):428-37.
- Mansfield JW. From bacterial avirulence genes to effector functions via the hrp delivery system: an overview of 25 years of progress in our understanding of plant innate immunity. Mol Plant Pathol. 2009; 10(6):721-34.
- Guttman DS, Gropp SJ, Morgan RL, Wang PW. Diversifying selection drives the evolution of the type III secretion system pilus of Pseudomonas syringae. Mol Biol Evol. 2006; 23(12):2342-54.
- Clerc A, Manceau C, Nesme X. Comparison of Randomly Amplified Polymorphic DNA with Amplified Fragment Length Polymorphism To Assess Genetic Diversity and Genetic Relatedness within Genospecies III of Pseudomonas syringae. Appl Envir Microbiol. 1998; 64(4):1180-1187.
- Kong H, Blackwood C, Buyer JS, Gulya TJ, Lydon J. The genetic characterization of Pseudomonas syringae pv. tagetis based on the 16S–23S rDNA intergenic spacer regions. Biological Control. 2005; 32(3):356-362.
- Völksch B, Weingart H. Toxin production by pathovars of Pseudomonas syringae and their antagonistic activities against epiphytic microorganisms. J Basic Microbiol. 1998; 38(2):135-45.
- Ritter C, Dangl JL. The avrRpm1 gene of Pseudomonas syringae pv. maculicola is required for virulence on Arabidopsis. Mol Plant Microbe Interact. 1995; 8(3):444-53.
- Ita M De, Marsch-Moreno R. Physical map of the chromosome of the phytopathogenic bacterium Pseudomonas syringae pv. phaseolicola. Microbiology. 1998;(1998):493-501.
- Ramos-Díaz M, Ramos J. Combined physical and genetic map of the Pseudomonas putida KT2440 chromosome. J Bacteriol. 1998; 180(23):6352-6363.
- Gironde S, Manceau C. Housekeeping gene sequencing and multilocus variable-number tandem-repeat analysis to identify subpopulations within Pseudomonas syringae pv. maculicola and Pseudomonas syringae pv. tomato that correlate with host specificity. Appl Environ Microbiol. 2012; 78(9): 3266-79.
- O’Brien HE, Desveaux D, Guttman DS. Next-generation genomics of Pseudomonas syringae. Curr Opin Microbiol. 2011; 14(1):24-30.
© The Author(s) 2018. Open Access. This article is distributed under the terms of the Creative Commons Attribution 4.0 International License which permits unrestricted use, sharing, distribution, and reproduction in any medium, provided you give appropriate credit to the original author(s) and the source, provide a link to the Creative Commons license, and indicate if changes were made.