

ISSN: 0973-7510
E-ISSN: 2581-690X
Ziyaul Haque1![]() , Mohammed Shariq Iqbal1
, Mohammed Shariq Iqbal1 ![]() , Ausaf Ahmad1
, Ausaf Ahmad1![]() , Mohd Sajid Khan2
, Mohd Sajid Khan2![]() , Satarudra Prakash Singh3
, Satarudra Prakash Singh3![]() and Jyoti Prakash1
and Jyoti Prakash1 ![]()
The present study was focused on microscopic and molecular characterization with growth optimization of two fungal isolates of Trichoderma spp. (TS) along with their antagonistic activities against Colletotrichum falcatum (CF) and plant growth promoter activity. The microscopic and molecular analysis (Internal transcribed spacer – ITS1 region of 18S rRNA) of these isolates revealed that the isolates were Trichoderma asperellum (MK937669) (TA) and Trichoderma viride (MK503705) (TV). The parameters for maximum growth were found to be in TA and TV in potato dextrose agar (PDA) and Sabouraud dextrose agar (SDA) for media components, 25˚C for temperature and for pH (TA 5.5 and TV 6.5) respectively. The antagonistic activity of TS was studied and it was found to be notable against CF (CF02 strain) with 77.666±4.509% and 72.666±7.094 % of inhibition by TA and TV respectively. As a plant growth promoter it was found that maximum Indole-3-acetic acid (IAA) production with 0.5% of L-tryptophan was with 120.308±5.256µg/mL by TA and 130.101±8.995µg/mL by TV. However, when phosphate solubilization (PS) was studied, it was found maximum at day 5 with 410.285±32.084µg/mL by TA and 459.126±38.629µg/mL by TV. When two-way ANOVA was applied it was also found to be significant with p value < 0.05. Overall, the isolated TS species can be rapidly and efficiently produced using the optimum conditions for effective management of CF with good plant growth promoter activty, thus serve as an eco-friendly approach for plant protection and yield increase, thereby economically useful for agricultural industry.
Antagonism, biocontrol, Colletotrichum falcatum, Trichoderma, plant protection.
Agricultural crop such as Sugarcane (Saccharum officinarum) is an economically important crop of tropical and sub-tropical regions, cultivated mainly for production of glucose, sucrose, ethanol, fiber and bio-fuels etc., (Ming et al., 2006; Lam et al., 2009). However, productivity of the crop is mainly affected by red rot disease that causes due to fungal infection by pathogen CF (Rott, 2000). Chemical fungicides are generally used to effectively control the red rot disease, but human health and environmental concerns often put pressure on farmers to reduce its applicability. Furthermore, in present scenario, there are stringent government policies at national and international levels for exploitation of chemical fungicides to eradicate such hazardous chemicals. Other troubles include the development of resistant pathogenic fungal strains like CF due to exhaustive use of chemical fungicides (Shuping and Eloff, 2017). Considering above mentioned severe issues, the investigators have focused on developing the eco-friendly approaches for controlling such diseases. In this context, biocontrol agents (BA) have been considered as one of the safe and effective strategy to overcome the detrimental effects on Mother Nature (Satyavir, 2003;Widmer, 2019). The BA is primarily defined as decreasing the population density of disease-causing pathogen(s)/parasite(s) in its active or inert state that can be achieved naturally or by modification through surroundings, host or antagonist (O’Brien, 2017).
The usage of BA against red rot disease involves the utilization of potent antagonistic fungi (AF) such as TS. The TS is a filamentous, asexual highly diverse fungus, which can occur mostly in tropical and sub-tropical soils that can be cultured easily (Lee et al. 201; Khalili et al. 2012; Gveroska and Ziberoski, 2012; Agnihotri, 1990; Singh et al., 2008; Srivastava et al., 2008; Smith 1973). Also, the growth of sugarcane plant is supported by the several phytohormones produced by TS that found to enhance crop yields (Mastouri et al., 2010, 2012; Harman et al., 2004). In addition, there are several enzymes secreted by TS like chitinases and so on, which can destroy CF by disrupting cell wall followed by breakdown of hypha (Albersheim, 1974; Singh, 1999; Viswanathan, 2003; Prapagdee, 2008). Hence, TS is currently approved in several biological applications such as bio pesticides, bio fertilizers, nutrient solubilizers, growth promoters and organic matter decomposer (Samuels et al., 2006; Woo et al., 2014).
The application of TS as an antagonist is owing to their ability to survive under different adverse environmental conditions, increase reproductive capability, effectiveness in the utilization of nutrients, ability to alter the rhizosphere, strong aggressiveness against plant pathogens and competence in promoting plant growth as well as defense mechanisms (Verma et al. 2007; Hermosa et al. 2012; Mukherjee et al. 2012). Such characteristic features enabled TS to occur in any habitat. However, the pure isolation of TS from the soil in laboratory is normally difficult because of the fairly fast growth of other soil fungi on potato dextrose agar (PDA) media (Domsch et al., 1993). The abiotic factors also influence the mycelial growth of plant pathogenic fungi/BA. Among these, pH is probably the most important parameter affecting the mycoparasitic activities of TS (Kredics et al., 2004). The variations of pH found to affect growth as well as sporulation of TS (Bandyopadhyay et al., 2003; Begoude et al., 2007). Thus, there is a need to isolate TS strains that not only growth well in acidic as well as basic soil but also efficiently destroy CF (Singh et al., 2014). Similarly, temperature is another important factor responsible for the survival of TS; thereby BA should have better stress tolerance level than CF (Kredics et al., 2004; Iqbal et al., 2018; Singh et al., 2014). Considering these, identification (Internal transcribed spacer – ITS1 region of 18S rRNA) and optimization of process parameters such as media components, pH and temperature were carried out, along with evaluation of antagonistic activity of TS isolates against CF and its ability as a plant growth promoter would be advantageous for agricultural industry. Thus, these parameters are studied extensively in the present research.
Fungal isolates
The rhizosphere soil samples were collected from sugarcane cultivated field located at IIM Road, Lucknow, Uttar Pradesh, India for isolation of fungal strains with special emphasis to TS. Nine fungal strains were isolated using serial dilution-agar plating method. For this, 1 mL aliquot of 10-5 serial dilution was transferred to Potato Dextrose Agar (PDA) media followed by incubation for 5 days at 28±1°C (Singh and Singh, 1970). Each pure colony that appeared on PDA was differentiated based on color, growth, size/shape of conidiophore, phialides and conidia (Flegel, 1980) followed by maintaining in the laboratory at 28±1°C. Standard TS (MTCC167) was obtained from Department of Biosciences, Integral University.
Microscopic identification
Microscopic observation was done using lactophenol cotton blue stain. Morphological features like conidia, conidiophore, phialides were identified. Color, shape and mycelial growth were also examined under compound microscope (OPTIKA microscope Italy, B-383Phi) and photographed.
Molecular identification (Internal transcribed spacer – ITS1 region of 18S rRNA)
Amongst nine fungal isolates, merely two strains (designated as TA and TV) were found to depict comparatively higher antagonistic activity against CF (data not shown) and, therefore selected for further study. The genomic DNA was isolated from fresh mycelia of TA and TV following the protocol of Mahuku (2004). The molecular characterization (ITS1 region of 18S rRNA) and identification of these strains were performed using ultra-rapid sequencing method (ABI 3130XL Genetic analyzer) at Aakaar Biotechnologies Pvt. Ltd. (ISO certification: 9001:2008).
Parameters affecting growth of fungal isolates
Effect of media composition
The composition of medium found to significantly affect the growth of microorganism including fungi. Therefore, TA and TV strains were cultivation in different media (as given in Table 1) with respect to optimal growth. Amongst such media, the medium supporting maximum growth of TA and TV strains (in terms of radial growth and dry weight) was chosen for further optimization using temperature and pH.
Table (1):
Different media exploited for the optimal growth of TA and TV strains.
S. No. |
Type of media |
Composition |
Concentration (g/L) |
Reference |
|---|---|---|---|---|
1 |
Potato Dextrose Agar (PDA) |
Peeled potato Dextrose Agar |
250 20.0 15.0 |
Ferdous et al., (2016) |
2 |
Malt Extract Agar |
Malt extract Peptone Dextrose Agar |
20.0 1.0 20.0 15.0 |
Smith (1973) |
3 |
Czepack Dox Agar |
Sucrose Sodium nitrate Di-potassium phosphate Magnesium sulphate Ferrous sulphate Potassium chloride Agar |
30.0 2.0 1.0 0.500 0.010 0.500 15.0 |
Davet and Rouxel (2000) |
4 |
Richard Synthetics Agar |
Potassium nitrate Mono-potassium dihydrogen phosphate Magnesium sulphate Ferric chloride Sucrose Agar |
10.0 5.0 2.50 0.020 50.0 15.0 |
Imeson (2000) |
5 |
Asthana and Hawkers Media |
Glucose Potassium nitrate Potassium dihydrogen orthophosphate Magnesium sulphate Agar |
5.0 3.5 1.75 0.075 15.0 |
Dandge (2012) |
6 |
Saubard Dextrose agar (SDA) |
Dextrose(Glucose) Mycological, peptone Agar |
40.0 10.0 15.0 |
Guinea et al. (2005) |
7 |
M9 media |
Na2HPO4 KH2PO4 Nacl NH4Cl Agar |
6.0 3.0 0.5 0.1 15.0 |
Ferdous (2016) |
pH effect
The pH also depicts significant effect on the growth of microorganism like fungi. In this context, the effect of pH on the growth of TA and TV strains were studied in the range 4.0-8.0 with an interval of 0.5. The pH value favoring maximum fungal biomass formation was considered as optimum pH.
Effect of temperature
As temperature found to affect biochemical reactions and cell growth, therefore temperature was varied from 5-35°C with an interval of 5°C. The temperature depicting highest fungal biomass production was recognized as optimum temperature.
Antagonistic activity
The antagonistic activity was done according to the protocol of Gawade et al. (2012). TA and TV strains were evaluated against CF designated as CF01, CF02 and CF03, obtained from ICAR-Central Institute for Subtropical Horticulture, Lucknow. The freshly cultured biomass of each TA and TV strain was inoculated along with CF at equal distance from the center of potato dextrose agar plate in opposite direction followed by measurement of their radial growth up to 8 days at regular interval of one day. The growth inhibition of CF was calculated as per given formula:
Percentage growth inhibition = [(R-R1)/R] x 100
R= radial growth of CF biomass measured towards center of agar plate from its initial point of inoculation without antagonistic fungus (TA and TV strain).
R1= radial growth of CF biomass measured towards center of agar plate from its initial point of inoculation with antagonistic fungus (TA and TV strain).
Plant growth promoter activity of TS
Indole-3-acetic acid (IAA) production
Subsequent to standardized incubation time, the cultures of TA and TV were centrifuged and the supernatant was mixed in a ratio of 1:2 (v/v) with Salkowski’s reagent [H2SO4 (150 mL), D.W (250 mL, 0.5M FeCl3·6H2O (7.5 mL)]. The reaction mixture was kept for 20 minutes at room temperature. The change in color (pink) indicating production of IAA. Absorbance was measured at 530 nm using double beam UV-Vis Spectrophotometer (Shimadzu-1800) and calculated against IAA standard. Without L-tryptophan concentrations 0.0 (control) and with L-tryptophan (0.1, 0.5, 1.0, 1.5% and 2.0%) using potato dextrose broth medium (28°C/120rpm/7 days), the effect on IAA production was determined (Kumar et al 2017).
Phosphate solubilization
PS was done according to the protocol of Kapri and Tewari (2010), using 250 mL Erlenmeyer flasks, having medium (100 mL) inoculated with active cultures of each TS strain. Incubation was done at 28°C/120rpm/7 days. 10mL aliquot from each flask were withdrawn at an interval of 24hrs. The aliquots were centrifuged (4000 rpm/ 15 minutes/ RT) and supernatant collected was evaluated for pH and phosphate concentration. Following the protocol of Fiske and Subbarow (1925), phosphate in supernatant of the cultures was estimated.
Statistical Analysis
All the experiments were performed in triplicate and statistical analysis, i.e., calculation of mean ± SD and two-way ANOVA was performed using MS excel. The level of significance (α) was set to value of 0.05 for studying the variation amongst parameters.
Microscopic characterization of TS
In the present study, the TS isolates (TA and TV) were visually characterized on the basis of phenotypic characters like color of fungal colonies, shape and size of conidia, conidiophores as well as phialides were observed under microscope, which were in accordance to the report of Klyce et al. 1984. In case of visual observations, isolates were primarily differentiated on the basis of colored colonies i.e. dark green and cottony whitish green colonies were probably assigned to TA and TV, respectively (Fig.1) and the same was as also reported by Vinale et al. (2008); and Shaiesta et al., (2012). The results of microscopic observations also found variation in colonies morphology (sporulating structures/spores), shape and size, arrangement of conidia, conidiophores and phialides that leads to the further differentiation of TS which agree well with the reporting of Rahel et al., (2014). Results are shown in Fig.2. In case of TA, conidiophores form regular branched structure (size 2.8µm x 3.0µm) while TV was observed as irregular branched structure (size 2.6µm x 2.9µm). In the regular branched structure, the secondary branches are often paired and longest secondary branches being closer to the main axis which are coherent with the report of other researchers (Sheila et al., 2009; Gupta et al. 2014; Chandra et al., 2017). The differences in the structure of phialides were also observed for TA (with size 5.2µm x 3.1µm) and TV (with size 4.0µm x 2.6µm). The detail comparative observations between TS isolates (TA and TV) are given in Table 2. In past, of lot of work related to the classification of TS has been done by other researchers on the basis of morphological and or molecular features (Hermosa et al. 2000; Kullnig et al. 2000; Bissett et al. 2003; Samuels et al. 2006).
Table (2):
A comparative observation (visual and microscopic) of isolates of TS (TA and TV).
| S. No. | Characteristics | Observations | |
|---|---|---|---|
| Isolate 1 (TA) | Isolate 2 (TV) | ||
| 1 | Colony color | Dark green | Cottony Whitish green |
| 2 | Growth pattern | Pigmented dark dry bulgy cottony | Pigmented light dark dry bulgy |
| 3 | Mycelia | Cottony white | Transparent |
| 4 | Conidia shape | Mostly adjoining rings | Mostly single ring |
| 5 | Conidiophore shape | Regular branched structure(with size 2.8 µm x 3.0 µm) | Irregular branched structure (with size 2.6 µm x 2.9 µm) |
| 6 | Phialide shape | Conical flask size 5.2 µm x 3.1µm | Cylinder flask4.0 µm x 2.6 µm |
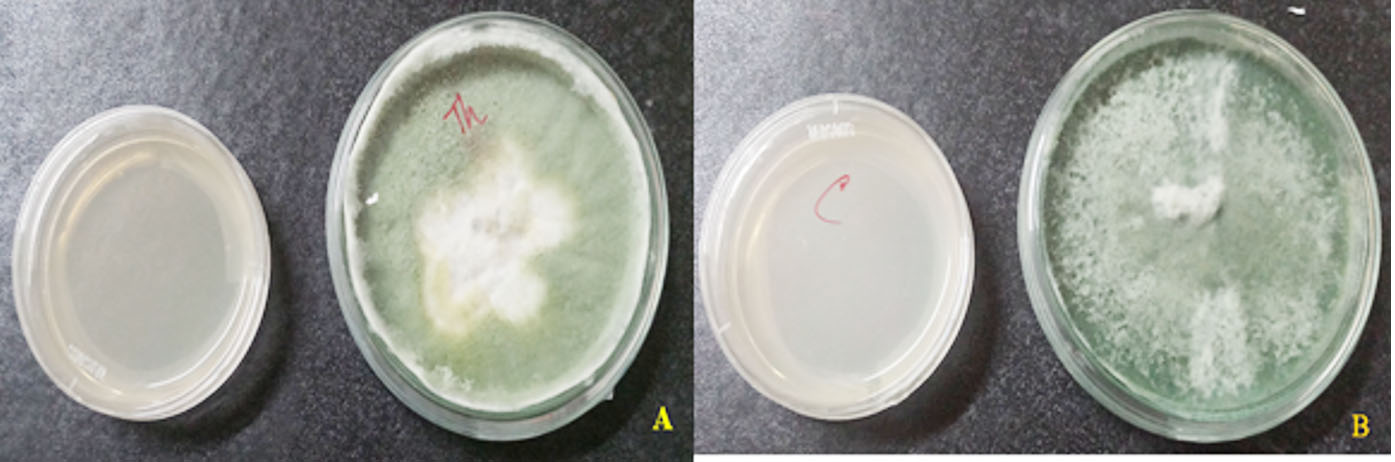
Fig. 1. Growth of isolates (A) T. asperellum and (B) T. viride
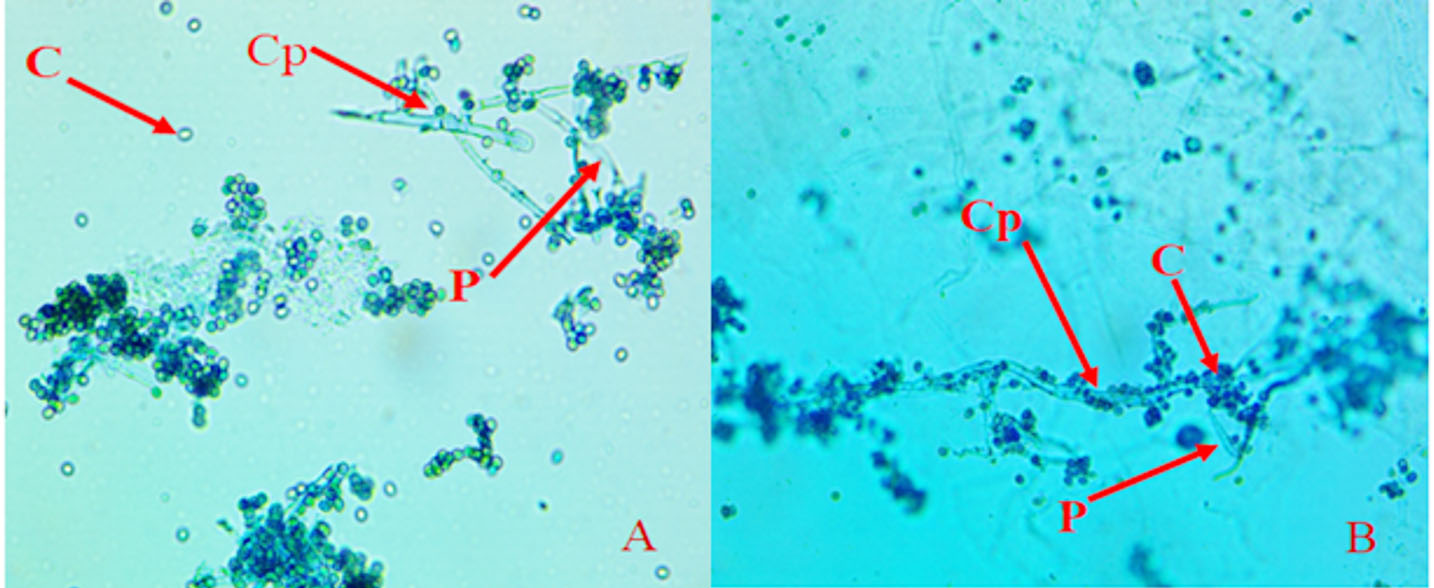
Fig. 2. Microscopic observation of isolates of (A) T. asperellum and (B) T.viride; Where Cp- Conidiophores, P-Phialides and C-Conidia.
Molecular characterization of TS
To further confirm the TS isolates at species level, next-generation genomic sequencing analysis of 18S rRNA (ITS 1 region) was performed. The ITS 1 region sequences of TS isolates TA and TV were submitted to NCBI nucleotide database (https://www.ncbi.nlm.nih.gov/nucleotide/) with accession number MK937669 (570 bp) and MK503705 (573 bp), respectively. Details were shown in Table 3. The BLASTN 2.9.0 similarity search program was used to find homologues sequences against the nucleotide collection (nt/nr) database at default parameters that confirmed the species level nucleotide similarity with the query sequence of the isolates. The query sequences (MK937669 and MK503705) of isolate TA and TV showed 97.16% and 99.82% identity with TA (MH013956) and TV of (JF304319), respectively. In a similar study, isolation and characterization of 96 TS strains including most common isolates (T. harzianum, T, spirale, T. virens, T. coningii, T. asperellum, T. atroviride, T. reesei, T. hamatum, T. viride and T. ghanense) at the species level by the sequence similarity search analysis of an ITS 1 and ITS 2 regions (Kubicek et al. 2003). In a subsequent study of molecular level characterization by Gherbawy et al. (2014), amongst 90 isolates taken from the soil of Taif city (Saudi Arabia), out of which 78 isolates were identified as TS.
Table (3):
Details of molecular characterization of TS isolates.
S.No. |
Designated name of isolate |
Place and source of collection |
GPS location |
Species identified |
Accession No. allotted by NCBI |
|---|---|---|---|---|---|
1 |
TA |
Agricultural land IIM Road Lucknow |
26.9368°N 80.9047° E |
Trichoderma asperllum |
MK937669 |
2 |
TV |
Agricultural land IIM Road Lucknow |
26.9368° N80.9047° E |
Trichoderma viride |
MK503705 |
Optimization of TS growth parameters
TS can be grown through in-vitro culture medium and identified by its green spore or by sweet smell owing to the presence of volatile compound (6-pentyl-a-pyrone) (Gupta et al., 2014; Druzhinina et al., 2006), but different TS may have different optimal environmental conditions for proliferation and development. The environmental parameters such as nutrient components, pH and temperature can restrict their geographical distribution (Carreras-Villasenor et al. 2012). Therefore, present study optimized important process parameters of TS growth such as different media types, pH and temperature. The observations are discussed below.
Effect of different media constituents
The effect of different media constituents as mentioned in Table 1 on growth of TA and TV were observed for 5 days after spot incubation at 28 ± 1°C. The visual growth (formation of spores) was observed after 3 days. On day 5, the maximum growth (radial growth and dry weight) was observed on PDA media constituents while the minimum was found on M9 agar media for both the TS (Fig. 3). However, the significant growth (radial growth and dry weight) variation with respect to different media constituents was observed amongst two species TA and TV estimated using two-way ANOVA (p-value < 0.05). Therefore, PDA media was considered as optimal media and used in the further studies. The above results were found to be in good agreement with the report of Farooq et al. (2005) and Mustafa et al. (2009), where PDA media was also considered as optimal media for growth same TS. In addition, present study also revealed that SDA media can also be used as alternate media for comparable growth of TA and TV. As studied by Lewis, growth of conidia requires nutrients such as nitrogen and carbon sources while chlamydospores and hyphae are not as much depends on exogenous media (Lewis et al., 1983). For instance, as reported by Anand and Reddy (2009), when malt was supplied in place of dextrose for carbon source, it supported the growth of various species of TS.
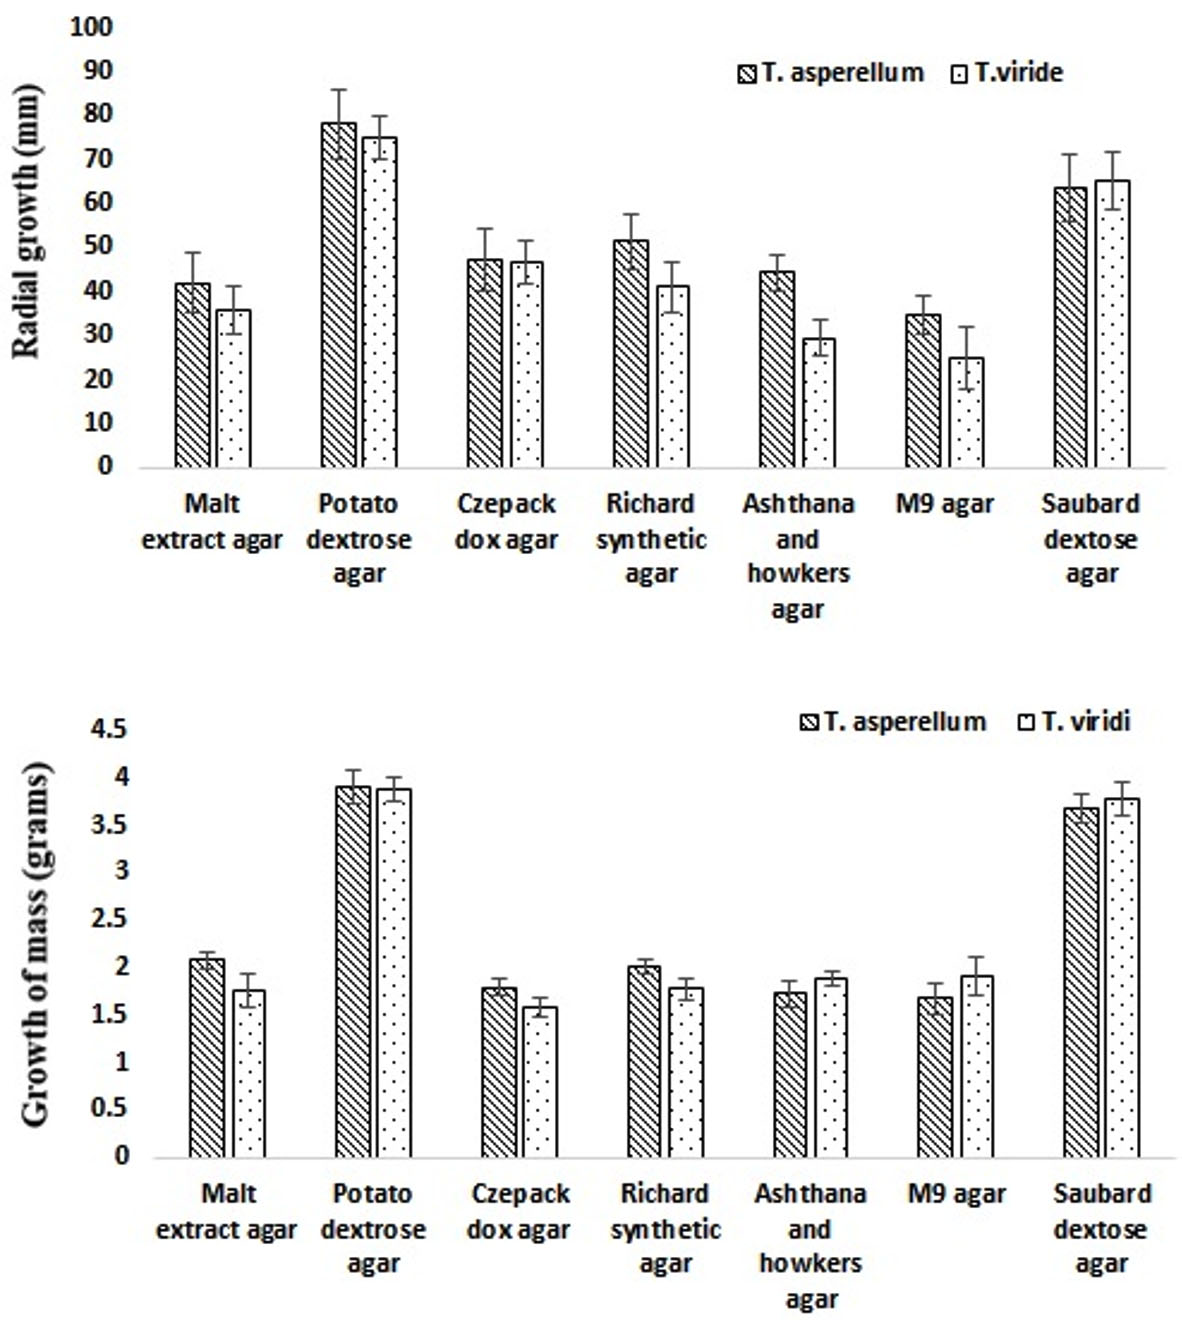
Fig. 3. Radial growth of T. asperllum and T. viride on different media constituents.
Effect of pH
The effect of different pH conditions ranging from 4.0-8.0 with interval of 0.5 on the mycelial growth (in terms of radial and dry weight) of the isolated TA and TV were observed. The maximum growth (both radial and dry weight) of TA was observed at pH 5.5 while in case TV it was obtained at pH 6.5 (Fig. 4). However, the significant growth (in terms of radial and dry weight) variation with respect to different pH was observed amongst two species TA and TV estimated using two-way ANOVA (p-value < 0.05). Similar observations related to growth of TS were obtained by Arfarita et al. (2013), where they reported that TS grow well in a wide range of pH i.e. 4.0–6.5, although maximum growth was observed at pH 5.5. The results of present study are also coherent with the report published by Jayaswal et al. (2003) with respect to optimal pH 6.5 for TS growth. All the species like TA and TV isolated from soil sample were initially produced high biomass at pH 6.5 but slowly the preference was shifted to pH 6.0 when incubation time was increased. It was further observed that the growth and sporulation were decreased with either decreasing the pH below 4.5 or above 6.0 respectively. However, further increasing the pH (above pH 6.0), the growth and sporulation reduced accordingly. At pH 8 and 8.5 the growth and sporulation was very poor. As reported by other research group working in the similar area, acidity of media also controls the growth of TS as the growth of mycelium from conidia was found more in acidic conditions (pH 3.7- 4.7) compared to alkaline. However, in vitro TS growth decreased in alkaline conditions are not supported by in situ observations (Anand and Reddy, 2009; Hamzah et al. 2012). For example, soil samples from Colombia (pH 8.1) and Colorado (pH 5.1) were found to have 108 and 103 TS propagules/g of soil respectively (Kumar, 2013).

Fig. 4. Radial growth of T. asperllum and T. viride on different pH.
Effect of Temperature
In the present study the growth of both TS with respect to effect of temperature was studied. The temperature was varied from 5-35°C with interval of 5°C was observed. The maximum growth (in term of radial growth) of both TS was observed at 25°C incubation temperature. However, the maximum growth (in term of dry weight) of both TS was observed at incubation temperature 30°C. At lower temperature (15°C), the growth (in term of radial) of TA was slightly lower than TV while at higher temperatures (25°C and 30°C) growth of TA was considerably higher as compare to TV. Although, the growth (in term of dry weight) of TA was slightly higher than the TV at optimal temperature (30°C) but less growth was observed at all other operating temperatures (Fig. 5). However, the significant growth (in terms of radial and dry weight) variation with respect to different temperature was observed amongst two species TA and TV estimated using two-way ANOVA (p-value < 0.05). The above results of present study were also supported by study conducted by Choi et al. (2003) where the optimal growth temperature of TS was obtained in the range of 27-30°C. However, Jayaswal et al. (2003) showed a high range of temperature tolerance for TV growth well between temperatures 20-35°C. In general, study conducted by Contreras-Cornejo et al. (2016) confirm that TS require growth temperature in the range of 25-30°C, however some species have different temperature requirements. For example, T. pseudokoningii is found to be most temperature tolerant species and can grow on high temperatures while TV is unable to grow above 28°C (Mukherjee et al., 2016).
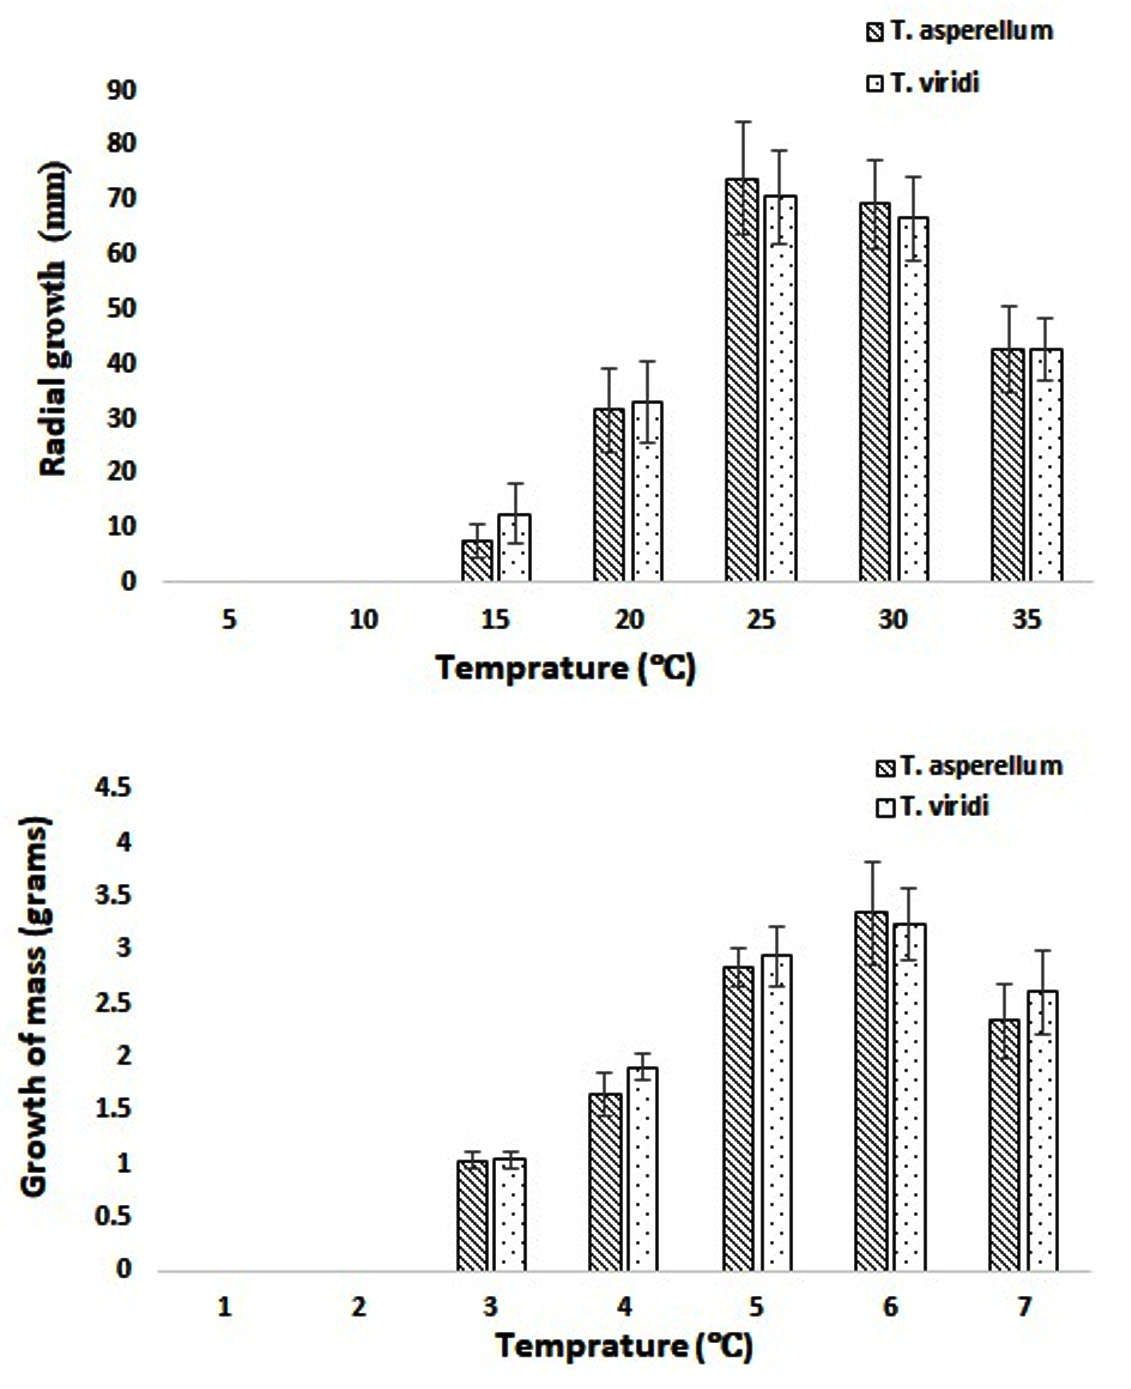
Fig. 5. Growth of T. asperllum and T. viride on different temperatures.
Antagonistic activity of TS
In the past, this dual culture technique has been also reported by number of researchers to investigate the effect of co-inhibion (Ashwin et al., 2012; Suresh et al., 2016; Prince et al., 2011 and Sagarika et al., 2017 ). The antagonistic activity of TS was studied and it was found to be 77.666±4.509% inhibition with TA on CF (CF02 strain) while for TV, it was observed to be 72.666±7.094% inhibition on CF (CF02 strain) at day 5. However, when compared with standard TS (MTCC167), it was observed to be 61.333±6.027% inhibition on CF (CF03 strain) at day 5. The results clearly showed better antagonistic activity of isolated strains than the standard strain. The results were given in Fig 6. The results were found in accordance to the report of Suresh and Nelson (2016), where 6 fungal strains were studied against CF, out of which 2 strains of TS showed maximum inhibition of 0.7 and 0.9mm. In another study by Sangeetha et al (2009), also reported TS to be a potential BA against CF. Moreover, Gaurav et al. (2016) reported the maximum inhibition of mycelial growth of A. niger by 71.42% with T. harzianum. Recently, Ruano et al. (2018) conducted an antagonistic experiment with mixed uses of TS as an antagonist/chemical fungicide to evade the development of pathogenic fungus, where it effectively controls the white root rot disease on infected plants as compare with the chemical fungicide or the antagonist alone. The probable mechanism of antagonistic activity of TS in the present study might be due to two reasons viz. mycoparasitism or antibiosis induced systemic resistance (Mathys et al. 2012). The ability of TS to attack other fungal species (in our case C. falcatum) by the synthesis of mixture of enzymes such as cellulases, chitinases, xylanases etc. that damage cell wal of the pathogen and utilizing its nutrients through ATP binding cassette called mycoparasitism (Atanasova et al. 2013). Similarly, antibiosis is the ability of TS by damaging other fungal species by manufacturing secondary metabolites which includes volatile antibiotics, water-soluble compounds and peptaibols (Zeilinger et al. 2016).
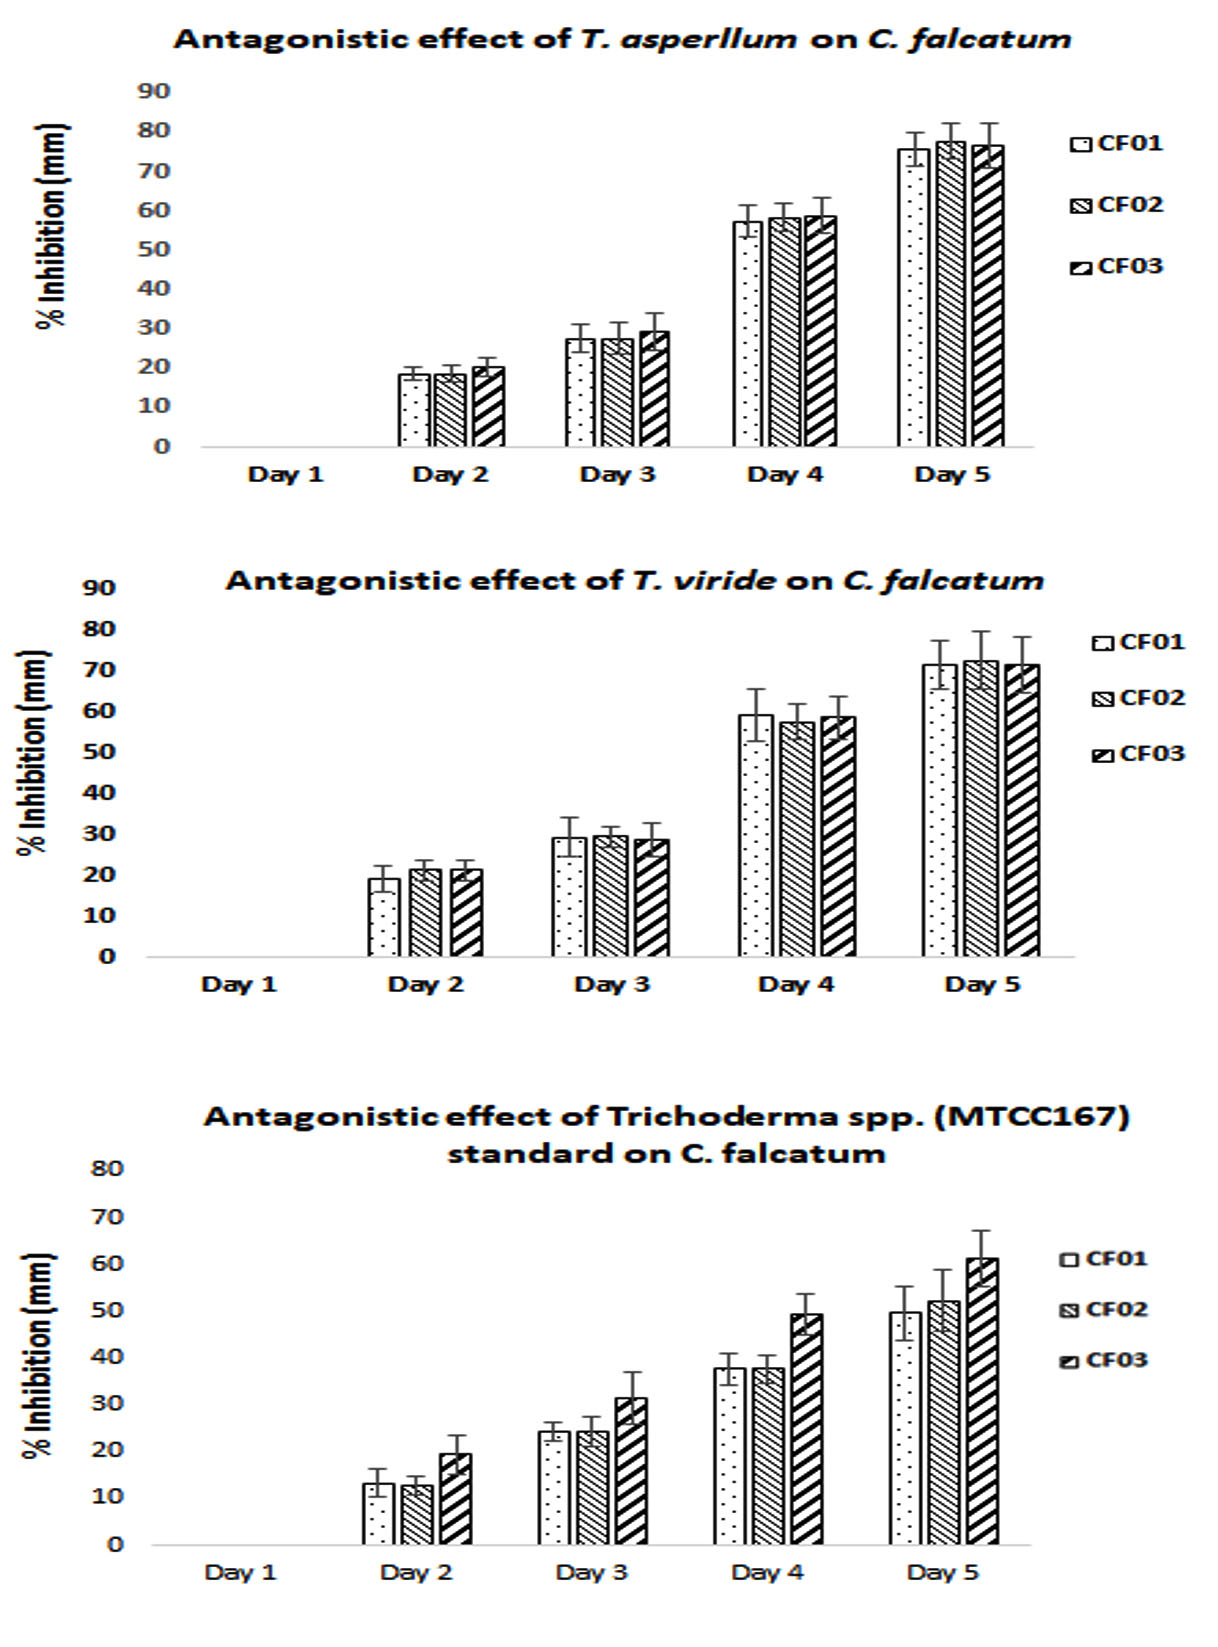
Fig. 6. Antagonistic activity of TS against CF.
Plant growth promoter activity of TS
The use of TS as plant growth promoter is an important aspect of this robustic fungus. In the present study plant growth promotors like IAA and PS was studied. It was found that maximum IAA production with 0.5% of L-tryptophan with 120.308±5.256µg/mL by TA and 130.101±8.995µg/mL by TV when compared to standard TS (MTCC167) with 101.700±9.687µg/mL at 1.0% of L-tryptophan. This clearly indicates the better production of IAA by isolated strains than the standard. However, when PS was studied, it was found maximum at day 5 with 410.285±32.084µg/mL by TA and 459.126±38.629µg/mL by TV. The standard TS (MTCC167) showed 322.216±23.066µg/mL at day 6. It is again proving to be better for isolated strains than the standard. The detailed results are given in Fig 7. When two-way ANOVA was applied between TA and TV, it was found to be significant with p-value< 0.05. It was found to be 0.0006 for IAA production at different concentration of L-tryptophan used. When analyzed for PS p-value was found to be 0.0002. The results were in accordance with the report of Kumar et al (2017), where TV showed virtuous production of IAA with 115µg/mL at 0.5% L-tryptophan. Yadav et al., (2011) also reported production of IAA by means of different fungal isolates viz. T. harzianum (68µg/mL) and Aspergillus niger (85µg/mL) and Penicillium citrinum (52µg/mL) at 30°C and only for 3 days of incubation. However, the reports for PS were found to be in virtuous agreement with Kapri and Tewari (2010) where fourteen strains of TS were studied for PS as a potent plant growth promoter. Danilo et al (2017) also reported that 16 isolates of TS as a potential PS and growth promoter in cherry tomato, where TA was found to be most effective.
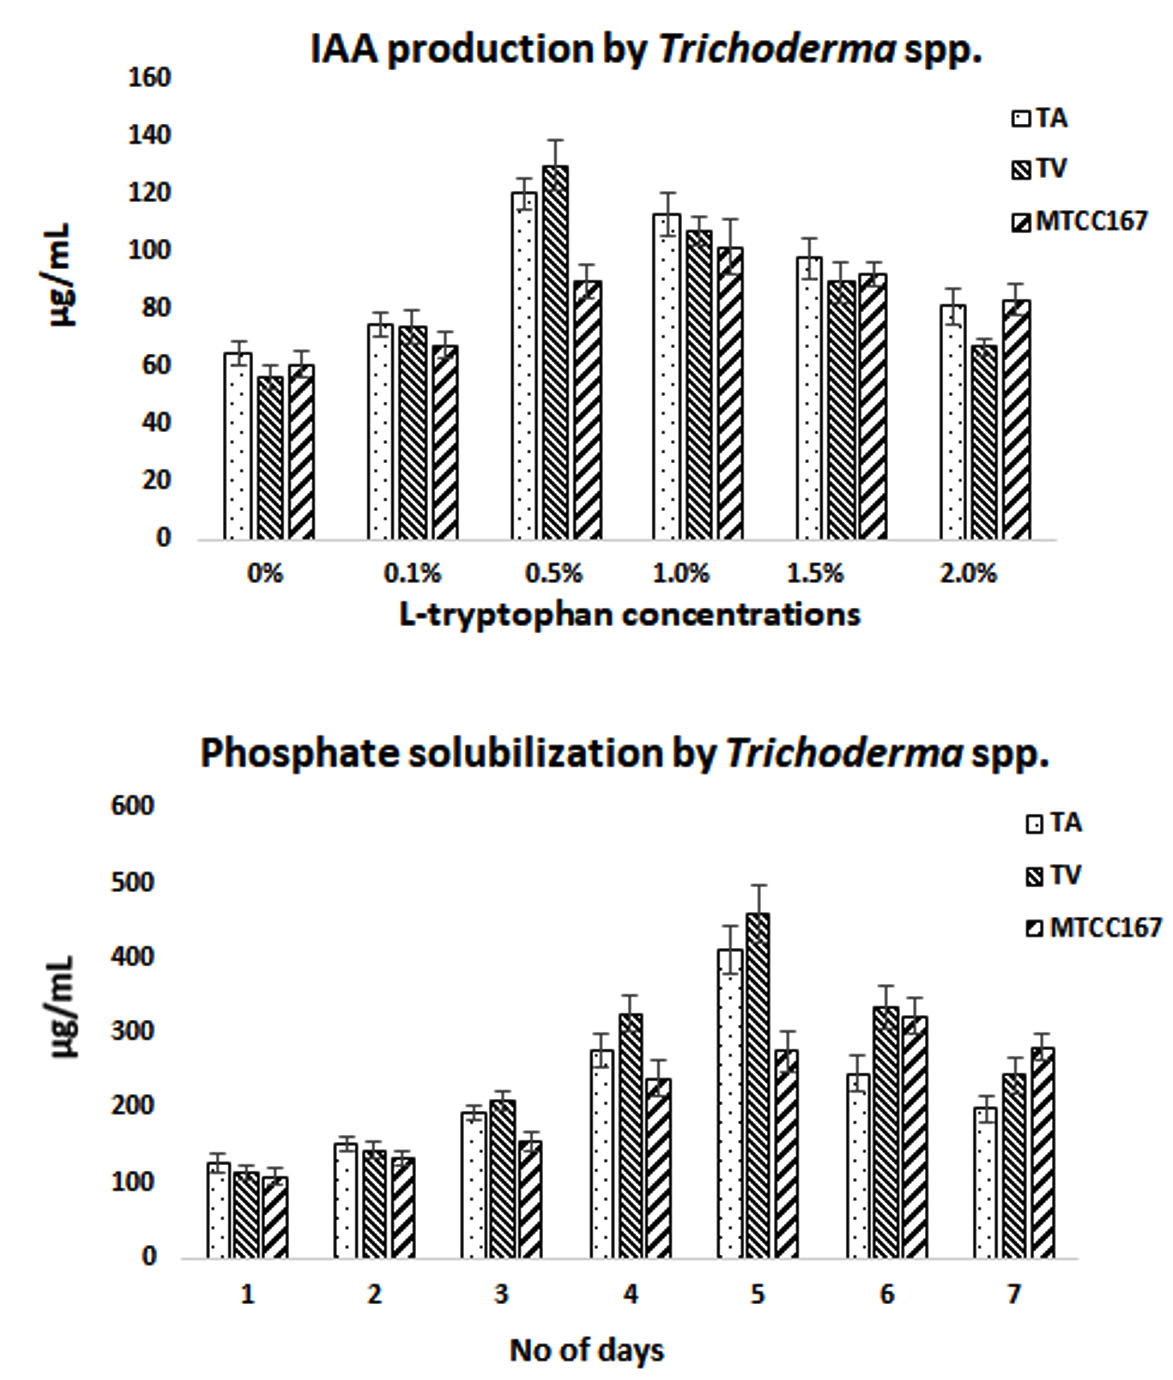
Fig. 7. Plant growth promoter activity of TS.
The nonstop co-evolution of fungal pathogens along with resistance developed in different emerging pathogens due to constant use of hazardous agrochemicals (fungicides) lead towards the development of multi-applicative and safe BA with PGP activity is very useful. The recent development in biotechnology offers promising aspects for the improvement of TS against various fungal pathogens because they exhibit very little effect on other non-targeted organisms. Conclusively, isolated Trichoderma species TA and TV could not completely inhibit the growth of red rot disease compare to agrochemicals but they are capable to manage the disease occurrence to a lesser level (more than 80%) without harm of the crops in addition with potential to provide growth supplements. It was further observed that the isolated strains TA and TV were better that the standard used. Additionally, they can be also utilized in a mixture containing traditional agrochemicals for more effective and quick red rot disease control. Besides, commercializations of Trichoderma species are cost-effective, simple to apply and safer for environment. Moreover, there is still scope to do more research work on isolation and use of new Trichoderma species as BA and PGP to develop more efficient and lucrative strategy for the benefits to consumers and agro-industries.
ACKNOWLEDGMENTS
Authors are thankful to Amity University Uttar Pradesh for providing basic lab facility to conduct this research. We are also thankful to ICAR-Central Institute for Subtropical Horticulture (CISH), for their kind support.
CONFLICT OF INTEREST
The authors declare no conflict of interest, financial or otherwise.
AUTHORS’ CONTRIBUTION
Z.H. and M.S.I. conducted the laboratory work and writing the manuscript. J.P., S.K.A. A. and S.P.S. worked as a group leader for this research.
FUNDING
None.
ETHICS STATEMENT
This article does not contain any studies with human participants or animals performed by any of the authors.
AVAILABILITY OF DATA
All datasets generated or analyzed during this study are included in the manuscript.
- Agnihotri VP. Diseases of sugarcane and sugar beet. Oxford & IBH, 1990 Pub. Co., New Delhi, 483p.
- Albersheim P, Valent VS. Plant pathogens secrete proteins which inhibit enzymes of the host capable of attacking the pathogen. Plant Physio,1974; 53: 684–87.
Crossref - Ashwin I, Lunge G, Anita PS. International Journal of Science, Environment and Technology, 2012; 1(5): 377 – 385.
- Anand S, Reddy J. Biocontrol potential of Trichoderma Sp. against plant pathogens. International J. Agric. Sci., 2009; 1: 30–39.
Crossref - Bandyopadhyay S, Subhendu J, Dutta S. Effect of different pH and temperature levels on growth and sporulation of Trichoderma. Environ E col., 2003; 21: 770-773.
- Atanasova L, Le Crom S, Gruber S, Coulpier F, Seidl-Seiboth V, Kubicek CP, Druzhinina IS. Comparative transcriptomics reveals different strategies of Trichoderma mycoparasitism, BMC Genomics, 2013; 14.
Crossref - Begoude BA, Lahlali R, Friel D, Tondje PR, Jijakli MH. Response surface methodology study of the combined effects of temperature, pH, and aw on the growth rate of Trichoderma asperellum. J Appl Microbiol, 2007; 103: 845-854.
Crossref - Bissett J, Szakacs G, Nolan CA, Druzhinina I, Gradinger C, Kubicek CP. New species of Trichoderma from Asia, Can. J. Bot., 2003; 81: 570–586.
Crossref - Chandra SY, Khayum AS, Prasad TNVKV, Sarada, JDR. Identification of Trichoderma spp. based on morphological character isolated from rhizosphere of groundnut (Arachispogaeal) International Journal of Science, Environment and Technology, 2017; 6(3): 2056 – 2063.
- Choi, Young, Gi-Tae J, Joung-Sik C, and Yeong-Geun C. Physiological characteristics of green mold (Trichoderma sp.) isolated from oyster mushroom, Mycobiology,2003; 31(3): 139-144.
Crossref - Contreras-Cornejo HA, Macias-Rodriguez L, del-Val E, Larsen J. Ecological functions of Trichoderma spp. and their secondary metabolites in the rhizosphere: interactions with plants, FEMS Microbiol. Ecol., 2016; 92.
Crossref - Carreras-Villasenor N, Sanchez-Arreguin JA, Herrera-Estrella AH. Trichoderma: Sensing the environment for survivaland dispersal, Microbiology, 2012; 158: 3–16. 896.
Crossref - Domsch KH, Gams W, Anderson T. Compendium of Soil Fungi, Academic Press, London, UK. 1993; 2: 136-140.
- Davet P, Rouxel F. Detection and isolation of soil fungi. Science Publishers, Inc,2000; 188.
- Druzhinina IS, Kopchinskiy AG, Kubicek CP. The first 100 Trichoderma species characterized by molecular data, Mycoscience, 2006; 47: 55–64.
Crossref - Dandge VS. Effect of some fungicide on growth (in mm) of Curvularia lunata, Fusarium equiseti, Phoma vulgaris and Botryodiplodia theobromae. Journal of Experimental Sciences, 2012; 3(3): 19-20.
- Danilo VCF, Katia CK, Marcia MRM, Tamara MG, Fabricio R. Trichoderma spp. isolates with potential of phosphate solubilization and growth promotion in cherry tomato. Pesq. Agropec. Trop., Goiania, 2017; 47(4): 360-368.
Crossref - Flegel TW. Semipermanent microscope slides of microfungi using sticky tape technique, Canadian Journal of Microbiology, 1980; 26: 551-553.
Crossref - Ferdous A, Giush Uddin AMD, Firoz AM, Surovi S, Ahsanur RM. Evaluation of organic culture media for mass production of Trichoderma harzianum. International Journal of Microbiology and Mycology, 2016; 4(2): 1-9.
- Fiske CH, Subbarow Y. A colorimetric determination of phosphorus. J. Biol. Chem, 1925; 66: 375-400.
- Farooq S, Muhammad I, Rauf A. Physiological Studies of Fusarium oxysporum f. sp. ciceri, International Journal of Agriculture & Biology,2005; 7(2): 275–277.
- Guinea J, Pelaez T, Alcala L, Bouza E. Evaluation of Czapeck agar and Sabouraud dextrose agar for the culture of airborne Aspergillus conidia. Diagnostic Microbiology and Infectious Disease, 2005; 53(4): 333–334.
Crossref - Gawade DB, Pawar BH, Gawande SJ, Vasekar VC. Antagonistic Effect of Trichoderma Against Fusarium moniliformae the Causal of Sugarcane Wilt. American-Eurasian J. Agric. & Environ. Sci., 2012; 12(9): 1236-1241.
- Gupta VK, Schmoll M, Herrera-Estrella A, Upadhyay RS, Druzhinina I, Tuohy MG. Biotechnology and Biology of Trichoderma.
- Gherbawy Y, Hussein A, Nemmat A, Al-Qurashi Abeer A. Molecular Characterization of Trichoderma Populations Isolated from Soil of Taif City, Saudi Arabia. Int. J. Curr. Microbiol. App.Sci., 2014; 3(9): 1059-1071.
- Gveroska B, Ziberoski J.Trichoderma harzianum as a biocontrol agent against Alternaria alternata on tobacco, Appl. Technol. Innov., 2012; 7: 67–76.
Crossref - Gaurav B, Rao VM. Screening of antagonistic potential of Trichoderma species against seed-borne pathogenic fungi in seeds of Sorghum vulgare. Journal of Environmental Science and Technology, 2016; 4(1): 59-64.
- Harman GE, Petzoldt R, Comis A, Chen J. Interactions between Trichoderma harzianum strain T22 and maize inbred line Mo17 and effects of this interaction on diseases caused by Pythium ultimum and Colletotrichum graminicola. Phytopathology, 2004; 94: 147-153.
Crossref - Hamzah MA, Zarin AA, Hamid O, Omar S, Senafi. Optimal physical and nutrient parameters for growth of Trichoderma virens UKMP-1M for heavy crude oil degradation, Sains Malaysiana, 2012; 41: 71–79.
- Hermosa MR, Inturriaga GEA, Diaz-Minguez J, Castro C, Monte E, Garcia-Acha I. Molecular Characterization and Identification of Biocontrol Isolates of Trichoderma spp. Molecular Characterization and Identification of Biocontrol Isolates of Trichoderma spp.,714 Appl. Environ. Microbiol, 2000; 66: 1890–1898.
Crossref - Hermosa R, Viterbo A, Chet I, Monte E. Plant-beneficial effects of Trichoderma and of its genes, Microbiology, 2012; 158: 17–25.
Crossref - Imeson AP.Carrageenan, In GO. Phillips and PA. Williams (eds.), Handbook of Hydrocolloids, Cambridge: Woodhead Publishing, pp.2000; 87–102.
- Jayaswal RK, Singh R, Yu Su Lee. Influence of physiological and environmental factors on growth and sporulation of or antagonistic strains of Trichoderma viride RSR-7, Microbiology, 2003; 31(1): 36-41.
Crossref - Kredics L, Manczinger L, Antal Z, Penzes Z, Szekeres A. In vitro water activity and pH dependence of mycelial growth and extracellular enzyme activities of Trichoderma strains with biocontrol potential. J Appl Microbiol, 2004; 96: 491-498.
Crossref - Kumar NV, Rajam KS, Rani ME. Plant Growth Promotion Efficacy of Indole Acetic Acid (IAA) Produced by a Mangrove Associated Fungi-Trichoderma viride VKF3. International Journal of Current Microbiology and Applied Sciences, 2017; 6(11): 2692-2701.
Crossref - Kumar V. Optimal Physical Parameters for Growth of Trichoderma 932 Species at Varying pH, Temperature and Agitation, Virol. Mycol., 2013; 03.
Crossref - Khalili E, Sadravi M, Naeimi S, Khosravi V. Biological control of rice brown spot with native isolates of three trichoderma species, Brazilian J. Microbiol., 2012; 43: 297–305.
Crossref - Kubicek CP Bissett J, Druzhinina I, Kullnig-Gradinger C, Szakacs G. Genetic and metabolic diversity of Trichoderma: A case study on South-East Asian isolates, Fungal Genet. Biol., 2003; 38: 310–319.
Crossref - Kapri A, Tewari L. Phosphate Solubilization Potential and Phosphatase Activity of Rhizospheric Trichoderma spp. Brazilian Journal of Microbiology, 2010; 41: 787-95.
Crossref - Klyce SD. Computer-assisted corneal topography. High-resolution graphic presentation and analysis of keratoscopy, Investig. Ophthalmol. Vis. Sci., 1984; 25: 1426–1435.
- Kullnig G, Szakacs CP, Kubicek. Molecular identification of Trichoderma species from Russia, Siberia and the Himalaya, Mycol. Res., 2000; 104: 1117–1125.
Crossref - Lam E, Shine JJ, Da Silva J, Lawton M, Bonos S, Calvino M, Carrer H, Silva-Filho MC, Glynn N, Helsel Z Ma J, Richard-Jr F, Souza GM Ming R. Improving sugarcane for biofuel: engineering for an even better feedstock. Glob. Chang. Biol. Bioenergy, 2009; 1: 251– 255.
Crossref - Lee J, Huh N, Hong JH, Kim BS, Kim GH, Kim JJ. The antagonistic properties of Trichoderma spp. inhabiting woods for potential biological control of wood-damaging fungi, Holzforschung, 2012; 66: 883–887.
Crossref - Lewis JA, Papavizas GC. Production of chlamydospores and conidia by Trichoderma spp in liquid and solid growth media, Soil Biol. Biochem., 1983; 15: 351–357.
Crossref - Ming R, Moore PH, Wu KK D’ Hont A, Tew TL, Mirkov TE, da Silva J, Schnell RJ, Brumbley SM, Lakshmanan P, Jifon J, Rai M, Comstock JC, Glaszmann JC Paterson AH. Sugarcane improvement through breeding and biotechnology. Plant Breed. Rev., 2006; 27: 17–118.
- Mastouri F, Bjorkman T, Harman GE. Seed treatment with Trichoderma harzianum alleviates biotic, abiotic, and physiological stresses in germinating seeds and seedlings. Phytopathology, 2010; 100: 1213–1221.
Crossref - Mastouri F, Bjorkman T, Harman GE. Trichoderma harzianum enhances antioxidant defense of tomato seedlings and resistance to water deficit. Mol. Plant Microbe Interact, 2012; 25: 1264–1271.
Crossref - Mukherjee M, Mukherjee PK, Horwitz BA, Zachow C, Berg G, Zeilinger S. Trichoderma-Plant-Pathogen Interactions: Advances in Genetics of Biological Control, Indian J. Microbiol., 2012; 52: 522–529.
Crossref - Mahuku GS. A simple extraction method suitable for PCR based analysis of plant, fungal and bacterial DNA. Plant Mol. Biol. Rep., 2004; 22(71): 81.
Crossref - Mustafa A, Khan MA, Inam-ul-Haq M, Pervez MA, Ummad-ud-Din U. Usefulness of different culture media for in vitro evaluation of Trichoderma, Phytopathol., 2009; 21(1): 83-88.
- Mathys J, Cremer KDe, Timmermans P, Kerckhove SVan, Lievens B, Vanhaecke M, Cammue BPA, Coninck BD. Genome-Wide Characterization of ISR Induced in Arabidopsis thaliana by Trichoderma hamatum T382 Against Botrytis cinerea Infection, Front. Plant Sci., 2012; 3.
Crossref - O’Brien PA. Biological control of plant diseases, Australas. Plant Pathol., 2017; 46: 293– 630 304.
Crossref - Prapagdee B, Kuekulvong C, Mongkolsuk S. Antifungal potential of extracellular metabolites produced by Streptomyces hygroscopicus against phytopathogenic fungi. Intl J Biol Sci., 2008; 4: 330–37.
Crossref - Prince L, Raja A, Prabakaran P. Antagonastic potentiality of some soil mycoflora against Colletotrichum falcatum. World Journal of Science and Technology, 2011; 1(4): 39-42.
- Rott P, Bailey RA, Comstock JC, Croft BJ, Saumtally AS. A guide to sugarcane diseases. CIRAD, Montpellier,2000, 339.
- Rahel RY, Nagamani A, Sarogni CK. Trichoderma species diversity in japanese mint field soil. International Journal of Advanced Scientific and Technical Research, 2014; 4(4): 379-387.
- Ruano-Rosa D, Arjona-Girona I, LOpez-Herrera CJ. Integrated control of avocado white root rot combining low concentrations of fluazinam and Trichodermaspp. Crop Protection, 2018; 112: 363-370.
Crossref - Suresh N, Nelson R. Isolation of antagonistic fungi and evaluation of antifungal activity of the separated metabolite against the red rot of sugarcane pathogen. European Journal of Experimental Biology, 2016; 6(1): 15-21.
- Shuping DSS, Eloff JN. The use of plants to protect plants and food against fungal pathogens: a review. Afr J Tradit Complement Altern Med., 2017; 14(4): 120–127.
Crossref - Satyavir. Red rot of sugarcane: Current scenario. Indian Phytopath., 2003; 56: 245-254.
- Singh V, Joshi BB, Awasthi SK, Srivastava SN. Eco-friendly management of red rot disease of sugarcane with Trichoderma strains. Sugar Tech., 2008; 10(2): 158-161.
Crossref - Singh V, Srivastava SN, Lal RJ, Awasthi SK, Joshi BB. Biological control of red rot disease of sugarcane through Trichoderma harzianum and Trichoderma viride. Indian Phytopath., 2008; 61(4): 486–491.
- Smith BR. Storage of ascospores in water. Neurospora Newsletter, 1973; 20-34.
Crossref - Singh PP, Shin YC, Park CS, Chung YR. Biological control of Fusarium wilt of cucumber by Chitinolytic bacteria. Phytopath., 1999; 89: 92–99.
Crossref - Samuels J, Gary. Trichoderma: Systematics, the Sexual State, and Ecology. Phytopathology, 2006; 96(2): 95-206.
Crossref - Singh A, Shahid M, Srivastava M, Pandey S, Sharma A, Kumar V. Optimal physical parameters for growth of Trichoderma Species at varying pH, temperature and agitation. Journal Virology&Mycology, 2014; 3: 127.3:1.
- Sachan S, Iqbal MS, Singh A. Extracellular lipase from Pseudomonas aeruginosa JCM5962 (T): Isolation, identification, and characterization. International Microbiology, 2018; 21.
Crossref - Sheila A, Okoth Odhiambo J. Influence of soil chemical and physical properties on Trichoderma spp. Occurrence in Taita region, Tropical and Sub tropical Ecosystems, 2009; 11: 403-413.
- Samuels GJ, Suarez C, Solis K, Holmes KA, Thomas SE, Ismaiel A, Evans HC. Trichoderma theobromicola and T. paucisporum: two new species isolated from cacao in South America, Mycol. Res., 2006; 110(723): 381–392.
Crossref - Sangeetha, Mohai S, Neelamegam R. In vitro evaluation of fungal and bacterial antagonists against Colletotrichum falcatum Went A. J. Biol. Control, 2009; 23(3): 333–336.
- Shaiesta, Shah, Sahera, Nasreen, Sheikh PA. Cultural and Morphological Charactrization of Trichoderma spp. Associated with Green Mold Disease of Plourotus spp. in Kashmir. Research Journal of Microbiology, 2012; 7: 139-144.
Crossref - Sagarika K, Dharmarathna RMGCS, Jayarathna DL. Isolation, identification and characterization of Trichoderma Species as a potential biocontrol agent against Ceratocystis paradoxa. The Journal of Agricultural Sciences, 2017; 12(1): 51-62.
Crossref - Viswanathan R, Malathi P. Biocontrol strategies to manage fungal diseases in Sugarcane. Sugar Tech.,
Crossref - Viswanathan R, Sundar AR, Premkumari SM. Mycolytic effect of extracellular enzymes of antagonistic microbes to Colletotrichum falcatum, red rot pathogen of sugarcane. World J Microbiol Biotechnol, 2003; 19: 953–59.
Crossref - Vinale F, Sivasithamparam K, Ghisalberti EL, Marra R, Woo SL, Lorito M. Trichoderma-plant-pathogen interactions, Soil Biol. Biochem., 2008; 40: 1–10.
Crossref - Verma M, Brar SK, Tyagi RD, Surampalli RY, Valero JR. Antagonistic fungi, Trichoderma spp.: Panoply of biological control, Biochem. Eng. J., 2007; 37: 1–20.
Crossref - Widmer TL. Compatibility of Trichoderma asperellumisolates to selected soil fungicides. Crop Protection, 2019; 120: 91-96.
Crossref - Woo SL, Michelina R, Francesco V, Marco N, Roberta M, Nadia L, Alberto P, Stefania L, Gelsomina M, Matteo L. Trichoderma-based Products and their Widespread Use in Agriculture. The Open Mycology Journal, 2014; 8(Suppl-1, M4): 71-126.
Crossref - Yadav, Janardan, Verma JT, Kavindra. Plant Growth Promoting Activities of Fungi and their Effect on Chickpea Plant Growth. Asian Journal of Biological Sciences, 2011; 4: 291-299.
Crossref - Zeilinger S, Gruber S, Bansal R, Mukherjee PK. Secondary metabolism in Trichoderma Chemistry meets genomics, Fungal Biol. Rev., 2016; 30: 74–90.
Crossref
© The Author(s) 2020. Open Access. This article is distributed under the terms of the Creative Commons Attribution 4.0 International License which permits unrestricted use, sharing, distribution, and reproduction in any medium, provided you give appropriate credit to the original author(s) and the source, provide a link to the Creative Commons license, and indicate if changes were made.