

ISSN: 0973-7510
E-ISSN: 2581-690X
COVID-19 has caused millions of casualties and deaths around the world. Countries all over the world exert great efforts to control the fast spread of the disease. Rapid diagnosis is a key tool in controlling the infection; therefore, numerous diagnostic techniques were developed quickly and are available commercially. This study evaluated the use of nucleocapsid antigen (N-antigen) as a diagnostic tool in COVID-19 patients. A cross-sectional investigation was carried out on 164 people undergoing Severe Acute Respiratory Syndrome Coronavirus 2 (SARS-CoV-2) PCR testing at various government laboratories in Alexandria. The research was carried out between March 2021 and January 2022. Data such as symptoms, lab investigations and real-time reverse transcription polymerase chain reaction (RT-PCR) cycle threshold (Ct) values were collected by interviewing participants and from medical records. A serum sample was collected from each participant for detection of N-antigen by ELISA kit. Ninety-eight (59.8%) of the 164 examined participants had positive SARS-CoV-2 RT-PCR results. Thirteen individuals (18.9%) exhibited varying quantities of the SARS-CoV-2 N-antigen. Antigen concentrations were significantly inversely connected with RT-PCR Ct values and positively correlated with CRP levels in SARS-CoV-2 N-antigen positive subjects. Furthermore, a strong correlation was found between N-antigen concentrations and hospitalization, fever, body aches, and pneumonia. SARS-CoV-2 N-antigen detection has high specificity (98.5%) but very low sensitivity (30.6%). Despite the high specificity of the SARS-CoV-2 N-antigen enzyme-linked immunosorbent assay (ELISA) evaluated in this study, its diagnostic utility is limited by its low sensitivity. The assay’s poor sensitivity undermines its standalone diagnostic value, especially when compared to RT-PCR.
SARS-COV-2 Nucleocapsid Antigen, COVID-19 Diagnosis, Serology, PCR
In Wuhan, China, a new, highly contagious illness that resembles viral pneumonia in its clinical manifestations initially surfaced in December 2019.1 SARS-CoV-2 was found to be the causal agent. It belongs to the genus Beta-coronaviruses under the family Coronaviridae, which, in contrast to other coronaviruses, causes significant morbidity and mortality.2 When it comes to diagnosing COVID-19, RT-PCR is thought to be the most precise technique available. However, it is a complicated technique that requires well trained professionals, special equipment, high costs and long time for preparing and processing samples.3
Testing for antiviral antibodies should not be used alone in early diagnosis of COVID-19 because they do not appear until days after the onset of the infection. Furthermore, they persist for long time even after clearance of the virus; therefore, their presence in the serum is just an indication of previous viral exposure.4
In contrast, the detection of viral antigens offers significant diagnostic advantages, particularly in the early phase of infection. Antigen-based assays, especially those targeting the N protein of SARS-CoV-2, can detect the presence of viral components shortly after infection and prior to seroconversion. Serum-based antigen detection methods offer additional clinical value by enabling minimally invasive sampling, facilitating early diagnosis during the viremic phase, and reducing biosafety risks associated with respiratory specimen collection. Several studies report high specificity for rapid antigen detection tests, although their sensitivity remains variable and context-dependent.5,6
Given the urgency of identifying infectious individuals to curb transmission chains, this study aimed to evaluate the diagnostic performance of a serum-based SARS-CoV-2 N antigen detection assay. This evaluation may provide more information regarding its potential application as a rapid and scalable diagnostic tool for early-phase COVID-19 detection, facilitating timely clinical and public health interventions.
This cross-sectional investigation was conducted on 164 people who were suspected of having SARS-CoV-2 infection and were attending several government laboratories in Alexandria between March 2021 and January 2022.
Sample size
The bare minimum sample size needed was determined using data from an earlier investigation that looked for SARS-CoV-2 antigen in COVID-19 patients’ blood.7 By using sensitivity of 93%, specificity of 98.4% and prevalence 78.3%, estimation error 1.0, alpha 0.05, the minimal required sample size was found to be 67.8 The number of participants was increased to 164 to compensate for potential data loss and to mitigate selection bias.
Participants were consecutively included in this study from different governmental laboratories. The study protocol was approved by the Ethics Committee of the High Institute of Public Health (HIPH). Prior to their inclusion in the study procedure, all participants were requested to voluntarily participate in this research, and their informed written consents were obtained.
An interview sheet including demographic and clinical data was filled for each participant including name, age, residence, lab investigations as C-reactive protein concentration and the Ct value from PCR result. Lymphocytic count <1000/µl was considered lymphopenia, CRP > 5 mg/l was considered above normal level.
Collection and processing of samples
Sampling
A blood sample of three ml was collected from each participant using vacutainer under aseptic technique. After letting the samples clot, the sera were separated using a centrifuge running at 6000 rpm. They were divided into aliquots and kept at -80 °C for detection of the SARS-CoV-2 N antigen.
Quantitative detection of nucleocapsid antigen by ELISA assay
The quantitative detection of N-antigen was done using Human SARS-CoV-2 N ELISA Kit Ref. (EH49RB) manufactured by Invitrogen, Thermo Fisher Scientific, USA.
Test principle
The Human SARS-CoV-2 N ELISA Kit is a solid-phase sandwich ELISA designed to detect and quantify SARS-CoV-2 N-antigen in human serum. Wells are pre-coated with a monoclonal anti-SARS-CoV-2 N-antibody. Diluted serum samples are added. If N-antigen is present, it binds to the immobilized antibody. Enzyme conjugation, Streptavidin-HRP binds to the biotin on the secondary antibody. TMB substrate is added. In the presence of HRP, blue color develops. A stop solution is added, converting the blue color to yellow. Absorbance is measured at 450 nm. The intensity of the yellow color correlates with the concentration of N-antigen.
Statistical analysis
Data entry and statistical analysis were performed using MedCalc software (versions 25.0 and 20.116) and IBM SPSS Statistics (version 25.0). Qualitative variables were expressed as frequencies and percentages. Quantitative data were assessed for normality using the Kolmogorov-Smirnov test. As the data did not follow a normal distribution, they were described using range (minimum-maximum), mean ± standard deviation (SD), and median with interquartile range (IQR). A significance level of p < 0.05 was considered statistically significant.
The following statistical tests were applied:
Spearman’s rho correlation
Used to evaluate the relationship between non-normally distributed quantitative variables.
Mann-Whitney U test
A non-parametric test used to compare two independent groups with non-normally distributed continuous data.
Chi-square test
Applied to assess associations between categorical variables in 2 × 2 contingency tables.
Receiver Operating Characteristic (ROC) curve analysis
Used to determine the optimal cutoff value for the antigen concentration, as well as to assess diagnostic accuracy through area under the curve (AUC) metrics.
The study analyzed 164 participants with a median age of 63.5 years; 58% were male. Common clinical features included body aches (57%), fever (48.8%), cough (39%), and pneumonia (34.1%), with an equal proportion requiring hospitalization. Elevated CRP (>5 mg/l) levels were detected in 84.1% and lymphopenia (<1000 cell/µl) in 65.2% of the cohort.
N-antigen positivity and concentrations were significantly higher in females and among those presenting with fever, body aches, cough, pneumonia, hospitalization, and elevated CRP (Table 1 and 2). No significant differences were observed with age or lymphocyte count. A positive correlation was found between CRP and N-antigen levels, while a strong inverse correlation was noted between N-antigen levels and RT-PCR Ct values (Table 3, Table 4 and Figure 1).
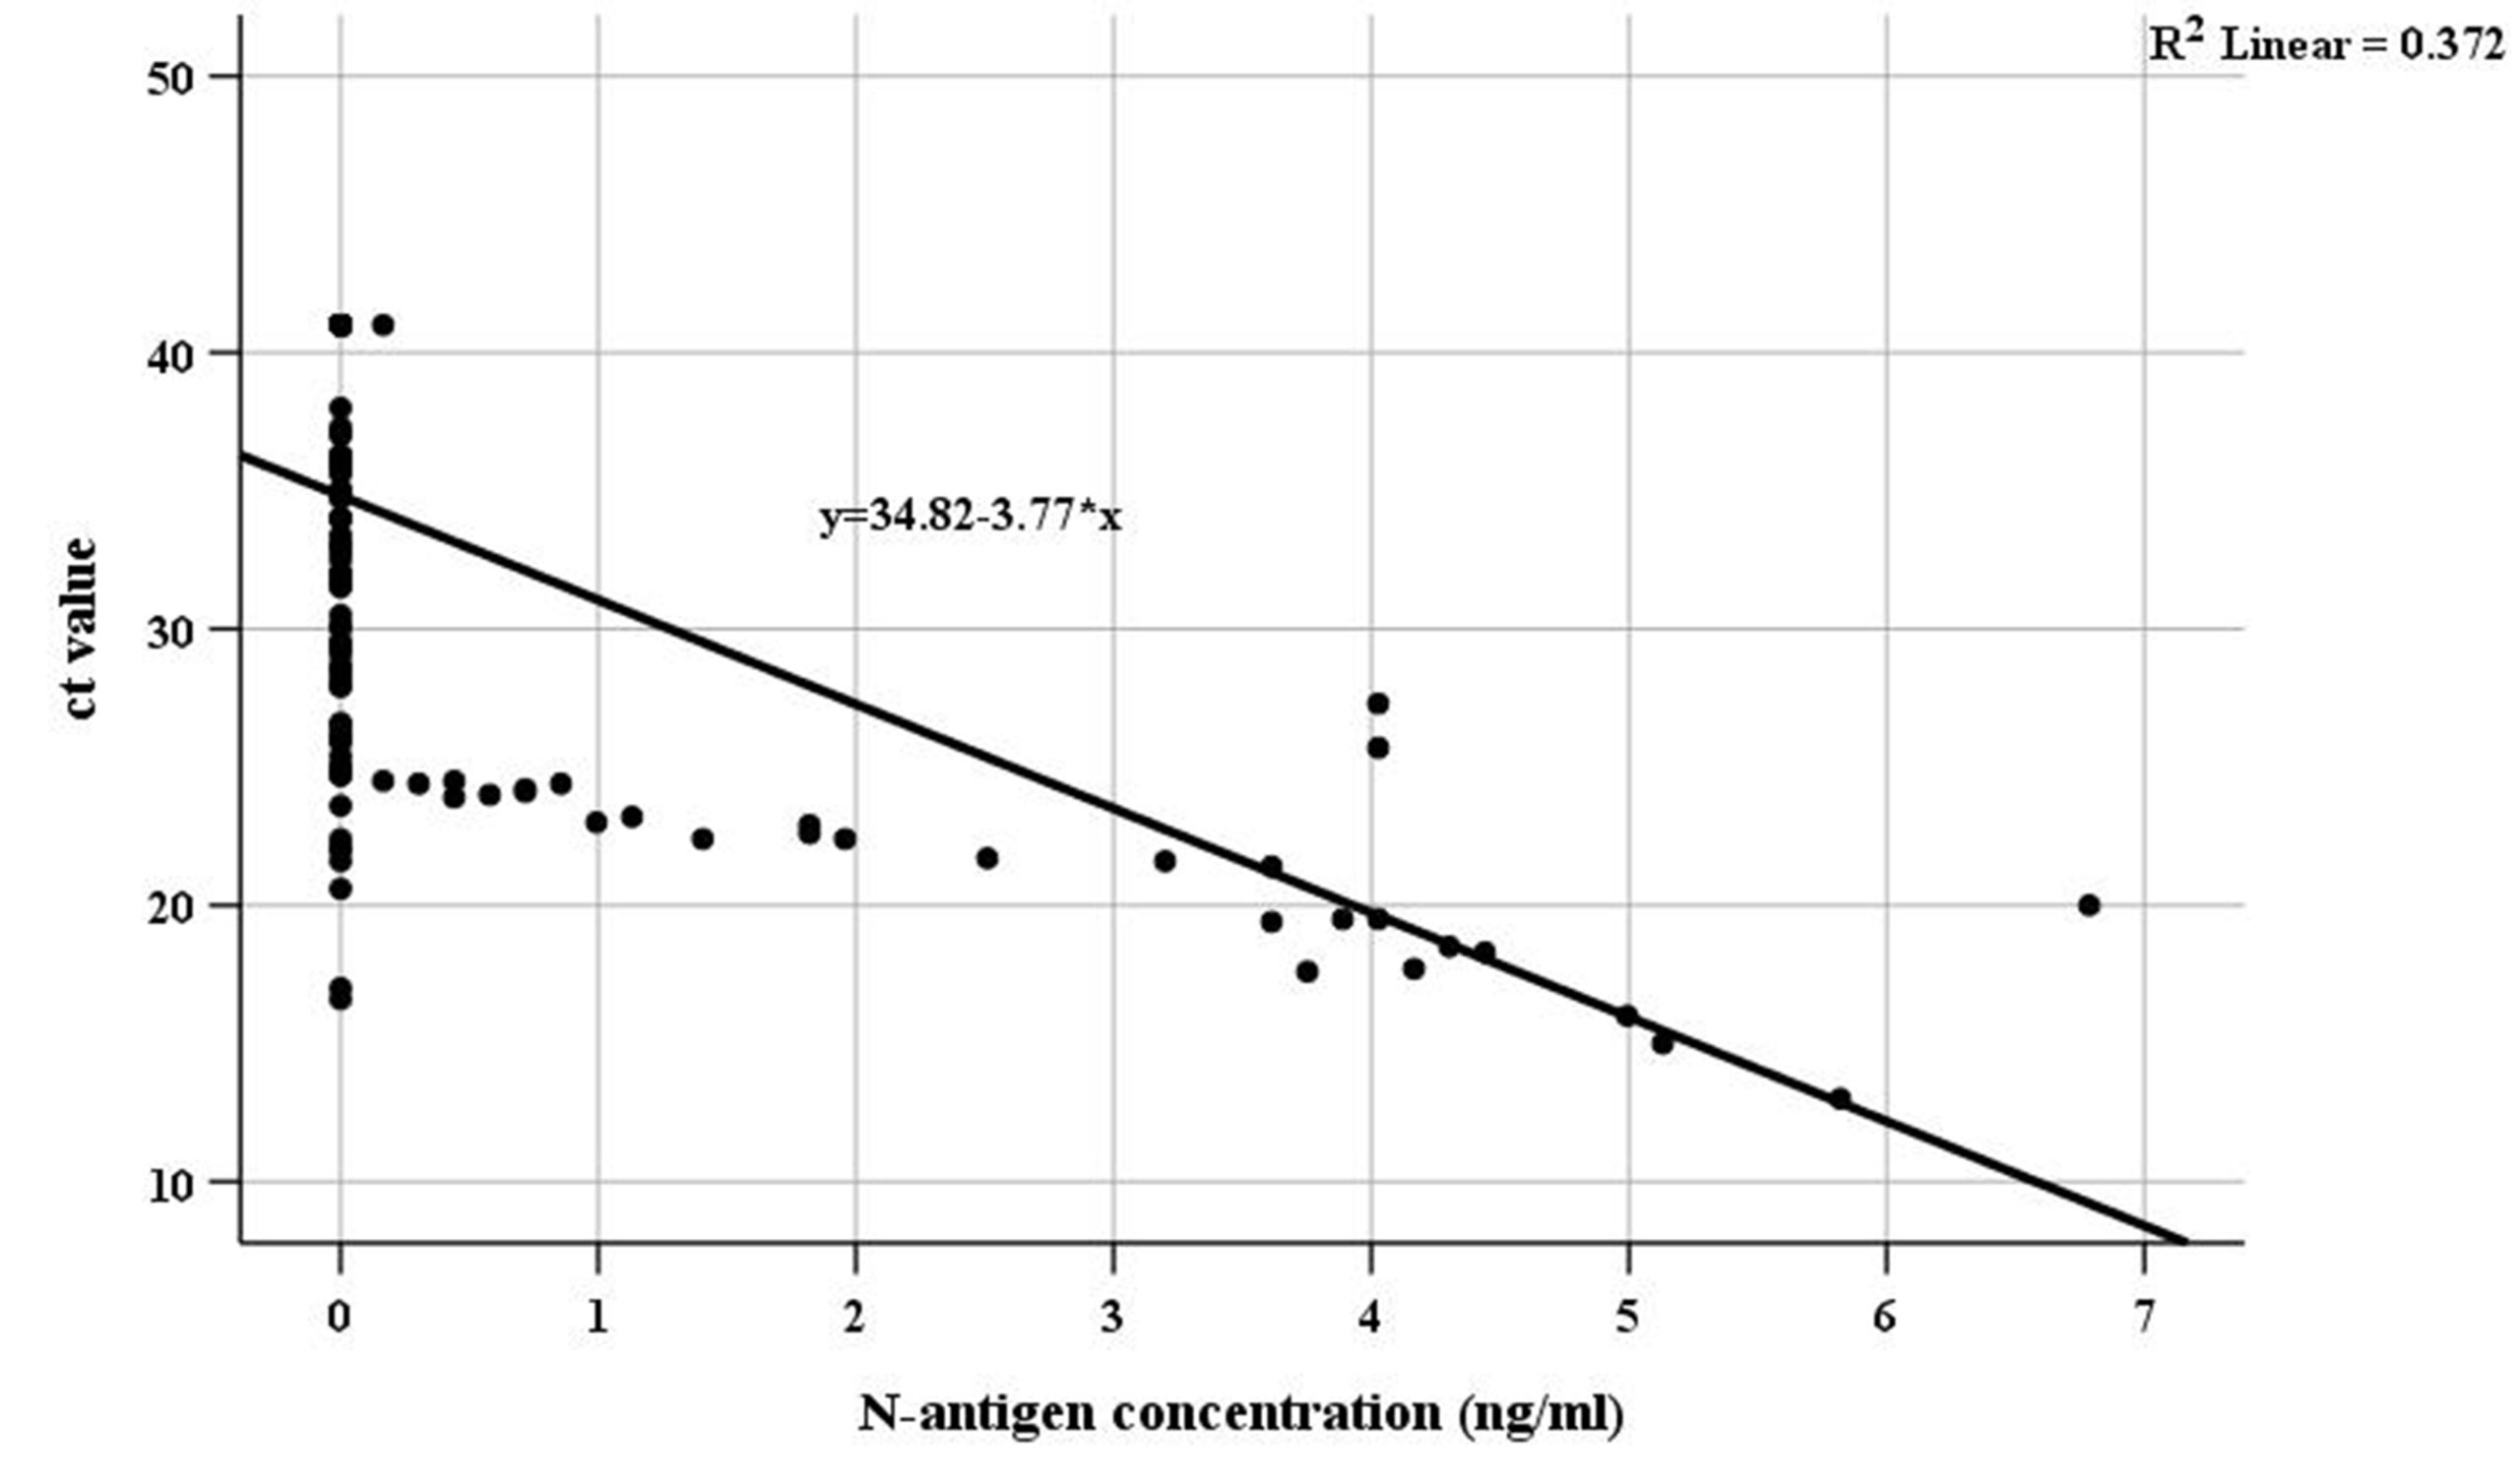
Figure 1. Scatter plot for correlation between Ct values of SARS-CoV-2 RT-PCR and N-antigen concentrations in the studied subjects
Table (1):
Relationship between SARS-CoV-2 N-antigen results and various clinical and laboratory findings
| Clinical presentations | SARS-CoV-2 N-antigen results | p-value | |||
|---|---|---|---|---|---|
| Negative (n = 133) | Positive (n = 31) | ||||
| Hospitalization | N | % | N | % | |
| non-hospitalized (n = 108) | 94 | 70.7 | 14 | 45.2 | p = 0.007* X2 = 7.279 |
| hospitalized (n = 56) | 39 | 29.3 | 17 | 54.8 | |
| Fever | N | % | N | % | |
| No (n = 84) | 74 | 55.6 | 10 | 32.3 | p = 0.019* X2 = 5.501 |
| Yes (n = 80) | 59 | 44.4 | 21 | 67.7 | |
| Body aches | N | % | N | % | |
| No (n = 70) | 63 | 47.4 | 7 | 22.6 | p = 0.012* X2 = 6.314 |
| Yes (n = 94) | 70 | 52.6 | 24 | 77.4 | |
| Cough | N | % | N | % | |
| No (n = 100) | 87 | 65.4 | 13 | 41.9 | p = 0.016* X2 = 5.824 |
| Yes (n = 64) | 46 | 34.6 | 18 | 58.1 | |
| Pneumonia | N | % | N | % | |
| No (n = 108) | 94 | 70.7 | 14 | 45.2 | p = 0.007* X2 = 7.279 |
| Yes (n = 56) | 39 | 29.3 | 17 | 54.8 | |
| Lymphopenia | N | % | N | % | |
| No (n = 57) | 43 | 32.3 | 14 | 45.2 | p = 0.177 X2 = 1.825 |
| Yes (n = 107) | 90 | 67.7 | 17 | 54.8 | |
| Elevated CRP | N | % | N | % | |
| No (n = 26) | 25 | 18.8 | 1 | 3.2 | pFE = 0.031* X2 = 4.569 |
| Yes (n = 138) | 108 | 81.2 | 30 | 96.8 | |
p: p-value significant at level <0.05
*pFE: Fisher’s Exact significance
X2: Chi-square test
Table (2):
Relationship between SARS-CoV-2 N-antigen levels and various clinical and laboratory results
| SARS-CoV-2 N-antigen concen. (ng/ml) | Hospitalization | p-value | |
|---|---|---|---|
| Non-hospitalized (n = 108) | Hospitalized (n = 56) | ||
| Mean ± SD | 0.31897 ± 1.11 | 0.8457 ± 1.603 | p = 0.006* U = 3565.5 |
| Median (IQR) | 0.0 (0.0) | 0.0 (1.096) | |
| Min-Max | 0.0-5.82 | 0.0-6.786 | |
| Fever | |||
| No (n = 84) | Yes (n = 80) | ||
| Mean ± SD | 0.19699 ± 0.7238 | 0.81576 ± 1.686 | p= 0.011* U = 3885.5 |
| Median (IQR) | 0.0 (0.0) | 0.0 (0.268) | |
| Min-Max | 0.0-4.1655 | 0.0-6.786 | |
| Body aches | |||
| No (n = 70) | Yes (n = 94) | ||
| Mean ± SD | 0.21947 ± 0.78774 | 0.706867 ± 1.577 | p = 0.010* U = 3820.5 |
| Median (IQR) | 0.0 (0.0) | 0.0 (0.1995) | |
| Min-Max | 0.0-3.752 | 0.0-6.786 | |
| Cough | |||
| No (n = 100 ) | Yes (n = 64 ) | ||
| Mean ± SD | 0.3387 ± 1.0763 | 0.74903 ± 1.6061 | p = 0.016* U = 3689.0 |
| Median (IQR) | 0.0 (0.0) | 0.0 (0.648) | |
| Min-Max | 0.0-5.131 | 0.0-6.786 | |
| Pneumonia | |||
| No (n = 108 ) | Yes (n = 56) | ||
| Mean ± SD | 0.3509 ± 1.2089 | 0.78412 ± 1.4799 | p = 0.008* U = 3550.5 |
| Median (IQR) | 0.0 (0.0) | 0.0 (0.924) | |
| Min-Max | 0.0-6.786 | 0.0-5.131 | |
| Lymphopenia | |||
| No (n = 57) | Yes (n = 107) | ||
| Mean ± SD | 0.819737 ± 1.759 | 0.327 ± 0.9779 | p = 0.120* U = 2742.0 |
| Median (IQR) | 0.0 (0.0825) | 0.0 (0.0) | |
| Min-Max | 0.0-6.786 | 0.0-5.131 | |
| Elevated CRP | |||
| No (n = 26) | Yes (n =138) | ||
| Mean ± SD | 0.0063 ± 0.032 | 0.5916 ± 1.420 | p = 0.027* U = 2129.5 |
| Median (IQR) | 0.0 (0.0-0.0) | 0.0 (0.0-0.0) | |
| Min-Max | 0.0-0.1650 | 0.0-6.786 | |
p: p-value significant at level <0.05*
U: Mann-Whitney test; A non-parametric test employed to compare two groups’ quantitative variables.
Table (3):
Agreement between SARS-CoV-2 PCR and N-antigen tests
| SARS-CoV-2 N-antigen Results | SARS-CoV-2 PCR | ||||
|---|---|---|---|---|---|
| Negative | Positive | Total | |||
| N | % | N | % | ||
| Negative | 65 | 98.5% | 68 | 69.4% | 133 |
| Positive | 1 | 1.5% | 30 | 30.6% | 31 |
| Total | 66 | 100% | 98 | 100% | 164 |
| Kappa | 0.250 | P-value | 0.047* | ||
| Sensitivity | 30.6% | Specificity | 98.5% | ||
| PPV | 96.8% | NPV | 48.9% | ||
Kappa: Measure of agreement (ranges from 0-1)
PPV: positive predictive value
p*: p-value is significant at level <0.05*; NPV: negative predictive value
Table (4):
Distribution of the studied subjects according to Ct values of SARS-CoV-2 RT-PCR and N-antigen results
| Ct value | SARS-CoV-2 N-antigen results | p–value | |||
|---|---|---|---|---|---|
| N-antigen negative (n = 133) | N-antigen positive (n = 31) | ||||
| N | % | N | % | ||
| less than 25 | 10 | 26.3% | 28 | 73.7% | X2 = 97.596 p < 0.001* |
| from 25 to less than 30 | 21 | 91.3% | 2 | 8.7% | |
| from 30 to less than 40 | 37 | 100.0% | 0 | 0.0% | |
| equal or more than 40 | 65 | 98.5% | 1 | 1.5% | |
p*: p-value is significant at level <0.05*; X2: chi-square test
The N-antigen test showed high specificity (98.5%) but low sensitivity (30.6%), with a positive predictive value of 96.8% and negative predictive value of 48.9%. ROC analysis identified a cutoff of >0.165 ng/mL, yielding an AUC of 0.648 and confirming the test’s high specificity but limited sensitivity for detecting SARS-CoV-2 infection (Figure 2).
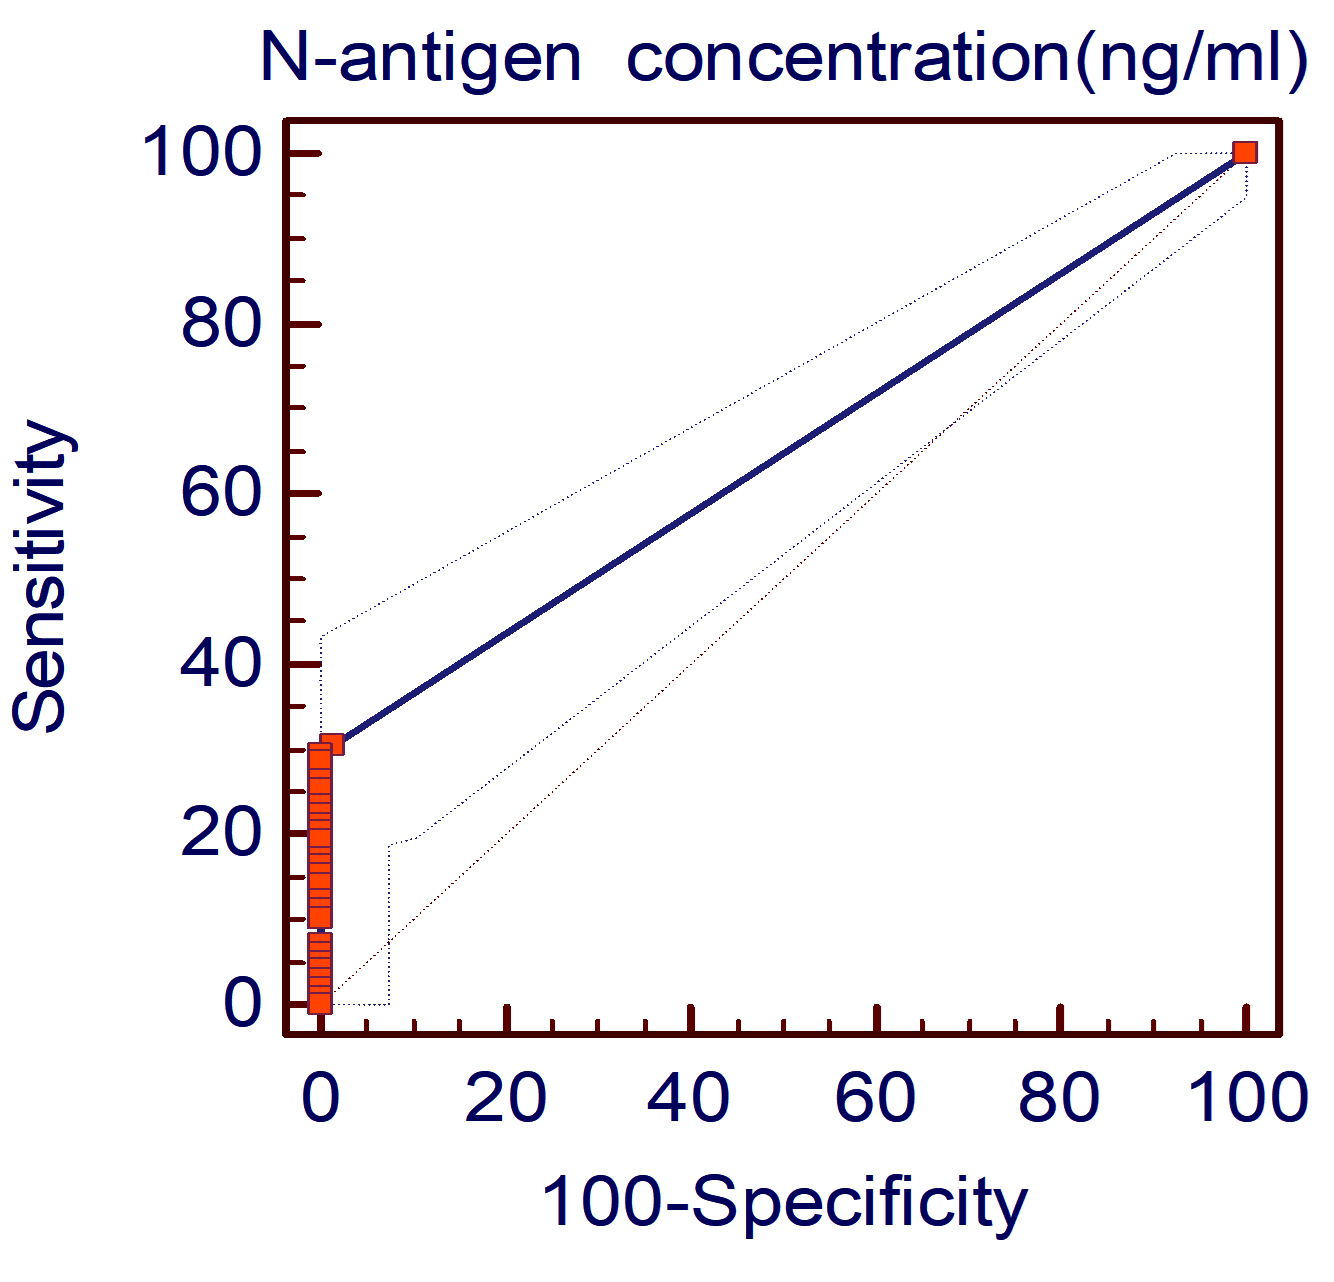
Figure 2. ROC curve of N-antigen concentration as a predictor of COVID-19 diagnosis
N-Antigen Levels and Disease Severity
In this investigation, hospitalized patients had significantly higher mean N-antigen concentrations than non-hospitalized individuals (0.8457 vs. 0.3190 ng/ml, p = 0.006). Prior studies have shown that elevated N-antigen levels are associated with increased severity, ICU admission, and longer hospital stays. Perna et al.9 demonstrated that chemiluminescence enzyme immunoassay (CLIA)-measured N-antigen levels reflected disease progression in hospitalized patients. Ogata et al.10 found a similar association using Single Molecule Array (SIMOA), while Veyrenche et al.11 reported significantly higher urine N-antigen levels in ICU patients (p = 0.0077).
Likewise, patients with pneumonia in our study showed significantly greater N-antigen levels compared to non-pneumonia cases (0.7841 vs. 0.3509 ng/ml, p = 0.008), consistent with Lebedin et al.,12 who found that serum N-antigen levels decreased to undetectable levels upon discharge. A statistically significant positive correlation between CRP and N-antigen levels (rs = 0.207, p = 0.012) was also observed, supporting a relationship between viral burden and inflammatory response.11,13,14
The diagnostic sensitivity observed in this study may have been influenced by several methodological limitations. First, the timing of sample collection was not standardized in relation to the onset of symptoms, which may have led to testing during phases of low antigenemia. Second, the use of serum as the specimen type, while practical, may offer lower sensitivity compared to respiratory tract specimens such as nasopharyngeal swabs, which typically contain higher viral loads in early infection.
Diagnostic performance vs. RT-PCR
Of the 98 RT-PCR–positive individuals, only 30 (30.6%) tested positive for N-antigen, resulting in fair agreement (kappa = 0.250), high specificity (98.5%), and low sensitivity (30.6%). This is lower than other studies, such as those by Mandal et al.15 (63.5%) and Mayanskiy et al.16 (90.1%).
ELISA-based antigen assays
Mayanskiy et al.16 using quantitative ELISA reported 90.1% N-antigen positivity in PCR-confirmed cases. Barlev-Gross et al.17 showed 63.4% sensitivity and 87.0% specificity. In contrast, Ahava et al.18 found no significant correlation between N-antigen levels using ELISA and Ct values.
CLIA assays
CLIA-based assays showed better diagnostic accuracy. Perna et al.9 and Iqbal et al.19 reported sensitivities of 62%-72% and specificities of 95-100%. Gili et al.20 found 100% sensitivity, 94.8% specificity, and 95.1% agreement in nasopharyngeal swabs. Thudium et al.21 reported AUC = 0.986, with sensitivity >90% when serum/plasma samples were collected within 2 weeks.
SIMOA and ultrasensitive assays
Olsen et al.22 achieved 95% sensitivity and 100% specificity using SIMOA at 0.01 pg/ml. Sigal et al.23 reported 89% sensitivity and 95%-97% specificity using an ultrasensitive immunoassay. These platforms consistently outperformed conventional assays in detecting low antigen levels.
Rapid antigen test (RAT) and Immunofluorescence assay (IFA) performance
RAT sensitivity varied widely. Mandal et al.15 found 63.5% positivity, while Saveriampillai et al.24 observed fair agreement (kappa = 0.242). Caruana et al.25 tested four RATs, reporting specificities >99% but sensitivities of 41%-48%. Agard et al.26 found weak agreement with IFA tests (sensitivity 31%-39%, specificity 100%).
Ct Value and antigen correlation
A significant inverse correlation was found between Ct values and N-antigen concentration (rs = -0.623, p < 0.001), consistent with results from Favresse et al.,27 Olsen et al.,22 and Lefever et al.28 Other reports noted similar relationships (e.g., r = -0.61 to -0.77) across SIMOA and CLIA platforms.21,27,29
However, in this study, N-antigen test sensitivity did not vary significantly across Ct strata. This contrasts with findings by Salvagno et al.,30 who showed RAT sensitivity dropped from >90% at Ct <25 to <20% at Ct >30. Lefever et al.28 reported CLIA sensitivity of 100% at Ct <20 and 71.3% at Ct <35.
ROC analysis
ROC analysis yielded an AUC = 0.648 and optimal cutoff >0.165 ng/ml with high specificity (98%) but low sensitivity (29.6%). By comparison, Deng et al.31 using CLIA found AUCs >0.91 with 76.3% sensitivity in week 1. Li et al.32 reported an AUC = 0.9756 (sensitivity = 92%, specificity = 96.8%) using quantitative ELISA.
Thudium et al.21 and Verkerke et al.33 reported AUCs >0.97 for plasma/serum samples with >85% sensitivity and >98% specificity. Gili et al.20 showed 100% sensitivity and 94.8% specificity at a cutoff of 1.645 pg/ml.
Despite the high specificity (98.5%) of the SARS-CoV-2 N-antigen ELISA assay evaluated in this study, its diagnostic utility is significantly limited by its low sensitivity (30.6%). The assay’s poor sensitivity undermines its standalone diagnostic value, especially when compared to RT-PCR. However, the significant association of higher N-antigen levels with clinical severity indicators such as hospitalization, fever, pneumonia, and elevated CRP suggests potential utility in identifying patients with higher viral loads.
ACKNOWLEDGMENTS
The authors would like to thank the Microbiology Department of High Institute of Public Health, Alexandria, Egypt, for providing ELISA reader and washer.
CONFLICT OF INTEREST
The authors declare that there is no conflict of interest.
AUTHORS’ CONTRIBUTION
MHH conceptualized the study. AAE performed the recruitment of study participants.
AKM and MMF performed laboratory work. MMF performed data analysis. AKM, MHH and MMF performed data interpretation. MHH, MMF and AAE supervised the study. MMF and AKM wrote the manuscript. All authors read and approved the final manuscript for publication.
FUNDING
None.
DATA AVAILABILITY
The datasets generated and/or analysed during the current study are available from the corresponding author on reasonable request.
ETHICS STATEMENT
This study was approved by the Ethics Committee of the High Institute of Public Health, Alexandria University, Egypt, vide reference number 00013692.
INFORMED CONSENT
Written informed consent was obtained from the participants before enrolling in the study.
- Chan JF-W, Yuan S, Kok K-H, et al. A familial cluster of pneumonia associated with the 2019 novel coronavirus indicating person-to-person transmission: a study of a family cluster. Lancet. 2020;395(10223):514-23.
Crossref - Yao H, Song Y, Chen Y, et al. Molecular architecture of the SARS-CoV-2 virus. Cell. 2020;183(3):730-738.e13.
Crossref - Byrnes SA, Gallagher R, Steadman A, et al. Multiplexed and extraction-free amplification for simplified SARS-CoV-2 RT-PCR tests. Anal Chem. 2021;93(9):4160-4165.
Crossref - Deeks JJ, Dinnes J, Takwoingi Y, et al. Antibody tests for identification of current and past infection with SARS CoV 2. Cochrane Database Syst Rev. 2020(6):CD013652.
Crossref - Gallardo-Alfaro L, Lorente-Montalvo P, Canellas M, et al. Diagnostic accuracy of Panbio™ rapid antigen test for SARS-CoV-2 in paediatric population. BMC Pediatr. 2023;23(1):433.
Crossref - Chen C-C, Lee M-H, Chen S-Y, et al. Assessment of the detection accuracy of SARS-CoV-2 rapid antigen test in children and adolescents: an updated meta-analysis. J Chin Med Assoc. 2023;86(11):966-974.
Crossref - Le Hingrat Q, Visseaux B, Laouenan C, et al. Detection of SARS-CoV-2 N-antigen in blood during acute COVID-19 provides a sensitive new marker and new testing alternatives. Clin Microbiol Infect. 2021;27(5):789. e1-e5.
Crossref - Negida A, Fahim NK, Negida Y. Sample size calculation guide-part 4: how to calculate the sample size for a diagnostic test accuracy study based on sensitivity, specificity, and the area under the roc curve. Frontiers in Emergency Medicine. 2019;3(3):e33.
Crossref - Perna F, Bruzzaniti S, Piemonte E, et al. Serum levels of SARS-CoV-2 nucleocapsid antigen associate with inflammatory status and disease severity in COVID-19 patients. Clin Immunol (Orlando, Fla). 2021;226:108720.
Crossref - Ogata AF, Maley AM, Wu C, et al. Ultra-sensitive Serial Profiling of SARS-CoV-2 Antigens and Antibodies in Plasma to Understand Disease Progression in COVID-19 Patients with Severe Disease. Clin Chem. 2020;66(12):1562-1572.
Crossref - Veyrenche N, Pisoni A, Debiesse S, et al. SARS-CoV-2 nucleocapsid antigen in urine of hospitalized patients with Covid-19. medRxiv. 2021.
Crossref - Lebedin YS, Lyang OV, Galstyan AG, Panteleeva AV, Belousov VV, Rebrikov DV. Serum SARS-CoV-2 nucleocapsid antigen detection is essential for primary diagnostics of SARS-CoV-2-associated pneumonia. medRxiv. 2020.
Crossref - Favresse J, Bayart J-L, David C, Dogne J-M, Douxfils J. Nucleocapsid serum antigen determination in SARS-CoV-2 infected patients using the single molecule array technology and prediction of disease severity. J Infect. 2022;84(4):e4.
Crossref - Oueslati S, Manai Bouokazi M, Ramdhani I, et al. Clinical added value of SARS-CoV-2 antigen detection in blood samples. Diagnostics. 2022;12(10):2427.
Crossref - Mandal DK, Bhattarai BR, Pokhrel S, et al. Diagnostic Performance of SARS-CoV-2 Rapid Antigen Test in relation to RT-PCR Cq Value. Adv Virol. 2022;2022(1):9245248.
Crossref - Mayanskiy N, Brzhozovskaya E, Fedorova N, Lebedin Y. Parallel detection of SARS-CoV-2 RNA and nucleocapsid antigen in nasopharyngeal specimens from a COVID-19 patient screening cohort. Int J Infect Dis. 2021;108:330-332.
Crossref - Barlev-Gross M, Weiss S, Ben-Shmuel A, et al. Spike vs nucleocapsid SARS-CoV-2 antigen detection: application in nasopharyngeal swab specimens. Anal Bioanal Chem. 2021;413(13):3501-10.
Crossref - Ahava MJ, Kurkela S, Kuivanen S, Lappalainen M, Jarva H, Jaaskelainen AJ. Detection of SARS-CoV-2 nucleocapsid antigen from serum can aid in timing of COVID-19 infection. J Virol Methods. 2022;302:114469.
Crossref - Iqbal B, Khan M, Shah N, Dawood MM, Jehanzeb V, Shafi M. Comparison of SARS-CoV-2 antigen electrochemiluminescence immunoassay to RT-PCR assay for laboratory diagnosis of COVID-19 in Peshawar. Diagnosis. 2021;9(3):364-368.
Crossref - Gili A, Paggi R, Russo C, et al. Evaluation of Lumipulse® G SARS-CoV-2 antigen assay automated test for detecting SARS-CoV-2 nucleocapsid protein (NP) in nasopharyngeal swabs for community and population screening. Int J Infect Dis. 2021;105:391-396.
Crossref - Rebekka RF, Stoico MP, Hogdall E, et al. Early Laboratory Diagnosis of COVID-19 by Antigen Detection in Blood Samples of the SARS-CoV-2 Nucleocapsid Protein. J Clin Microbiol. 59(10):e01001-21.
Crossref - Olsen DA, Brasen CL, Kahns S, et al. Quantifying SARS-CoV-2 nucleocapsid antigen in oropharyngeal swabs using single molecule array technology. Sci Rep. 2021;11(1):20323.
Crossref - Sigal GB, Novak T, Mathew A, et al. Measurement of SARS-CoV-2 antigens in plasma of pediatric patients with acute COVID-19 or MIS-C using an ultrasensitive and quantitative immunoassay. medRxiv. 2021.
Crossref - Saveriampillai G, Bettinardi A, Bontempi S, et al. Evaluation of vivadiag™ SARS-CoV2 antigen rapid test. Biochimica Clinica. 2022:S107.
- Caruana G, Croxatto A, Kampouri E, et al. Implementing SARS-CoV-2 Rapid antigen testing in the Emergency ward of a Swiss university hospital: the increase study. Microorganisms. 2021;9(4):798.
Crossref - Agard A, Elsheikh O, Bell D, et al. Clinical comparison and agreement of PCR, antigen, and viral culture for the diagnosis of COVID-19: Clinical Agreement Between Diagnostics for COVID19. J Clin Virol Plus. 2022;2(3):100099.
Crossref - Favresse J, Bayart J-L, David C, et al. Spike vs. nucleocapsid serum antigens for COVID-19 diagnosis and severity assessment. Clin Chem Lab Med. 2022;60(5):e97-e100.
Crossref - Lefever S, Indevuyst C, Cuypers L, et al. Comparison of the Quantitative DiaSorin Liaison Antigen Test to Reverse Transcription-PCR for the Diagnosis of COVID-19 in Symptomatic and Asymptomatic Outpatients. J Clin Microbiol. 2021;59(7):e00374-21.
Crossref - Favresse J, Bayart J-L, David C, et al. Serum SARS-CoV-2 Antigens for the Determination of COVID-19 Severity. Viruses. 2022;14(8):1653.
Crossref - Salvagno GL, Gianfilippi G, Bragantini D, Henry BM, Lippi G. Clinical assessment of the Roche SARS-CoV-2 rapid antigen test. Diagnosis. 2021;8(3):322-326.
Crossref - Deng Q, Ye G, Pan Y, et al. High Performance of SARS-Cov-2N Protein Antigen Chemiluminescence Immunoassay as Frontline Testing for Acute Phase COVID-19 Diagnosis: A Retrospective Cohort Study. Frontiers in Medicine. 2021;8.
- Li T, Wang L, Wang H, et al. Serum SARS-COV-2 Nucleocapsid Protein: A Sensitivity and Specificity Early Diagnostic Marker for SARS-COV-2 Infection. Frontiers in Cellular and Infection Microbiology. 2020;10.
- Verkerke HP, Damhorst GL, Graciaa DS, et al. Nucleocapsid antigenemia is a marker of acute SARS-CoV-2 infection. The Journal of Infectious Diseases. 2022;226(9):1577-87.
© The Author(s) 2025. Open Access. This article is distributed under the terms of the Creative Commons Attribution 4.0 International License which permits unrestricted use, sharing, distribution, and reproduction in any medium, provided you give appropriate credit to the original author(s) and the source, provide a link to the Creative Commons license, and indicate if changes were made.