


ISSN: 0973-7510
E-ISSN: 2581-690X
To accelerate the monitoring and counting of biodiversity of various species, there is a need for automating the process of computing biodiversity. The calculations of the alpha and beta biodiversity indexes are fundamental for the analysis of ecological and biodiversity studies. Sukhna and Dhanas lakes, India are critical for the maintenance of the health of the residents and aquatic life thriving in them. Both lakes are prone to pollution. Due to these factors, there is a need for building digitized infrastructure for monitoring the health of these lakes. Hence in this research work, an automated algorithm has been devised for the computation of biodiversity of microorganisms. The work focuses on the surface water of both these lakes. The automation of biodiversity computation is done with image processing algorithms and is applied to the primary data collected. From this study, it is apparent that the counting of microorganisms using image processing algorithms is an easier and efficient way for biodiversity studies as compared to the manual process of estimating the population of microbes. The results show that the species richness of Dhanas Lake is more as compared to Sukhna Lake. The dissimilarity between the two lakes is five species as per the primary data collected. This shows that the biodiversity of Dhanas Lake is better than the Sukhna Lake but it is prone to harmful algal blooms. This may be attributed to the fact that Dhanas Lake may have multiple sources of pollution that need to be identified.
Biodiversity Index, Biodiversity Monitoring, Image Processing, Computational Environment Sciences, Algae, Fungi
For biodiversity, the present forecast seems bleak. In a recent United Nations study, an international alliance of scientists claimed that we are on track to lose over one million identified organisms in the next eight decades, i.e. one species out of eight. Meanwhile, the number of individual organisms have plummeted. Migratory birds are estimated to have lost about 70 percent of their population, and tigers have lost 97 percent of their population. The combined biomass of humans and domestic animals has reached 24 times that of all other wild mammals, over the course of only a few decades. Almost all organisms including birds and animals depend on the biodiversity of microbes. Microbes that are not visible to the naked eye, actively play an important role in maintaining and conserving life on this planet. Most importantly, many organisms are part of our medical1 and healing system. Due to this reason, the motivation of contemporary researchers working in this context is to2 develop modules, procedures, and methods that assist in gathering environmental data3, used for enhanced understanding and analysis. Tasks such as mapping of major and minor species of an area, error checking of archives, and monitoring biodiversity changes are already in the process of automation4. The information on the existence of species is derived with the help of two methods. The first method is collection and analysis of the primary data and the second method is studying the archives of repositories. With time, the repositories are being digitalized and there are multiple formats to hold information on the species data. Global Biodiversity Information Facility (GBIF) is an organization that provides access to biodiversity data using Internet-based interfaces5. GBIF also helps people to become citizen scientists and conservationists. Besides, there are many other organizations such as Greenpeace, Tropicos, Birdlife international, worldwide fund for Nature (WWF), Global environment facility, and United Nations Environment that are collecting ecological and biodiversity data6,7.
In this domain, limited research work in regards to the calculation of biodiversity indexes of microbes found in Sukhna and Dhanas lakes is reported. Work related to the quality of water8,9, catchment characteristics10,11, consequences of climatic changes12 of these water bodies have few citations in contemporary literature.
This may be attributed to the fact that the collection of biodiversity data is a challenging task wherein each type of species/taxa requires a different sampling process and counting protocol. Due to this fact, standard steps are followed for the collection of different sample species. For example, the collection of samples of mosses and lichens requires microscopes and the area under observation has to be divided into grids so that the diversity can be computed at the fine-grain level. On the other hand, ferns are sampled using transects that are parallel in nature, since it is easy for the sampler to count in such a manner. Likewise, macro-fungi are counted using transects/ paths that have quadrant shapes. This requires instruments such as magnifying glasses and microscopes. Arthropods are sampled using light, pitfall13, entomological umbrella14, mesh, etc. For identification and counting of arthropods, microscopes and magnification equipment are used. The biodiversity studies of the mammals and birds are done using photo trapping15, night vision videography 16, and other indirect methods such as droppings counting17, footprints etc. In the case of fish and water-borne microorganisms (micro-fungi, algae, bacteria, etc.), the use of mesh, nets, and microscopes are required. Many researchers have built toolkits and manuals that help people interested in recording and maintaining the count of all kind of species. But most of these toolkits and plans are restricted to either manual recording or tools such as Microsoft Excel. In recent years, computer assisted photo-identifier applications are increasingly being used. But hardly any of these have features to count biodiversity indexes automatically for a particular region. Few programming (python and java) libraries are however available for computing biodiversity indexes. Using such libraries, automated tools can be constructed. All these developments can help in building local biodiversity strategy and action plans (LBSAP). In India, it is the mandate of Section 41 of Biological Diversity Act 2002 for all the local bodies and agencies to implement appropriate steps to maintain a healthy level of biodiversity along with checking of pollution sources. Hence, building automated algorithms for computing biodiversity is important.
Studies related to the water bodies and other objects associated with natural habitats give classification and taxonomy of various regions of the water bodies18. Water bodies (brooks, streams, creeks, gulf, river, lake, pond, sea, and ocean) are typically classified based on the use of water and other resources that can be obtained from the water body. It is the responsibility of the local governments and national agencies to monitor and maintain the quality of the various water bodies as per their respective category. For monitoring, many observatories and sampling stations have been made and a wide spectrum of technologies are used to maintain the record and conduct an analysis of the data collected19. The current ecological studies show extensive literature on the use of cameras, cloud, satellite imagery, drones and deep penetration probes for data collection related to ecological indicators. The objective of these advancements is to contribute to the field of computational biodiversity, which is statistically correlated with the health of humankind.
Researchers, biologists and environ-mentalists have developed many computational methods for understanding the impact of ecological/biodiversity changes on earth as a habitat20. The computation methods begin with calculations of the number of species (richness) in a particular region and offer different ways and methods to understand the status of biodiversity spots.
Diversity calculations are done using different kinds of metrics21,22. The most prominent indexes currently used by researchers are discussed here. Shannon-diversity index is commonly used for computing species diversity in terms of rarity and commonness of the species23. Mathematically, it requires three variables: the total number of species in the community (richness), the proportion of species and equability (evenness). This index is similar to the Simpson index24, which also considers abundance and evenness as a parameter for computing the diversity index. The values of the diversity are computed on a scale of zero and one. The value zero signifies very high diversity and one signifies no diversity. Dominance Index25 is a metric that gives us the measure of diversity that attempts to find information on the species that are conspicuous in nature at a particular site. Due to differential in the ratio of predators, nutrition, pollutants, and light conditions at different levels of the habitat, some species may dominate at a particular region. Dominance Index computation helps to get information on this aspect. Berger-Parker index26 is another way to identify the dominant species of an area. The reciprocal of the value of this index can be inferred as a reduced level of dominance. Equability Index computes the evenness ratio of the species. An index by the name Hill Number27 is typically used for diversity characterization of the taxonomic survey data and phylogenetic records. This metric also considers the sampling ratio used in the computations. A higher number of samples lead to a higher degree of diversity discovery. Renyi Index28 is also used in computing the diversity of evolutionary data that details the relationship between the species. Margalef Richness Index29 is computed using (S-1) ln (n) formula, where S is the number of taxa, and ‘n’ is the number of individuals found in the site under observation. When the ratio of the square root of a sample with the number of taxa is considered, the index is called the Menhinick Index. Gini Diversity Index helps us to get deeper insights into the characterization of the species, for e.g. finding areas that have fish having a similar length. The Whittaker Index30 uses gamma diversity index in its computation for the characterization of the species. It is computed as the ratio of the gamma index and average sample diversity. Here, each sample size has to be standardized and diversity is measured as species richness. The mathematics of this index gives values from 0 to 2. Here, zero means minimum beta diversity, 1 means completely similar species are there and the value of 2 means that there is no overlap. Many indexes compute the similarity and complementarity of a site from which the data has been computed. Such indexes describe the characteristics of different sites and are comparative. Marczewski Steinhaus dissimilarity index31 is a complement of the Jaccard similarity index32. Preston Diagrams are graphical presentation tools (a Kind of bar Graph) that helps to find species abundance distribution (SAD). Rarefaction and Lorenz are other types of graphical representations from which interpretation of the biodiversity of an area can be done.
This literature survey gives copious evidence to support the fact that there are multiple ways in which the indexes are computed. Depending on the scope of the study, a particular index may be chosen. However, the current literature shows that the most commonly used index is the Shannon index. Automated microscopy image processing33 is the latest technique by which faster computations of the diversity indexes can be computed. Image processing has many advantages, especially when it comes to isolating microbes from images and counting microorganisms’ species richness. After collection of the primary data (water samples), the microscopic images or slides are made and automatic, counting algorithms are applied to obtain the results. Current research focuses on counting different kinds of algae and even micro-fungal colonies. In this context, the contemporary laboratory manuals show that there are primarily two ways by which the counting is done viz., direct and indirect methods. In indirect methods, counting is done with the help of electronic microscope based images/slides, electronic counter, and membrane filter, etc. Direct methods include the use of optical density properties of the solution containing microorganisms, weight of the culture, and by observing chemical/metabolic activity that changes due to factors such as light for example34. In both methods, dye/strainers are extensively used so that the boundaries of the microorganisms become more readable. In the context of our research work, we are using indirect methods for counting microbes.
This section gives comprehensive information on all the steps taken to achieve the previously mentioned purpose of the study, i.e. the automating the biodiversity counting tasks. This section covers the design of the methods that help to compute and validate the process of computing biodiversity automatically. Fig. 1 gives the functional flow of the proposed work.
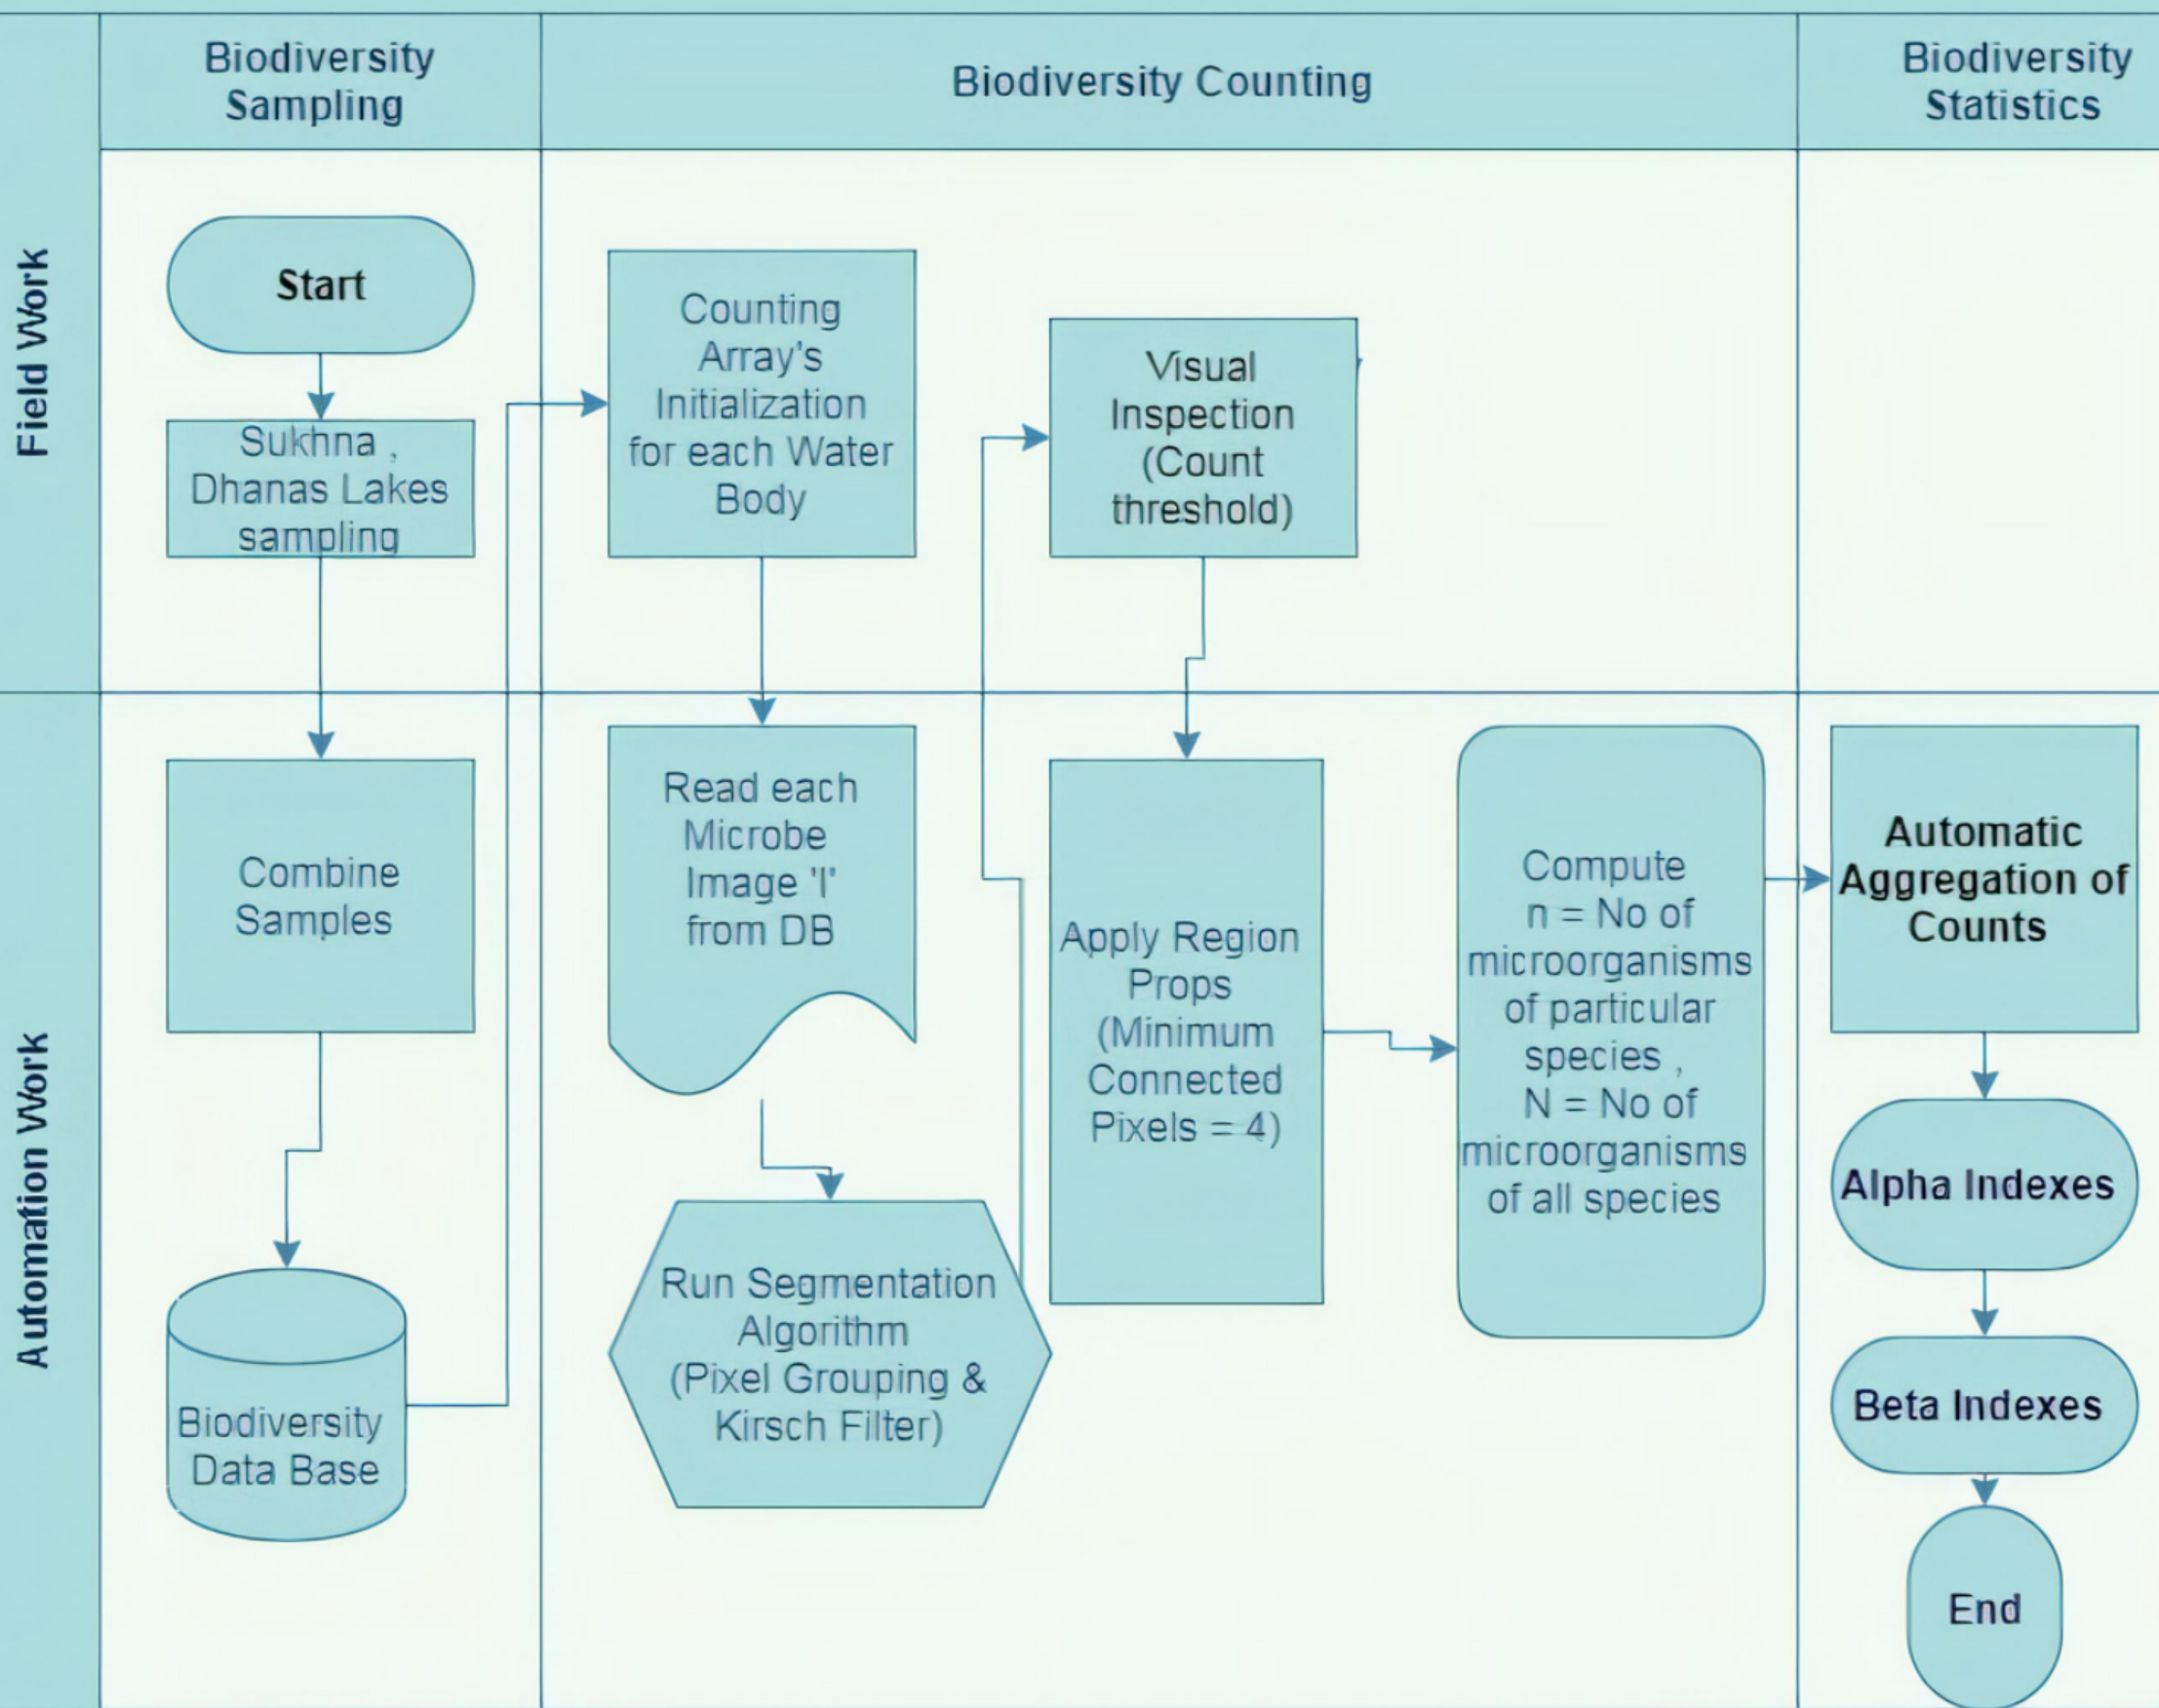
Fig. 1. Flow of proposed work
Collection of Primary Data
Since there was no publicly available data/benchmark record on Sukhna and Dhanas lakes, therefore one of the major objectives of this research work was to collect primary data. The sample collection was done from the surface zone (littoral). On visual inspection, it was observed that Sukhna Lake has a very large catchment area (25 square kilometers) and it has lower levels of nutrition/pollutants as compared to Dhanas Lake. Dhanas lake is a second artificial man made water body in Chandigarh, built to catch adjacent rainwater. Both the lakes are important water bodies for the city dwellers and scientific community. The communities want to maintain the good health of these lakes and preserve aquatic life. This is important as the lakes are prone to the growth of weed and algal blooms, and are also surrounded by human activities. For our study, around ten random [Fig. 2] sample collection points were selected for both the lakes. Each sample station was assigned a unique identifier number.
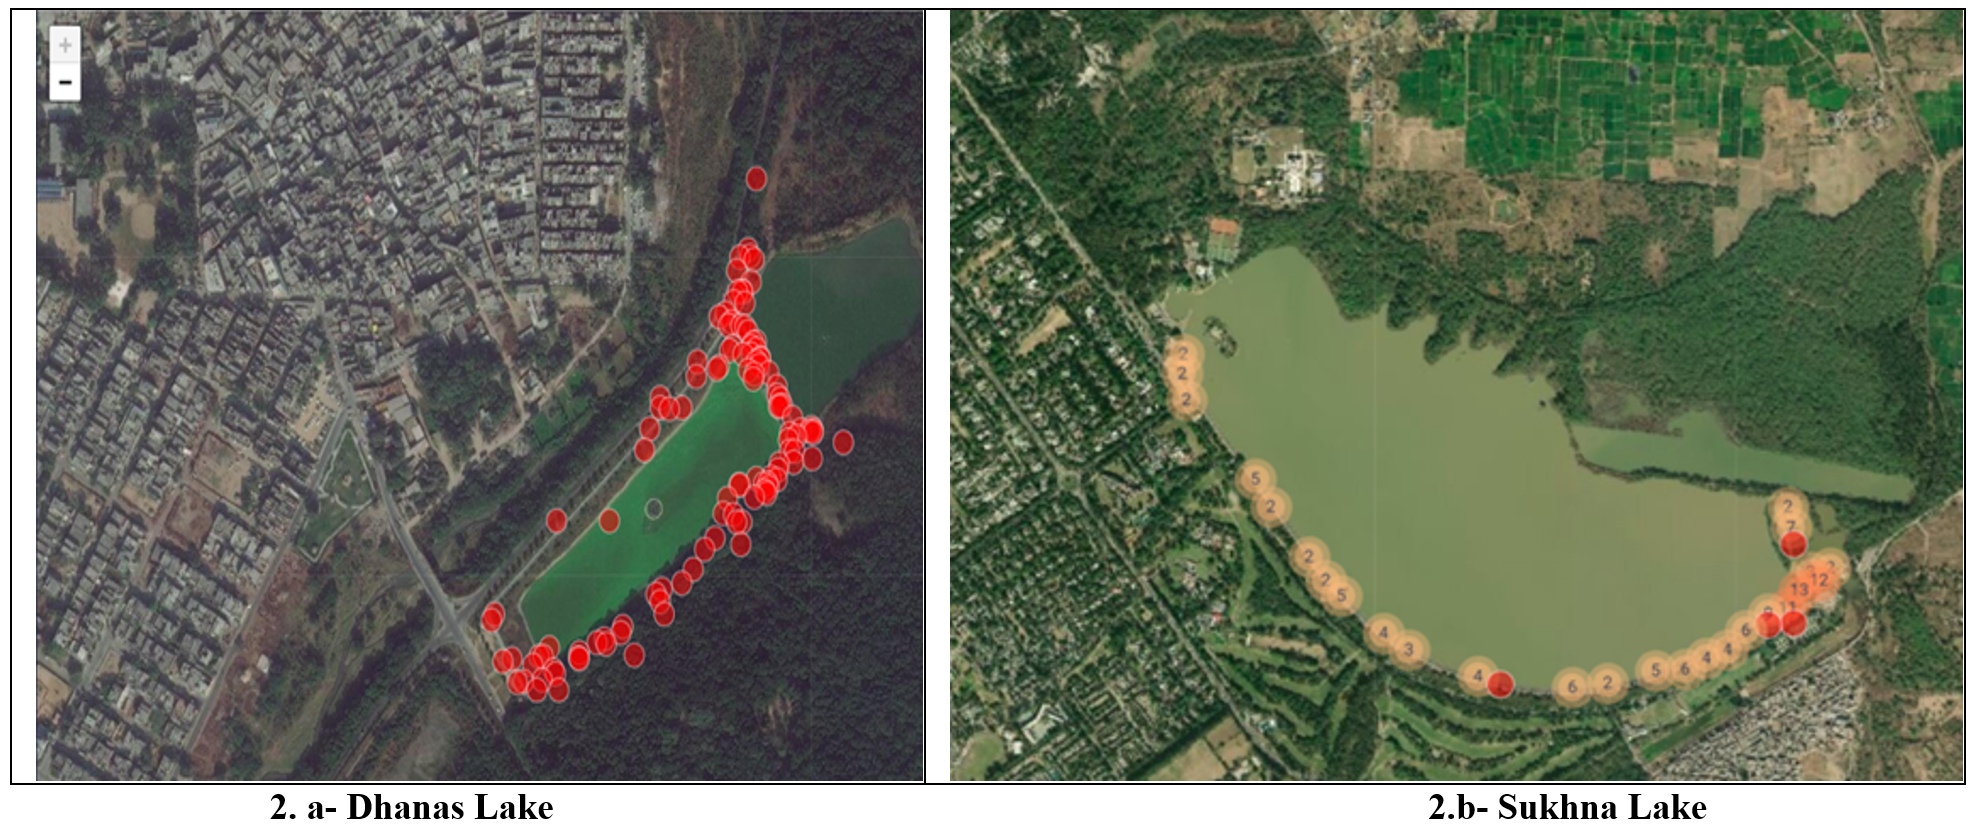
Fig. 2. Sample Collection Points
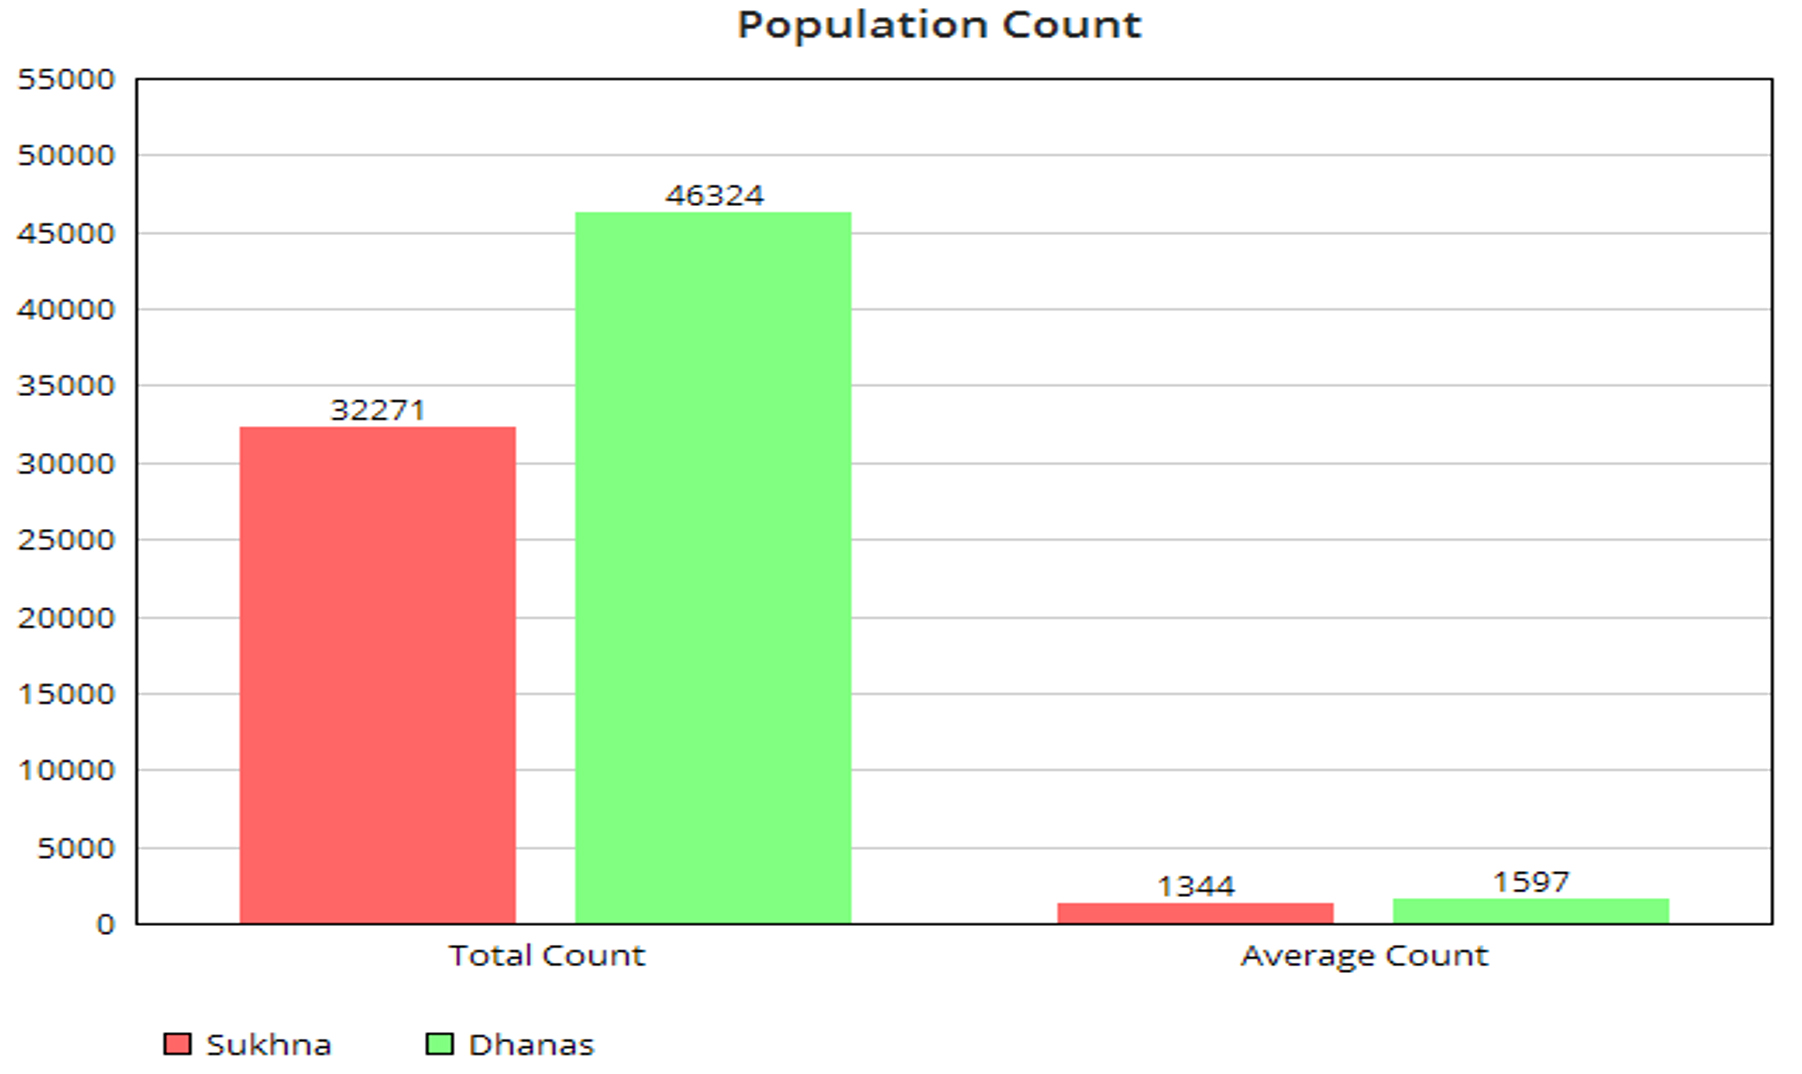
Fig. 3. Population Count
Calculation Using Microscopic Images
Around three thousand slides were made and these slides were captured using a microscope having magnification 4 x. For machine learning algorithms, there was a need to grade the images and eliminate the images that did not hold useful information. The grading and marking of images were then performed manually with the help of a professional, and reference manuals were consulted. The final collection of 600 (whole mounted) images was selected for the final catalog. In this section, automated processes for counting the number of species from the images for computing the alpha and beta biodiversity indexes are given. The mathematical formula for computing these indexes is given in Table 1.
Table (1):
Formulae for computing Biodiversity Indexes.
| S.No. | Biodiversity Index | Formula | Description |
|---|---|---|---|
| 1 | Simpson Index |
n = the total number of organisms of a particular species |
|
| 2 | Dominance Index | 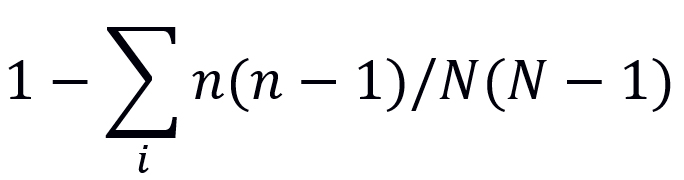 |
|
| 3 | Reciprocal Simpson Index | 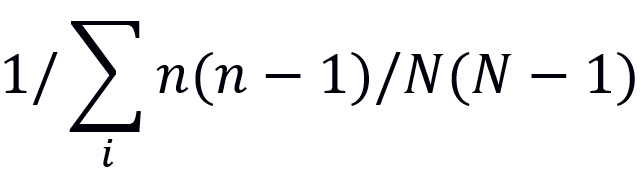 |
|
| 4 | Shannon Index | 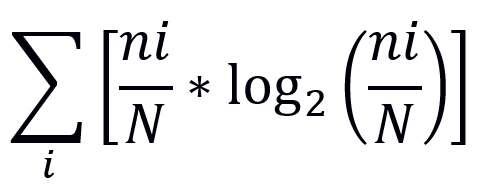 |
|
| 5 | Common Species Index | A intersect B , where A and B are number of species ( A ∩ B) | Number of species found both in A and B |
| 6 | Dissimilarity Index | A’ | B’ , Where A , B ∈ U, where A is the number of species found in Sukhna lake and B found in Dhanas lake | Number of species found in A but not in B or Number of species found in B but not in A. |
By definition, the Alpha biodiversity index is the average of species found in a particular lake. In the context of our research work, each substation is considered as a sampling area for calculating the alpha index. For comparative analysis between the two lakes, beta indexes need to be computed. Using these metrics, an automated algorithm was devised that works iteratively on the images and counts the entire index metric.
Following are the steps involved in automatic biodiversity computations from the slides:
- Initialize counting arrays for each microorganism to be cataloged: These arrays store values of species count and in the end; they help in the aggregation of these counts.
- Read each microorganism slide/Image: For each group/species, a separate folder is created and a file-based dataset is created. Each slide is then processed using a loop for reading its pixels values and positions.
- Segment each image using Segmentation Algorithm: The input matrix is processed using a generalized segmentation algorithm that uses pixel-clustering (Otsu) for gathering similar data points and extracts boundaries of microbes using kirsch convolution filter. The output (segmented images) of these algorithms are stored in a public repository; Mendeley35.
- Run Biodiversity Index Function on each slide: For each image (segmented), this step invokes the function for counting each microbe. This is done with the help of region props method. The region props method first gives labels/indexes to each region it has found. By definition, a minimum of four connected pixels (that have similar properties) is considered as a valid region. The region may or may not represent a microbe or microbe colony. Hence for each microbe, a threshold of pixel numbers was computed using a visual inspection tool for ensuring that each region represents a colony of respective microbes.
- Aggregate the Biodiversity Indexes: The last step includes the aggregation of all counts from each slide/image for computing biodiversity indexes (Simpson Index, Dominance Index, Reciprocal Simpson, Shannon, Common Species Index, Dissimilarity Index) as per the definition.
Table (2):
Input data for Computing Indexes.
S.No. |
Microorganism |
Category |
No. of Instances |
Sukhna (S) |
Dhanas (D) |
Lake |
|---|---|---|---|---|---|---|
1 |
Yeast |
Fungi |
3456 |
1335 |
2121 |
S, D |
2 |
Paramecium |
Protozoa |
4668 |
2236 |
2432 |
S, D |
3 |
Volvox |
Algae |
7136 |
3246 |
3890 |
S, D |
4 |
Spirogyra |
Algae |
4365 |
2247 |
2118 |
S, D |
5 |
Amoeba |
Bacteria |
6327 |
3026 |
3301 |
S, D |
6 |
Pseudomonas |
Fungi |
595 |
346 |
249 |
S, D |
7 |
Mycelium |
Fungi |
1246 |
347 |
899 |
S, D |
8 |
Nostoc |
Algae |
2856 |
1346 |
1510 |
S, D |
9 |
Chlorella |
Algae |
213 |
164 |
49 |
S, D |
10 |
Coccus |
Bacteria |
101 |
0 |
101 |
D |
11 |
Cosmarium |
Algae |
262 |
191 |
71 |
S, D |
12 |
Ulothrix |
Algae |
4154 |
2352 |
1802 |
S, D |
13 |
Oedogonium |
Algae |
3814 |
2025 |
1789 |
S, D |
14 |
Cocconeis cistula |
Algae |
186 |
147 |
39 |
S, D |
15 |
Aspergillus |
Fungi |
3290 |
0 |
3290 |
D |
16 |
Pencicllus |
Fungi |
1611 |
0 |
1611 |
D |
17 |
Spirulina |
Algae |
887 |
352 |
535 |
S, D |
18 |
Oscillatoria |
Algae |
3001 |
2323 |
678 |
S, D |
19 |
Anabaena Azolla |
Algae |
7114 |
0 |
7114 |
D |
20 |
Euglena |
Algae |
1390 |
778 |
612 |
S, D |
21 |
Brown Algae |
Algae |
5687 |
2346 |
3341 |
S, D |
22 |
Rhizopus |
Fungi |
1264 |
569 |
695 |
S, D |
23 |
Trichoderma |
Fungi |
1248 |
345 |
903 |
S, D |
24 |
Microcystis |
Algae |
412 |
0 |
412 |
D |
25 |
Vaucheria |
Algae |
2670 |
1346 |
1324 |
S, D |
26 |
Pithophora |
Algae |
1619 |
807 |
812 |
S, D |
27 |
Chlamydomonas |
Algae |
1020 |
591 |
429 |
S, D |
28 |
Cladophora |
Algae |
4645 |
2334 |
2311 |
S, D |
29 |
Others |
Unknown |
3358 |
1472 |
1886 |
S, D |
Table 2 and Fig. 3 gives information on population statistics obtained with the use of image processing segmentation algorithm. Fig. 4 and Fig. 5 gives information on the values of alpha and beta indexes respectively, obtained after running the automated biodiversity counting algorithm.

Fig. 4. Biodiversity Indexes
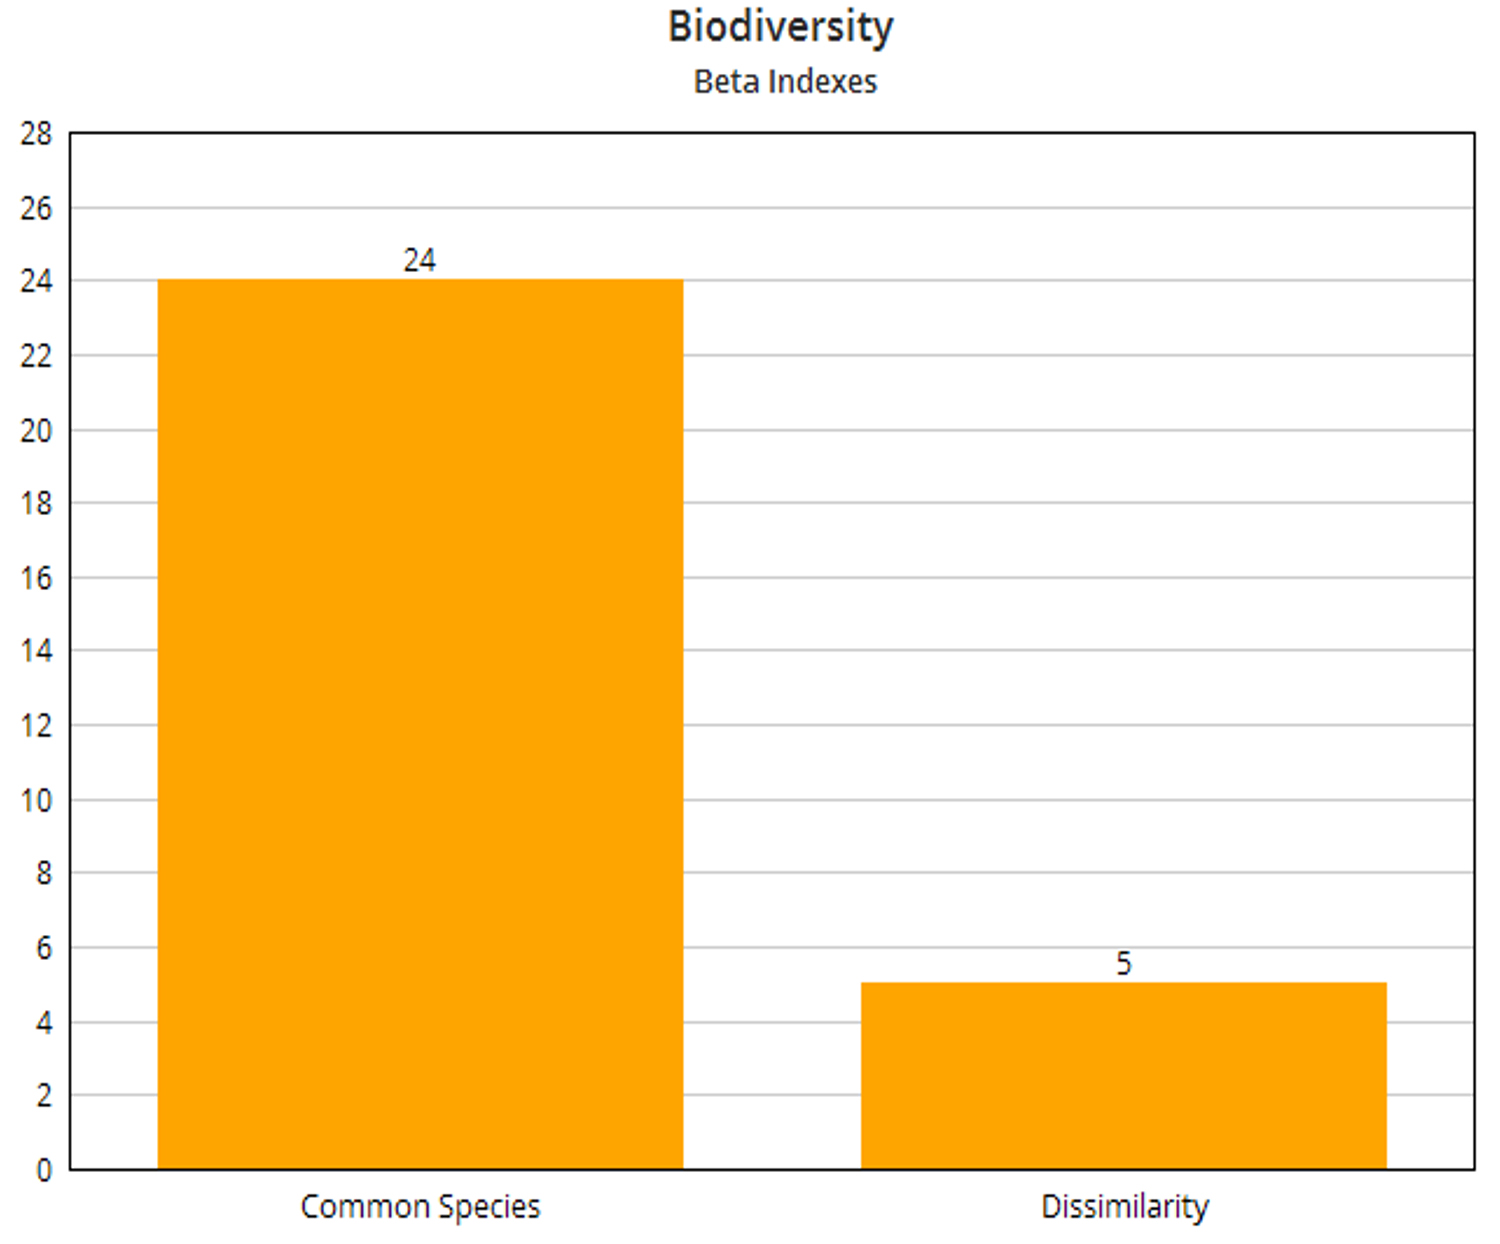
Fig. 5. Beta Indexes
In terms of population, it can thus be observed that Dhanas Lake has a higher number of species and a correspondingly higher count of microorganisms. The average population is also higher. This can be attributed to the fact that spatially data is denser in the case of the Dhanas dataset. Also, the nutrition level at most of the data collection points is higher in the case of Dhanas Lake. Visually, it can be observed that this lake has higher levels of turbidity and muddiness. Statistically, it can further be observed that a fair amount (3358) of microorganisms were not identifiable. Volvox, Brown algae, and Anabaena have a maximum population in Dhanas Lake. The Cocconeis cistula has the lowest count in both the lakes. In the case of Sukhna Lake, it can be observed that Ulothrix, Volvox and Amoeba have maximum populations. The Sukhna Lake does not have any identifiable instance of Coccus, Aspergillus, Pencicllus, Microcystis and Anabaena Azolla. With help of these statistics, the biodiversity of both lakes was computed automatically.
The balance of the ecology in an area is directly related to the count and type of microorganisms found. The Simpson and Shannon Indexes help to track this aspect. It can be observed that the total number of microorganisms found and identified in the case of Dhanas Lake are higher than Sukhna Lake. This implies that the Simpson index of Dhanas is lower as compared to Sukhna Lake as shown in Fig. 4. Consequently, it can be inferred that Dhanas Lake has a higher richness and higher level of diversity as compared to Sukhna Lake.
Longitudinal studies show that the main reason for disturbance in ecological balance is due to the reduction of species population or dominance of particular species. The dominance of a particular species has two possible consequences. The first one is that the count of many species may get reduced due to the predatory nature of one of the species or it may be just dominant due to the abundance of particular types of food and is not impacting the population cycle of the other species. For further insight, the dominance index was computed and observed statistically. Ideally, the dominance index value should be one and it can be seen from the above table that Sukhna has a dominance index value of 0.93 and Dhanas has 0.941. From this, it can be safely concluded that Dhanas has marginally a higher level of biodiversity. This argument is reinforced when the value of the Reciprocal Simpson index is considered, as it can be seen that the Dhanas Lake’s Reciprocal Simpson index value is higher as compared to Sukhna Lake. Clearly, the relative abundance of different species in the case of Dhanas is also higher than Sukhna. The most abundant species are Volvox and Amoeba in the case of Sukhna. The metrics used here for understanding the biodiversity of the Sukhna and Dhanas Lakes are based on the random sampling technique. The species are randomly sampled from each dataset of both lakes so that bias is reduced and the effect of the sample size is accounted for. The metrics consider abundance as well as evenness for giving an insight on diversity for the two sites.
When a comparison is done between the two sites for computing Beta Diversity [Fig. 5], it can be observed that the similarity index (Common Species by Intersection) is 24 and the Dissimilarity index is five.
To the best of our knowledge, it can be said with confidence that limited work has been done in the context of computing Sukhna and Dhanas biodiversity indexes using microscopic imaging. The research work gives details on the composition of species in each sample collection station. This biodiversity study is an attempt to automate the computations of biodiversity indexes by using laboratory developed microscopic slides/ images. To achieve the previously mentioned goals of this study, an automatic algorithm to segment and count the population of each microorganism was created. The experimentation shows that our novel hybrid segmentation algorithm is quite useful for calculations of biodiversity indexes accurately. The goal of the research is to establish the facts from the biodiversity study of Sukhna and Dhanas Lake. The first fact that can be established from this study is that biodiversity is not the same in both the lakes and there are significant differences in terms of characteristics of the water bodies. This may be attributed to the different compositions of pollution and nutrition at surface level and the exposure to sunlight. The statistical analysis of the biodiversity values gives us a hint on the state of ecology and the health of microorganisms in the lake. Clearly, from the metric values, we can say that there is a need to improve the biodiversity of both lakes and these water bodies are candidates for ecological sensitivity studies. It is apparent the Dhanas Lake has better biodiversity than Sukhna but it seems to be prone to harmful algal blooms. This may be because higher levels of nutrition/contamination that promotes the growth of harmful algae are entering the Lake. The sources of pollution need to be plugged so that ecological balance can be made.
This research work is an attempt to demonstrate the role of automated computer algorithms for supporting biodiversity studies. For further directions, it is suggested that other regions of water bodies must be included and leveraging of machine and deep learning algorithms should be done to automate the identification process of microorganisms.
ACKNOWLEDGMENTS
Authors are highly thankful to Dr. Sanjay Bhatia, P.G. Department of Zoology, University of Jammu, India for helping us in doing the tedious work of manual identification of microorganisms and for providing constant guidance and support.
CONFLICT OF INTEREST
All authors declare that there is no conflict of interest.
AUTHORS’ CONTRIBUTION
All authors listed have made a substantial, direct and intellectual contribution to the work, and approved it for publication.
FUNDING
None.
ETHICS STATEMENT
This article does not contain any studies with human participants or animals performed by any of the authors.
AVAILABILITY OF DATA
The dataset and code used during the current study are available in the Mendeley repository, at Doi: 10.17632/f9m85ptmvc.2, 2020.
- Kesavan K, Jayanthi S. Macroalgae: The source of antimicrobial bioactive molecules for protection against disease causing pathogens. Res J Pharm Technol. 2018;11(9):3957-3963.
Crossref - Il’in VP. The conception, requirements and structure of the integrated computational environment. In: Communications in Computer and Information Science. 2019.
Crossref - Jalbert K, Kinchy AJ. Sense and Influence: Environmental Monitoring Tools and the Power of Citizen Science. J Environ Policy Plan. 2016;18(3):379-397.
Crossref - Steenweg R, Hebblewhite M, Kays R, et al. Scaling-up camera traps: monitoring the planet’s biodiversity with networks of remote sensors. Front Ecol Environ. 2017:15(1):26-34.
Crossref - Chamberlain S, Boettiger C. R Python, and Ruby clients for GBIF species occurrence data. 2017; (Preprints 5:e3304v1).
Crossref - Sierra-Alcocer R, Stephens C, Barrios J, Gonzalez-Salazar C, Salazar Carrillo JC, Romero Martinez P. SPECIES: Supporting big-data-driven research. Biodivers Inf Sci Stand. 2019;3:e36095.
Crossref - Trizna M, Dikow T. SpOccSum: An easy-to-use Python tool to summarize species occurrence data from material examined lists in taxonomic revisions. Biodivers Inf Sci Stand. 2019;3:e36513.
Crossref - Chardhry P, Sharma MP, Bhargava R, Kumar S, Dadhwal PJS. Water Quality Assessment of Sukhna Lake of Chandigarh City of India. Hydro Nepal J Water, Energy Environ. 2013;12:26-31.
Crossref - Manzoor K, Raj P, Sheoran R, et al. Water Quality Assessment through GIS: A Case Study of Sukhna Lake, Chandigarh, India. Int Res J Eng Technol. 2017;4(11):1773-1776.
Crossref - Semwal P, Khobragade SD, Nainwal HC. Modelling of Recent Erosion Rates in a Lake Catchment in the North-Western Siwalik Himalayas. Environ Process. 2017;4(2):355-374.
Crossref - Grewal S. Impact of soil conservation measures on soil properties in sukhna lake catchment. Indian J Soil Conserv. 2014;42(2):216-223.
- Singh DK, Singh N. Drying Urban lakes: A consequence of climate change, urbanization or other anthropogenic causes? An insight from northern India. Lakes Reserv Res Manag. 2019;24(2):115-126.
Crossref - McCravy KW. A review of sampling and monitoring methods for beneficial arthropods in agroecosystems. Insects. 2018:170.
Crossref - Lutinski JA, Guarda C, Lutinski CJ, Busato MA, Garcia FRM. Fauna of ants in permanent preservation areas of hydroelectric power plants. Cienc Florest. 2018;28(4):1741-1754.
Crossref - Rovero F, Tobler M, Sanderson J. Camera trapping for inventorying terrestrial vertebrates. Man F Rec Tech Protoc All Taxa Biodivers Invent Monit. 2010;8.
- Grieshop MJ, Werling BP, Buehrer K, Perrone J, Isaacs R, Landis D. Big Brother is Watching: Studying Insect Predation in the Age of Digital Surveillance. Am Entomol. 2012;58(3):172-182.
Crossref - Gomes-Mota J, Azevedo F, Campos Pinto L, Silva NP, Casaca J. Sharing the transmission grid with storks and other birds. In: CIGRE Session 45 – 45th International Conference on Large High Voltage Electric Systems 2014; 2014.
- Carmignani JR, Roy AH. Ecological impacts of winter water level drawdowns on lake littoral zones: a review. Aquat Sci. 2017;79(4):803-824.
Crossref - Ganchev TD. Ubiquitous computing and biodiversity monitoring. In: Advances in Ubiquitous Computing. 2020:239-259.
Crossref - Herzog F, Franklin J. State-of-the-art practices in farmland biodiversity monitoring for North America and Europe. Ambio. 2016:45(8):857-871.
Crossref - Brummitt N, Regan EC, Weatherdon L V., et al. Taking stock of nature: Essential biodiversity variables explained. Biol Conserv. 2017;213:252-255.
Crossref - Rocchini D, Luque S, Pettorelli N, et al. Measuring β-diversity by remote sensing: A challenge for biodiversity monitoring. Methods Ecol Evol. 2018;9(8):1787-1798.
Crossref - Kim BR, Shin J, Guevarra RB, et al. Deciphering diversity indices for a better understanding of microbial communities. J Microbiol Biotechnol. 2017;27(12):2089-2093.
Crossref - Di Battista T, Fortuna F, Maturo F. Environmental monitoring through functional biodiversity tools. Ecol Indic. 2016;60:237-247.
Crossref - Fedor P, Zvarikova M. Biodiversity indices. In: Encyclopedia of Ecology. ; 2018:337-346.
Crossref - Mitchell RJ, Hewison RL, Britton AJ, et al. Forty years of change in Scottish grassland vegetation: Increased richness, decreased diversity and increased dominance. Biol Conserv. 2017;212:327-336.
Crossref - Guisande C, Heine J, Garcia-Rosello E, Gonzalez-Dacosta J, Vilas LG, Perez-Schofield BJG. DER: An algorithm for comparing species diversity between assemblages. Ecol Indic. 2017;81:41-46.
Crossref - Guevara MR, Hartmann D, Mendoza M. Diverse: An r package to analyze diversity in complex systems. R J. 2016;8(2):60-78.
Crossref - Arzamani K, Vatandoost H, Rassi Y, et al. Richness and diversity of phlebotomine sand flies (Diptera: Psychodidae) in North Khorasan province, northeast of Iran. J Arthropod Borne Dis. 2018;12(3):232-239.
Crossref - Talal ML, Santelmann M V. Plant community composition and biodiversity patterns in urban parks of Portland, Oregon. Front Ecol Evol. 2019;7:201.
Crossref - Nowinska R, Czarna A, Kozlowska M. Cemetery types and the biodiversity of vascular plants – A case study from south-eastern Poland. Urban For Urban Green. 2020;49:126599.
Crossref - Muneepeerakul R, Bertuzzo E, Rinaldo A, Rodriguez-Iturbe I. Evolving biodiversity patterns in changing river networks. J Theor Biol. 2019;462:418-424.
Crossref - Berezsky O, Pitsun O. Automated processing of cytological and histological images. In: Perspective Technologies and Methods in MEMS Design, MEMSTECH 2016 – Proceedings of 12th International Conference. ; 2016:51-53.
Crossref - John SL, Williams GP, Brijithlal ND, Namitha LH, Krishnakumar S. Effect of UV-β radiation on the growth, pigment production and macromolecular contents in marine microalgae. Res J Pharm Technol. 2019;12(12):5888-5892.
Crossref - Dhindsa A, Bhatia S, Agrawal S, Sohi BS. An Efficient Microbes Detection System using Microscopic Images via Morphological and Correlation Based Features. Biomed Pharmacol J, 2020.
Crossref
© The Author(s) 2020. Open Access. This article is distributed under the terms of the Creative Commons Attribution 4.0 International License which permits unrestricted use, sharing, distribution, and reproduction in any medium, provided you give appropriate credit to the original author(s) and the source, provide a link to the Creative Commons license, and indicate if changes were made.