ISSN: 0973-7510
E-ISSN: 2581-690X
Euglena sp. is a freshwater microalga that produces useful metabolites in its biomass. The cultivation with oxidative stress treatments, such as salinity, plays a major role in maintaining the optimal cellular metabolic rate for the optimized growth of Euglena sp. for the production of lipids for biodiesel as well as carotenoids and chlorophyll, which are cell defense pigments that are beneficial for health. A bioflocculation method that uses microalgal flocculants, such as Skeletonema sp., is an alternative harvesting technique that is cost and energy saving. The effect of salinity and bioflocculation treatment on freshwater microalgae has not been widely studied. Therefore, this research determined the effect mechanism of salinity and bioflocculation in the production of lipids, chlorophyll, and carotenoids in Euglena sp. with Skeletonema sp. as a bioflocculant. In this research, the cultivation of Euglena sp. was carried out in Cramer–Myers medium for seven days under salinity treatments of 5, 10, 20, and 0 g/L, and the cultivation of Skeletonema sp. was performed for eight days in F/2 medium with modified silicate removal. Bioflocculation was performed by mixing Euglena sp. and Skeletonema sp. at ratios of 1:1, 1:0.5, and 1:0.25. The research results showed that salinity treatment, in general, succeeded in increasing the growth and production of lipid, chlorophyll, and carotenoid metabolites. The addition of Skeletonema sp. to the culture of Euglena sp. increased the precipitation percentage. A high mixing ratio increased the lipid level but decreased those of chlorophyll and carotenoid metabolites.
Salinity, Bioflocculation, Euglena sp., Skeletonema sp.
Microalgae are prokaryotic or eukaryotic microorganisms that grow by carrying out photosynthesis. Microalgae have a simple cell structure. Their growth requires light, carbon dioxide, water, and nutrients.1 Microalgae can convert these needs into energy through photosynthesis and use it during cell development. Microalgae have a fairly high growth rate and can produce essential biomolecules, such as lipids, vitamins, sterols, carotenoids, proteins, and minerals. Biomolecule production is influenced by environmental conditions, including temperature, medium composition, light intensity, salinity, pH, carbon dioxide, and age of culture.2,3
The metabolites produced by Euglena sp. can be used as basic ingredients in food, cosmetic, and natural dye industries. Stress parameters, such as high salinity, increase the contents of chlorophyll and carotenoids in freshwater microalgae. Elloumi et al.4 showed that the freshwater microalgae Scenedesmus sp. had the highest content of chlorophyll, and carotenoid was found in cultures treated with a salinity of 10 g/L NaCl. Based on the research by Alvensleben et al5 microalgae S.quadricauda and Tetraedron sp. were tested in freshwater for tolerance at salinities of 2, 8, 11, and 18 ppt, and the results showed that nutrient depletion caused increases in lipid and fatty acid levels along with the increase in salinity.
In addition to environmental factors, the harvesting method of microalgae is an important part of the cultivation system to harvest high biomass. Currently, harvesting with the bioflocculation method can be used as a cost- and energy-efficient alternative. The bioflocculation technique use one microalgal flocculant to precipitate the desired non-flocculant microalgae without the addition of chemical flocculants and is believed to be environmentally friendly. Branyikova et al.6 stated that the flocculation of Skeletonema sp. induced flocculation in other microalgal species because of its capability to produce exopolysaccharides (EPSs), which induces faster sedimentation than non-flocculating microalgae.
In this study, we carried out experiments involving variations in the salinity factors in the cultivation of Euglena sp. to induce oxidative stress in this microalga to minimize contamination during cultivation and increase the production of lipids, chlorophyll, and carotenoids. In addition, harvesting was carried out using bioflocculation techniques as cost effective and energy-efficient alternative methods to increase the precipitation percentage.
Experimental design and treatments
This experiment was completed with three repetitions. The factor for Euglena sp. treatment was four concentrations of NaCl (5, 10, and 20 g NaCl/L) and control without treatment (0 g/L). Skeletonema sp. was cultured in a control treatment at 30 ppt salinity. The methodology is as below.
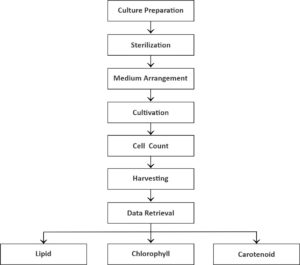 Culture preparation
The stock of Euglena sp. was isolated from Yogyakarta, Indonesia, and Skeletonema sp. was isolated from Balai Perikanan Budidaya Air Payau Situbondo. The cultivation bottles of Euglena sp., with a total of 12 bottles and a volume of 500 mL, were cleaned. Then, Cramers–Myers medium with 5 (0.085 M), 10 (0.170 M), and 20 g/L (0.340 M) salinity treatments and control with 0 g/L salinity were prepared to contain 1000 mg/L KH2PO4, 1000 mg/L (NH4)2SO4, 200 mg/L MgSO4.7H2O, 20 mg/L CaCI2.2H2O, 1.8 mg/L MnCI2.4H2O, 3 mg/L Fe2(SO4)3.7H2O, 1.5 mg/L CoSO4.7H2O, 0.4 mg/L ZnSO4.7H2O, 0.02 mg/L CuSO4.5H2O, 0.2 mg/L Na2MoO4.2H2O, 0.1 mg/L vitamin B1, and 0.0005 mg/L vitamin B12 and then dissolved in 1 L Aqua Dest (Cramer & Myers, 1952), and 3 bottles of Skeletonema sp. were cultured in a 500 mL volume of a medium F/2 containing 1 mL NaNO3, 1 mL NaH2PO4.H2O, 1 mL trace metal solution containing 3.15 g/L FeCl.6H2O, 4.36 g/L Na2–ethylenediaminetetraacetic acid.2H2O, 1 mL MnCl2.4H2O, 1 mL ZnSO4.7H2O, 1 mL CoCl2.6H2O, 1 mL CuSO4.5H2O, 1 mL NaMoO.2H2O. 0.4 g/L vitamin B1, and 0.002 mg/L vitamin B12 and then dissolved in 1 L Aqua Dest.7,8 The medium (400 mL) was mixed in the cultivation bottles following the salinity treatment. Then, 100 mL microalgal stock was added to the bottles.
Maintenance and sampling
Cultivation bottles, which were mounted with plastic hoses plugged into the aerator (Resun LP 100) for aeration, were incubated under a TL 1800 lux lamp for lighting. The bottles were plugged with cotton to reduce the risk of contamination of the culture and placed in a culture room at room temperature (±28°C) for optimal growth. The number of cells was used as the growth parameter of Euglena sp., and the lipid, chlorophyll, and carotenoid contents, as metabolites of microalgae, were measured after harvesting by bioflocculation on the 5th day of cultivation.
Cell count
Cells of microalgae Euglena sp. and Skeletonema sp. were counted using a hemocytometer (Wungmool et al9) at a ratio of 1:4. A total of 900 µL culture sample was added to 1 mL microtube. Then, 100 µl 70% alcohol was added to the microtube and then inserted into an improved Neubauer hemocytometer (1 mm) in the microscope until the chamber was full. The cells in the four-chamber space were then measured by the following formula:
Cell amount/mL = [ Counted cell quantity / 4 ] × 104
The cell density of Skeletonema sp. was calculated using an improved Neubauer hemocytometer under a light microscope at 40x magnification. Using the following formula, the number of cells was calculated at the four ends and the center of the 0.2 mm x 0.2 mm box:
Cell amount/mL = N/5 × 1/0.8 × 25 × 10⁴
Bioflocculation determination
Skeletonema sp. was added to Euglena sp. at the ratios of 1:0.25; 1:0.5; and 1:1 with three repetitions. Each sample was placed in a 15 mL conical tube and allowed to stand for 24 h. As much as 1 mL supernatant was collected and placed in a cuvette. The cuvette was placed in a spectrophotometer and measured at a wavelength of 750 nm. Afterward, sample was then calculated using the following formula:
% Precipitation = (OD750(t0)-OD750(t))/(OD750(t0)) × 100%
Lipid content
The lipid content was measured using the Bligh and Dyer method (1959). First, 15 mL microalgal samples were centrifuged at 4000 rpm for 15 min. The supernatant was discarded, and 2 mL methanol and 1 mL chloroform were added to the pellet. Homogenization was carried out for 1 min using a vortex, and 1 mL chloroform and Aqua Dest were added. The sample was centrifuged until three layers were found, with the lowest layer being lipid. The lipid liquid was obtained, placed in a Petri dish, and incubated for 1 h at 35°C. The Petri dish was weighed, and the following formula was used to calculate the lipid content:
Lipid Content (mg/mL) = ((Final petri dish weight-initial petridish weight))/(sample volume)
Chlorophyll and carotenoid contents
The chlorophyll and carotenoid contents were measured by spectrophotometry. A total of 5 mL microalgal sample was collected into a conical glass. The sample was centrifuged at 3300 rpm for 15 min, and the supernatant was removed. Subsequently, acetone was added as an organic solvent, and the mixture was homogenized using a vortex. Then, 2 mL sample was placed in a spectrophotometer, and the absorbance was measured at wavelengths of 470, 645, and 662 nm with spectra running between 380 and 700 nm. Based on the absorbance calculated by the spectrophotometer, chlorophyll can be obtained as a combination of total chlorophylls a and b compounds and carotenoid levels using the following equation.
Chl a (g/L) = ([11,75 x (A 662) – 2,350 x (A 645)] )/1000
Chl b (g/L) = ([18,61 x (A 645) – 3,960 x (A 662)] )/1000
Total Chl (g/L) = Chl a + Chl b
Car (g/L) = ([1000 x (A 470)-2,270 X Chl a-81,4 x Chl b /227])/1000
Statistical analysis
Data were subjected to analysis of variance and correlation analysis using IBM Statistical Product and Service Solutions software (Version 25, IBM Corporation, USA). The analysis was carried out in three replications, and the results were expressed as the dependent treatment’s mean (n = 3) ± standard error. Differences between the treatment mean on growth were analyzed by one-way analysis and compared using DMRT. Meanwhile, for bioflocculation, lipids, chlorophyll, and carotenoids were analyzed by two-way analysis and compared using least significant difference at a p-value ≤ 0.05.
Cell count
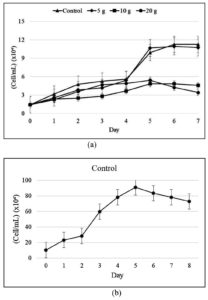
From the study results shown in Figure 2, from day 0 to day 7 of cultivation, the control treatment had the highest cell density, followed by 5, 20, and 10 g/L treatments. A fairly high recreation of cell density was observed under 20 g/L treatment on the 5th day of cultivation. Overall, the cell density increased from day 0 to day 5 and started to decrease on day 6. The salinity treatment generally had a lower mean cell density than the control treatment.
Figure 2. Cell density of (a) Euglena sp. after 7 days of cultivation and (b) Skeletonema sp. after 8 days of cultivation
Based on the growth curve obtained, the culture of Euglena sp. can adapt and grow up to 20 g/L salinity treatment. Adaptability is supported by the source of nutrients in the culture, and the aged culture was used as the inoculum.10 The exponential phase was still achieved, which meant that the nutrition and microalgal culture environment were in optimal conditions, and thus, the growth was non-linear.11 Based on the calculation of the specific growth rate, the 5 g/L treatment had the highest specific growth rate, which indicated the high exponential growth of cell density in this phase.
The growth of Skeletonema sp. with the highest cell density was obtained on the 5th day (Figure 1b). The lag phase in Skeletonema sp. occurred on days 0-2. The Skeletonema sp. culture entered the log or exponential phase, where cell division occurred rapidly on the 3rd to 5th day. The specific growth rate of Skeletonema sp. was 0.386 ± 0.008. The Skeletonema sp. culture in this study exhibited a growth with a cell density that was significantly different from the culture of Euglena sp. in the control, 5, 10, and 20 g/L salinity treatments, with significance of 0.007.
Bioflocculation determination
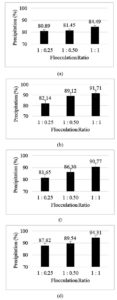
The results showed that the most optimal percentage of flocculations (94.31%) was observed at the 1:1 ratio of Euglena sp. and Skeletonema sp. (Figure 3). Meanwhile, the lowest percentage of precipitation (80.89%) was observed at 1:0.25 ratio of Euglena sp. and Skeletonema sp. Based on the graph in Figure 1b, the addition of flocculant can increase the precipitation percentage. The higher the mixing ratio, the more Skeletonema sp. mixed into the culture of Euglena sp. Skeletonema sp. is a flocculant or auto-flocculating microalga that can induce sedimentation faster than non-flocculating microalgae and increase the harvesting efficiency. When the cultures were mixed, Skeletonema sp. excreted EPS, which bound to Euglena sp. cells via a bridging or patching mechanism.12,13 If the polymers bind partially, the unoccupied part can bind to other microalgal cells, thereby bridging and forming a network of polymers and microalgal cells. However, if the polymers bind microalgal cells completely because they are extremely short to bind others, they are adsorbed to the surface and can create positive charges (patching). These charges attract other microalgal cells and result in the flocculation of cells. The floc formed will settle to the bottom of the media14,15 showed that EPS production increases due to optimal culture environmental conditions.
Figure 3. Precipitation percentage of Euglena sp. and Skeletonema sp. in different salinity treatments: (a) 0, (b) 5, (c) 10, and (d) 20 g/L
Lipid content
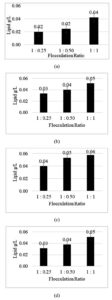
The highest lipid content was 0.058 g/L, which was found in the mixture of Euglena sp. in 10 g/L salinity treatment and Skeletonema sp., and the lowest was 0.020 g/L in the mixture of Euglena sp. control treatment and Skeletonema sp. (Figure 4). Based on the results, the lipid content increased when the salinity increased but decreased with the 20 g/L salinity treatment. Each salinity treatment significantly affected the lipid contents of Euglena sp. and Skeletonema sp.
The highest cell lipid content was found at the ratio of 1:1, whereas the lowest (10 g/L salinity treatment) was observed at the ratio of 1:0.25. The lipid content increased with the increase in the ratio of mixed bioflocculants. The lower the flocculant microalgae, the higher the lipid content produced.
Chlorophyll content
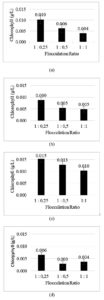
Figure 5 shows the effect of salinity on the chlorophyll content of mixed culture Euglena sp. and Skeletonema sp. The highest chlorophyll content was observed in the 10 g/L salinity treatment and the lowest in the 20 g/L salinity treatment and Skeletonema sp. The highest and lowest cell chlorophyll contents were measured at the ratios of 1:0.25 and 1:1, respectively. The chlorophyll content increased as the ratio of the mixed bioflocculants decreased. The analysis showed that the salinity treatment and mixing ratio of Euglena sp. and Skeletonema sp. significantly affected the chlorophyll content.
Carotenoid content
The highest carotenoid content (0.594 g/L) was found in the mixture with a salinity treatment of 10 g/L, and the lowest chlorophyll content (0.142 g/L) was obtained in the mixture of 20 g/L salinity treatment. As shown in Figure 6, the 10 g/L salinity treatment resulted in the highest amount of carotenoid content compared with the control, 5, and 20 g/L treatments. The highest cell carotenoid content was found at the ratio of 1:0.25 and the lowest at 1:1 ratio. The carotenoid content increased as the ratio of flocculant decreased. The salinity treatment and mixing ratio of Euglena sp. and Skeletonema sp. significantly affected the carotenoid content.
Scenedesmus sp. is a freshwater microalga with the same habitat as Euglena sp. Based on the work of Elloumi et al.4, Scenedesmus sp. demonstrated optimal growth rate and metabolite production in the salinity treatment of 10 g/L NaCl. The salinity treatment of 10 g/L NaCl resulted in the highest production of carotenoids and chlorophyll, whereas the pigment content of Scenedesmus sp. decreased at high salt concentrations.
Salinity treatment affected the growth of Euglena sp. The growth of Euglena sp. decreased as salinity increased. The culture with 5 g/L salinity treatment exhibited the highest specific growth rate of 0.678 ± 0.479. The Euglena sp. culture in this study can adapt well to the control environment and tolerate the environment with a salinity treatment of 5 g/L. The lowest specific growth rate was found in cultures treated with salinities of 10 and 20 g/L. High salinity can inhibit the division of microalgal cells. A high concentration of salt (NaCl) creates a hypertonic state outside the cell. This condition causes water molecules to flow out of the cell, shrinking the cell and consequently damaging the cell and cellular components. Stress due to salinity can be overcome by microalgae through the production of high amounts of lipids. Hence, the dry weight of microalgae can be increased.16
Harvesting with bioflocculation method allows microalgal harvesting without the addition of chemical flocculants and the reuse of culture media without additional treatment; thus, this method is believed to be environmentally friendly because the harvested residual water free from chemicals can be reused or disposed of without the need for high-cost management.17 Branyikova et al.6 stated that the flocculation of Skeletonema sp. can induce flocculation in other microalgal species.
The data from the bioflocculation experiment showed that the highest flocculation power was found in the mixture of Euglena sp. salinity treatment of 20 g/L and Skeletonema sp. with a flocculation ratio of 1:1 (94.31%), and the lowest was observed in the mixture of control treatment and Skeletonema sp. with a flocculation ratio of 1:0.25 (80.89%). Each salinity treatment showed a trend, that is, the increase in salinity can decrease the precipitation percentage. These results followed the research findings of Salim et al17, suggesting that sedimentation will increase along with the ratio of microalgal flocculants during mixing. Skeletonema sp. is a flocculant microalga triggered by the EPS substances it produces. Thus, it can induce faster sedimentation than non-flocculating microalgae. When the culture of Euglena sp. and Skeletonema sp. was mixed, the EPS excreted by Skeletonema sp. bound Euglena sp. with a bridging mechanism; then, a net formed by the flocculant microalgae caught the Euglena sp. cells, resulting in floc formation at the bottom of the medium.12 The salinity significantly differed between the control and 20 g/L salinity treatment. This finding was caused by the increased production of EPS in Skeletonema sp. cells due to the high salinity of the Euglena sp. culture. The process of EPS synthesis by microalgal cells is influenced by many factors, such as light, temperature, culture aeration, culture age, nutrient availability, nutrient type, and salinity. Therefore, proper adjustment of culture conditions can promote EPS synthesis.15
All salinity treatments had higher mean lipid contents than the control treatments at each flocculation ratio. The graphs for the 5, 10, and 20 g/L salinity treatments showed higher lipid contents than the control treatment. The graph increased when salinity increased but decreased with the 20 g/L salinity treatment. The 10 g/L salinity treatment induced the highest lipid content. This finding may be caused by stress due to salinity, which resulted in stress on microalgal cells. Thus, microalgal cells can produce higher lipids as stress metabolites. Salinity can damage microalgal cells at very high concentrations, but an optimal stress can increase lipid production. The 10 g/L salinity treatment was the optimal stress. Therefore, it can trigger productive oxidative stress in cells. Under unfavorable environmental conditions, several microalgal species synthesize large numbers of lipids, such as triacylglycerol (TAG). The increase in neutral lipid content in algal cells is an adaptation mechanism that allows algae to respond to increased osmotic pressure and maintain fluidity and cell membrane integrity under high NaCl concentrations. When subjected to NaCl stress, the pattern of lipid synthesis changes, but photosynthesis and assimilation of carbon elements continue, which increases the level of TAG synthesized and stored in the cytoplasm in the form of oil droplets.18
The highest and lowest cell lipid contents were observed at the ratios of 1:1 and 1:0.25, respectively. The lipid content increased with the increase in the ratio of mixed bioflocculants. Cultures with the addition of other microalgae have the potential to produce more lipids. This diversity increases the efficiency of using photosynthetically active radiation, thereby increasing the productivity of primary cultures. Lipid production from biomass will increase when primary productivity increases. Mixed culture also increases the nutrient use efficiency in culture, thereby creating nutrient stress
conditions19,20. According to Hue et al21, the limited number of nutrients will stimulate microalgae to accumulate more lipids.
The optimal chlorophyll and carotenoid contents were found in the 10 g/L treatment. According to Pisal and Lele22, cells can adapt to increased salinity due to the presence of glycerol, which can balance the extracellular osmotic pressure. The contents of chlorophylls a and b and the total carotenoids decreased with the increase in NaCl concentration. The freshwater microalga Scenedesmus obliquus has the same habitat as Euglena sp., which presents significant differences in photosynthetic pigment content between the microalgal cells cultured at different NaCl concentrations. The contents of chlorophyll a, b, and total carotenoids decreased with the increase NaCl concentration. Ji et al.18 observed that the contents of chlorophylls a and b decreased significantly with the increase in NaCl concentration. High NaCl concentrations increase the activity of chlorophyll enzymes and thus promote the degradation of chlorophyll a.
Chlorophyll a is a crucial component of the light-harvesting pigment-protein complex and plays a vital role in photosynthesis. Therefore, the decrease in chlorophyll content will reduce the photosynthetic capacity and inhibit the growth of microalgae. The content of photosynthetic pigments, as an essential index of the photosynthetic capacity of plants, can be influenced by changes in environmental factors, such as salinity. Carotenoids can absorb light energy and are endogenous antioxidants. In addition to its function in photosynthesis, carotenoids can quench reactive oxygen, thereby preventing membrane lipid peroxidation (Willekens et al)23 and protecting photosynthetic function.
The highest cell chlorophyll and carotenoid contents were found at the ratio of 1:0.25, and the lowest cell chlorophyll content was obtained at the 1:1 ratio. The contents of chlorophyll and carotenoids increased as the ratio of the mixed bioflocculants decreased. According to Stockenreiter et al19, mixed cultures can create nutritional stress conditions. The higher the mixing ratio, the more nutrients that are needed, thus causing nutritional stress conditions. Mixing the cultures of Euglena sp. and Skeletonema sp. resulted in nutritional stress conditions. The higher the mixing ratio, the more nutrients that are needed. This condition then inhibits the production of carotenoid cells.24
This phenomenon can also be caused by the increased number of Skeletonema sp. mixed into the Euglena culture, which increases the salt concentration in the culture. The pigment content may decrease at high salt concentrations. The decreases in chlorophyll and carotenoid contents at high salinity are caused by the decrease in the rate of photosynthesis due to the salt osmotic pressure and toxic ion pressure. Thus, chlorophyll is the main target of salt toxicity and the decrease in the rate of photosynthesis and growth of microalgae. Variations in culture environment can create stress conditions in cells, indicating the synthesis and accumulation of carotenoids and chlorophyll in cells.25,26
This study showed that salinity treatment successfully increased growth and influenced the physiological response of Euglena sp. by increasing the production of lipid metabolites, chlorophyll. Carotenoids with optimum salinity levels were achieved during growth in the 5 g/L salinity treatment, and lipids and metabolites of chlorophyll and carotenoids were produced in the 10 g/L salinity treatment. The addition of Skeletonema sp. to the culture of Euglena sp. increased the precipitation percentage. The larger the mixing ratio, the higher the bioflocculation. The optimal mixing ratio used for the harvesting process was 1:1 Euglena sp. and Skeletonema sp. The larger the mixing ratio, the higher the lipid content, with an optimal mixing ratio of 1:1. Conversely, the larger the mixing ratio, the lower the chlorophyll and carotenoid cell contents. The highest chlorophyll and carotenoid contents were obtained at the 1:0.25 mixing ratio.
ACKNOWLEDGMENTS
The authors would like to thank The Ministry of Education, Culture, Research, and Technology of the Republic of Indonesia for their support.
CONFLICT OF INTEREST
The authors declare that there is no conflict of interest.
AUTHORS’ CONTRIBUTION
All authors listed have made a substantial, direct and intellectual contribution to the work, and approved it for publication.
FUNDING
None.
DATA AVAILABILITY
All datasets generated or analyzed during this study are included in the manuscript.
ETHICS STATEMENT
This article does not contain any studies on human participants or animals performed by any of the authors.
- Yuarrina WP, Pradana YS, Budiman A, et al. Study of cultivation and growth rate kinetic for mixed cultures of local microalgae as third generation (G-3) bioethanol feedstock in thin layer photobioreactor, Journal of Physics: Conference Series. 2018;1022.
Crossref - Zullaikah S, Utomo AT, Yasmin M, et al. Advances in Eco-Fuels for a Sustainable Environment, 1st ed. Ecofuel conversion technology of inedible lipid feedstocks to renewable fuel. Woodhead Publishing Series in Energy. 2019;237-276.
Crossref - Kusmayadi A, Kit LY, Yen H, Huang C. Microalgae as sustainable food and feed sources for animals and humans – Biotechnological and environmental aspects, Chemosphere. 2021;271(4):129800.
Crossref - Elloumi W, Jebali A, Maalej A, et al. Effect of Mild Salinity Stress on the Growth, Fatty Acid and Carotenoid Compositions, and Biological Activities of the Thermal Freshwater Microalgae Scenedesmus sp., Biomolecules. 2020;10: 1.
Crossref - Alvensleben N, Magnusson M, Heimann K. Salinity tolerance of four freshwater microalgal species and the effects of salinity and nutrient limitation on biochemical profiles. Journal of Applied Phycology. 2016;28:861–876.
Crossref - Branyikova I, Prochazkova G, Potocar T, et al. Harvesting of microalgae by flocculation. Fermentation. 2018;4(93): 1-12.
Crossref - Kang K, Bomi, R, Zhong-Ji Q. Characterization of Growth and Protein Contents from Microalgae Navicula incerta with the Investigation of Antioxidant Activity of Enzymatic Hydrolysates, Food Science and Biotechnology. 2011;20(1):183-191.
Crossref - Sudibyo H, Purwanti Y, Pradana, Y. Modification of growth medium of mixedculture species of microalgae isolated from southern java coastal region, MATEC Web of Conferences. 2018;154:1-6.
Crossref - Wungmool P, Rangsi N, Hormwantha T, et al. Measurement of the cell density of microalgae by an optical method, Journal of Physics: Conference Series. 2019;1298:1.
Crossref - Prihantini NB, Putri B, Yuniati R. Pertumbuhan Chlorella spp. dalam medium ekstrak tauge (met) dengan variasi pH awal, MAKARA of Science Series. 2010; 9(1): 1-6. https://lontar.ui.ac.id/detail?id=117425. Accessed June 25, 2021.
- Prayitno J. Pola pertumbuhan dan pemanenan biomassa dalam fotobioreaktor mikroalga untuk penangkapan karbon, Jurnal Teknologi Lingkungan. 2016;17(1): 45-52. https://ejurnal.bppt.go.id/index.php/JTL/article/view/1464
- Salim S., Bosma R, Vermue MH, Wijffels RH. Harvesting of microalgae by bioflocculation, Journal of Applied Phycology. 2010;23(5): 849–855. https://link.springer.com/article/10.1007/s10811-010-9591-x. Accessed November 25, 2021.
- Pujiyanto M, Maslachah L, Koerniawan MD, et al. The activity of mixed microalgae polysaccharides from Indonesia as anti-malaria in vitro, Jurnal Ilmiah Perikanan dan Kelautan. 2022;14(2).
Crossref - Suyono EA, Retnaningrum E, Ajijah N. Bacterial symbionts isolated from mixed microalgae culture of Glagah strains, International Journal of Agriculture and Biology. 2018;20(1):33-36.
Crossref - Babiak W, Krzemińska I. Extracellular Polymeric Substances (EPS) as Microalgal Bioproducts: A Review of Factors Affecting EPS Synthesis and Application in Flocculation Processes, Energies. 2021;14(13): 1-23.
Crossref - Suyono EA, Haryadi W, Zuzron M, et al. The Effect of Salinity on Growth, Dry Weight and Lipid Content of the Mixed Microalgae Culture Isolated from Glagah as Biodiesel Substrate, Journal of Life Sciences. 2015;9:230-231.
Crossref - Salim S, MH Vermuë, RH Wijffels. Ratio between autoflocculating and target microalgae affects the energy-efficient harvesting by bio-flocculation, Bioresource Technology. 2012;118: 49–55.
Crossref - Ji X, Cheng J, Gong D, et al. The effect of NaCl stress on photosynthetic efficiency and lipid production in freshwater microalga Scenedesmus obliquus XJ002, Science of the Total Environment. 2018;633:593–599.
Crossref - Stockenreiter M, Haupt F, Graber AK, Seppälä J, et al. Functional group richness: implications of biodiversity for light use and lipid yield in microalgae, Journal of Phycology. 2013;49(5):838-47.
Crossref - Sabilil MS, Suyono EA. Biomass composition of microalgae local mixed culture using POME (palm oil mill effluent) medium, Research Journal of Biotechnology. 2021;16(5):41-50. https://www.researchgate.net/publication/351223891_Biomass_Composition_of_
Microalgae_Local_Mixed_Culture_using_POME_Palm_Oil_Mill_Effluent_Medium. Accessed October 15, 2022. - Hu Q, Sommerfeld M, Jarvis, E, et al. Microalgal triacylglycerols as feedstocks for biofuel production: perspectives and advances, The Plant Journal. 2008;54(4):621–639.
Crossref - Pisal DS, Lele SS. Carotenoid production from microalgae, Dunaliella salina, Indian Journal of Biotechnology. 2005;4:476-483. https://www.semanticscholar.org/paper/Carotenoid-production-frommicroalga%2C-Dunaliella-Pisal-Lele/a7e6f245cd03482e26261e3e4e2c96e24efeee3d. Accessed January 22, 2022.
- Willekens H, Van CW, Van MM, Inze D, et al. Ozone, sulfur dioxide, and ultraviolet B have similar effects on mRNA accumulation of antioxidant genes in Nicotiana plumbaginifolia L., Plant Physiol. 1994;106:1007-1014.
Crossref - Henriksen P. Effects of nutrient-limitation and irradiance on marine phytoplankton pigments, Journal of Plankton Research. 2002;24(9): 835–858.
Crossref - Lemoine Y, Schoefs B. Secondary ketocarotenoid astaxanthin biosynthesis in algae: A multifunctional response to stress, Photosynthesis Research. 2010;106:155–177.
Crossref - Kobayashi, M. Astaxanthin biosynthesis enhanced by reactive oxygen species in the green alga Haematococcus pluvialis, Biotechnology and Bioprocess Engineering. 2003;8(6):322-330.
Crossref
© The Author(s) 2022. Open Access. This article is distributed under the terms of the Creative Commons Attribution 4.0 International License which permits unrestricted use, sharing, distribution, and reproduction in any medium, provided you give appropriate credit to the original author(s) and the source, provide a link to the Creative Commons license, and indicate if changes were made.


