

ISSN: 0973-7510
E-ISSN: 2581-690X
There are several toxic microalgae species known as Harmful algal bloom (HAB) causing serious effects to the environment and economy. Knowledge on these groups of marine micro-flora is scanty and several areas remain unexplored. The present study focuses on the analysis of microalgal diversity in the Malabar coastal areas at Southwest and Northeast monsoon. The diatoms, dinoflagellates and total microalgal population were analysed and quantified. Predominant species were identified. Physicochemical parameters of the seawater at different time intervals and Correlation between diatoms, dinoflagellates and total microalgae population with physicochemical parameters were identified. From the analysis, a total of 53 diatoms and 15 dinoflagellates were identified. The predominant species including toxic or harmful bloom-forming were found to be Dinophysis caudata, Noctiluca scintillans, Prorocentrum lima and Tripos furca. The total microalgae population varied from 18,592 cells/L to 7,832 cells/L in the months of April and December. Dinoflagellates were positively correlated with salinity (r = 0.848; p = 0.008), nitrite (r = 0.752; p = 0.032) and total phosphorous (r = 0.734, p = 0.038). Diatoms were positively correlated with temperature (r = 0.804; p = 0.016) and nitrate (r = 0.774, p = 0.024). Total microalgal density was positively correlated with temperature (r = 0.825; p = 0.012) and nitrate content (r = 0.811, p = 0.15).
Harmful algal blooms, Malabar Coast, Marine microalgae, Physicochemical properties, Correlation analysis
Life in the sea consists of three major groups of organisms namely plankton, nekton and benthos, and among these, the plankton is of fundamental importance to fisheries and the environment.1 Microalgae, the predominant primary producers are restricted to the neritic zone due to the abundance of nutrients, light and favourable physicochemical variables like temperature, pH and salinity.2,3
Microalgae constitute 40-50% primary production that occurs by all the algal photosynthesis4 and the secondary production and tertiary production depend on it. It is estimated that the total annual primary production of the world seas is around 2×10⁹ tons of carbon which could yield 240 million tonnes of sea fisheries products. They are also responsible for the production of 80% of the oxygen that we breathe.5,6 The microalgae are of great importance to the globe and the food for filter feeding organisms from bivalves to whales.7 The most important classes of phytoplankton are: Bacillariophyta or Diatoms, Dinophyta or Dinoflagellates, Chlorophyta or Green algae, Cyanobacteria or Blue green algae, Euglenophyta, Chrysophyta and Haptophyta and Xanthophyceae.8
Under favourable conditions, certain microalgal species produce excessive growths in a particular area called bloom.9 Traditionally, the biomass was the criterion most often used to define the bloom. In certain cases, the average cell surface area (µm2) of the microalgae species could serve as the best measure of phytoplankton biomass. There are about 300 phytoplankton species forming blooms and these blooms have both beneficial and harmful activities in marine environment.7,10-12
Harmful Algal Blooms can have wide socio-economic and health impacts. Every year, they cause billions of dollars loss through damaging fishes and sea products.7,13,14 Heavy blooms hinder fishing operations and their weight at times damages the fishing net. Countries all over the world spend millions of dollars to predict and control them. Many environmental factors like light intensity, temperature, salinity, pH and oxygen concentration affect these microalgal populations.14 Also, both micronutrients and macronutrients play an important role. Harmful Algal Blooms and shellfish poisoning have caused human fatalities and related discomforts across the world and along the Indian coast.15-18
Although elaborate studies have been made on marine phytoplankton in many countries of the world, knowledge of these groups of marine microflora is scanty in India. At the same time our country suffers much from the harmful effects of these blooms throughout year. The present study investigates the microalgae and toxic bloom diversity on the Malabar coastal areas at different monsoons (Southwest and Northeast) from October to May 2016. Physicochemical properties and its correlation with total microalgae population were determined.
Collection of samples
Samples were collected from the Malabar Coastal region between Latitude 11° 43′ N and Longitude 75° 33′ East in the South West Coast in the Arabian Sea after the South West monsoon in 2016 till the onset of the next South West monsoon in 2017. The sampling was done for a continuous period of eight months at an interval of one month. The samples included for physicochemical analysis and the microalgae analysis for algal bloom study. Fig. 1 shows the location of the study area.
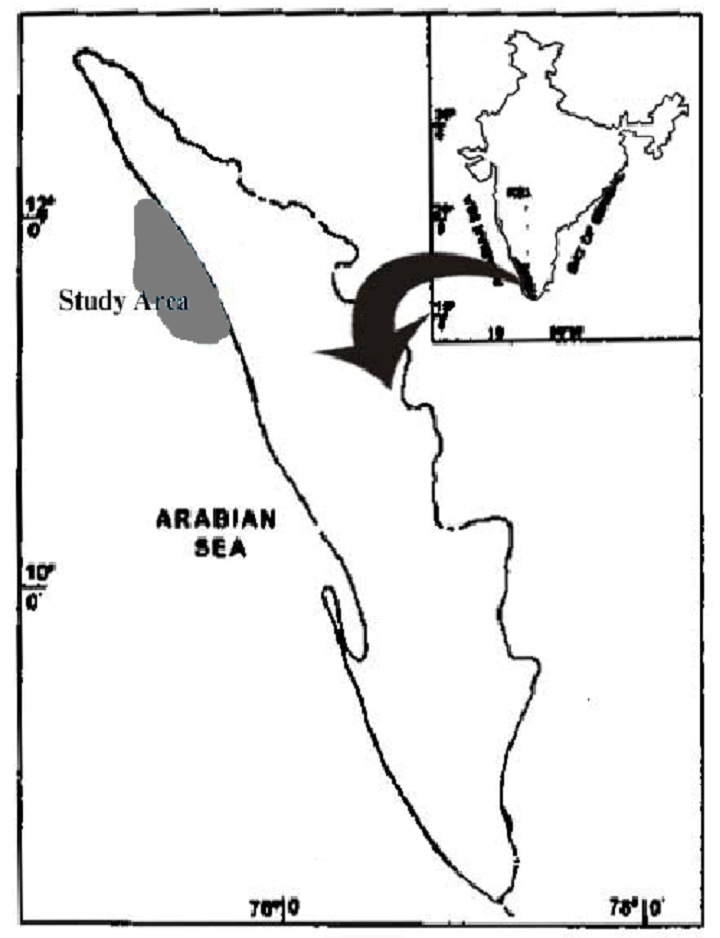
Fig. 1. Geographical location of the study area.
Sampling for microalgae analysis
Both the qualitative and quantitative analysis of microalgae was performed. The details about the sampling are as follows:
Qualitative microalgae analysis
The phytoplankton were collected for the qualitative analysis from the site of sampling using a standard phytoplankton collection net with a mesh size of 20 µm, a mouth diameter of 50 cm and a length of 1 m. The nets are conical with hoop at the wide end and a bottle attached to the narrow end for the collection of microalgae. The ratio of the net length to the net mouth diameter was between 3:1 and 5:1. The net was hauled horizontally from a boat for 15 minutes at a speed of 15 nautical miles per hour. The sample was transferred to a previously marked plastic bottle and live analysis was made immediately at the laboratory using an inverted microscope.
Identification of the microalgae
Net collected microalgae were observed under an inverted microscope using 4X, 10X, 20X and 40X lenses, and identified to species level wherever possible. The identification was based on the morphological characteristics with the help of keys by Tomas,19 Santhanam et al.20 and Subramanyan,21
Live Sample Analysis
Immediately after the collection, the live sample was analysed for the identification of toxic microalgal species. The organisms of interest were isolated using Pasteur pipette and serially transferred to cavity slides containing sterile sea water for pure isolates for culturing.
Culturing of isolates
The marine microalgae samples were cultivated using F/2 medium,22 providing an artificial light source with a light: dark cycle interval of 12:12 at 20°C for a week period.
Preservation of the sample
Samples for qualitative and quantitative analysis were fixed using 10% formalin (equivalent to 4% commercial formaldehyde) with hexamethylene diamin (Hexamin) for further analysis.
Quantitative microalgae analysis
The sampling for quantitative microalgae analysis was done by filtering 100 litres of sea surface water through the standard plankton net. The filtrate collected in the collecting bucket was taken for counting of both living and preserved the cells using a Sedgwick Rafter Cell.23
Sampling for physicochemical parameter analysis
For the analysis of different physicochemical parameters, the samples were collected from the study site, 2 km away from the shore. The samples were analysed immediately for physicochemical parameters. The parameters such as temperature, salinity and pH were analysed at the site itself using a multi-parameter portable meter (Orion Star, USA) and the oxygen content analysed in the laboratory immediately after sampling. The chemical parameters (Nitrite, Inorganic Phosphate, Reactive Silicate, Nitrate, Total Nitrogen and Total phosphorus) were analysed in the laboratory immediately.
Statistical analysis
Statistical analysis was performed using SPSS software version 25.0. Pearson correlation was carried out to see the correlation of physicochemical parameters with total microalgae count. All tests are double-tailed and P-value of less than 0.05 was considered statistically significant.
Microalgae species diversity analysis
A total of 53 diatom species were collected and identified during the study period belonging to different families like Coscinodiscaceae, Actinodiscaceae, Eupodiscaceae, Rhizosoleniaceae, Chaetoceraceae, Biddulphiaceae, Euodieae, Hemiauliniae, Fragilarioidaceae, Achnanthoidaceae and Naviculoidaceae (Table 1). A total of 15 different genera of dinoflagellates were also identified (Table 2). The maximum number of dinoflagellate cells was recorded in the month of May (3,356 cells/litre) and the minimum number of cells in the month of December (634 cells/l). The maximum number of diatom cells was recorded in the month of April (16,304 cells/L) and the minimum in the month of December (7,198 cells/L). At the month of April, the total microalgal count was found to be higher (18591 cells/L) than other months (Table 3; Fig. 2).
Table (1):
Diatom species identified during the study.
No. |
Name of the Diatom Species |
|---|---|
1 |
Paralia sulcata (Ehrenberg) Kutzing |
2 |
Stephanopyxis turris (Grev. et.al ) Ralfs |
3 |
Stephanopyxis palmeriana (Greville) Grunow |
4 |
Skeletonema costatum (Greville) Cleve |
5 |
Thalassiosira.subtilis (Ostenfeld)(Gran) |
6 |
Cyclotella meneghiniana Kutzing |
7 |
Cyclotella striata (Kutzing ) Grunow |
8 |
Thalassiosira eccentrica Ehrenberg |
9 |
Coscinodiscus gigas Ehrenberg |
10 |
Planktoniella sol (Wallich ) schutt |
11 |
Actinoptychus undulatus (Bailey) Ralfs |
12 |
Asterompalus flabellatus (Brebisson) Greville |
13 |
Auliscus sculptus (W. Smith ) Ralls |
14 |
Corethron hystrix Hensen |
15 |
Leptocylindrus minimus Gran |
16 |
Detonula delicatula (Peragallo) Pavillard |
17 |
Lauderia minimus Gran |
19 |
Rhizosolenia cylindrus Cleve |
20 |
Rhizosolenia.stolterfothii H.Peragallo |
21 |
Rhizosolenia robusta Norman |
22 |
Rhizosoleni imbricata Brighhtwell |
23 |
Rhizosolenia styliformis Brightwell |
24 |
Leptocylindrus danicus |
25 |
Bacteriastrum hyalinum Lauder |
26 |
Bacteriastrum varians Lauder |
27 |
Chaetoceros peruvianus Brightwell |
28 |
Chaetoceros lorenzianus Grunow |
29 |
Chaetoceros didymus Ehrenberg |
30 |
Eucampia zoodiacus Ehrenberg |
31 |
Eucampia cornuta (cleve) Grunow |
32 |
Bellerochea malleus (Brightwell ) Van Heurck |
33 |
Ditylum brighwellii (West) Grunow |
34 |
Ditylum sol Grunow |
35 |
Triceratium favus Ehrenberg |
36 |
Triceratium.roberisianum Greville |
27 |
Triceratium reticulatum Ehrenberg |
28 |
Odontella sinensis Greville |
39 |
Odontella mobiliensis Bailey |
40 |
Biddulphia heteroceros Grunow |
41 |
Hemiaulus sinensis Greville |
42 |
Hemidiscus hardmannianus (Greville) Mann |
43 |
Rhabdonema mirificum W.Smith |
44 |
Grammatophora undulata Ehrenberg |
45 |
Climacosphenia moniligera Ehrenberg |
46 |
Climacosphenia elongata Bailey |
47 |
Rhaphoneis amphiceros Ehrenberg |
48 |
Rhaphoneis discoides Subramanyan |
49 |
Thalassionema nitzschioides Grunow |
50 |
Thalassiothrix longissima Cleve and Grunow |
51 |
Thalassionema frauenfildii Grunow |
52 |
Cocconeis littoralis Subrahmanyan |
53 |
Achnanthes stromii Hustedt |
Table (2):
Dinoflagellate species identified during the study.
No |
Name of the Dinoflagellate Species |
|---|---|
1 |
Prorocentrum micans Ehrenberg |
2 |
Prorocentrum lima Stein |
3 |
Prorocentrum maximum Schiller |
4 |
Exuviaella Cienkowski |
5 |
Prorocentrum compressum Barley and Ostenfeld |
6 |
Gonyaulax spinifera |
7 |
Tripos cephalotus (Lemmermann) |
8 |
Tripos furca (Ehrenberg) Claparede and Lachmann |
9 |
Oxytoxum turbo Kofoid |
10 |
Dinophysis caudate |
11 |
Noctiluca scintillans |
12 |
Guinardia flaccida |
13 |
Protoperidinium species |
14 |
Gymnodinium species |
15 |
Cochlodinium species |
16 |
Protoperidinium species |
17 |
Pyrocystis species |
18 |
Oxytoxum species |
Table (3):
Microalgal population densities at different months.
Month |
Number of Dinoflagellate cells/L |
Number of Diatom cells/L |
Total Number of Microalgal cells/L |
|---|---|---|---|
October |
1282 |
13418 |
14700 |
November |
968 |
7390 |
8358 |
December |
634 |
7198 |
7832 |
January |
1530 |
9887 |
11418 |
February |
2170 |
15512 |
17682 |
March |
1962 |
13344 |
15306 |
April |
2288 |
16303 |
18592 |
May |
3356 |
11712 |
15068 |
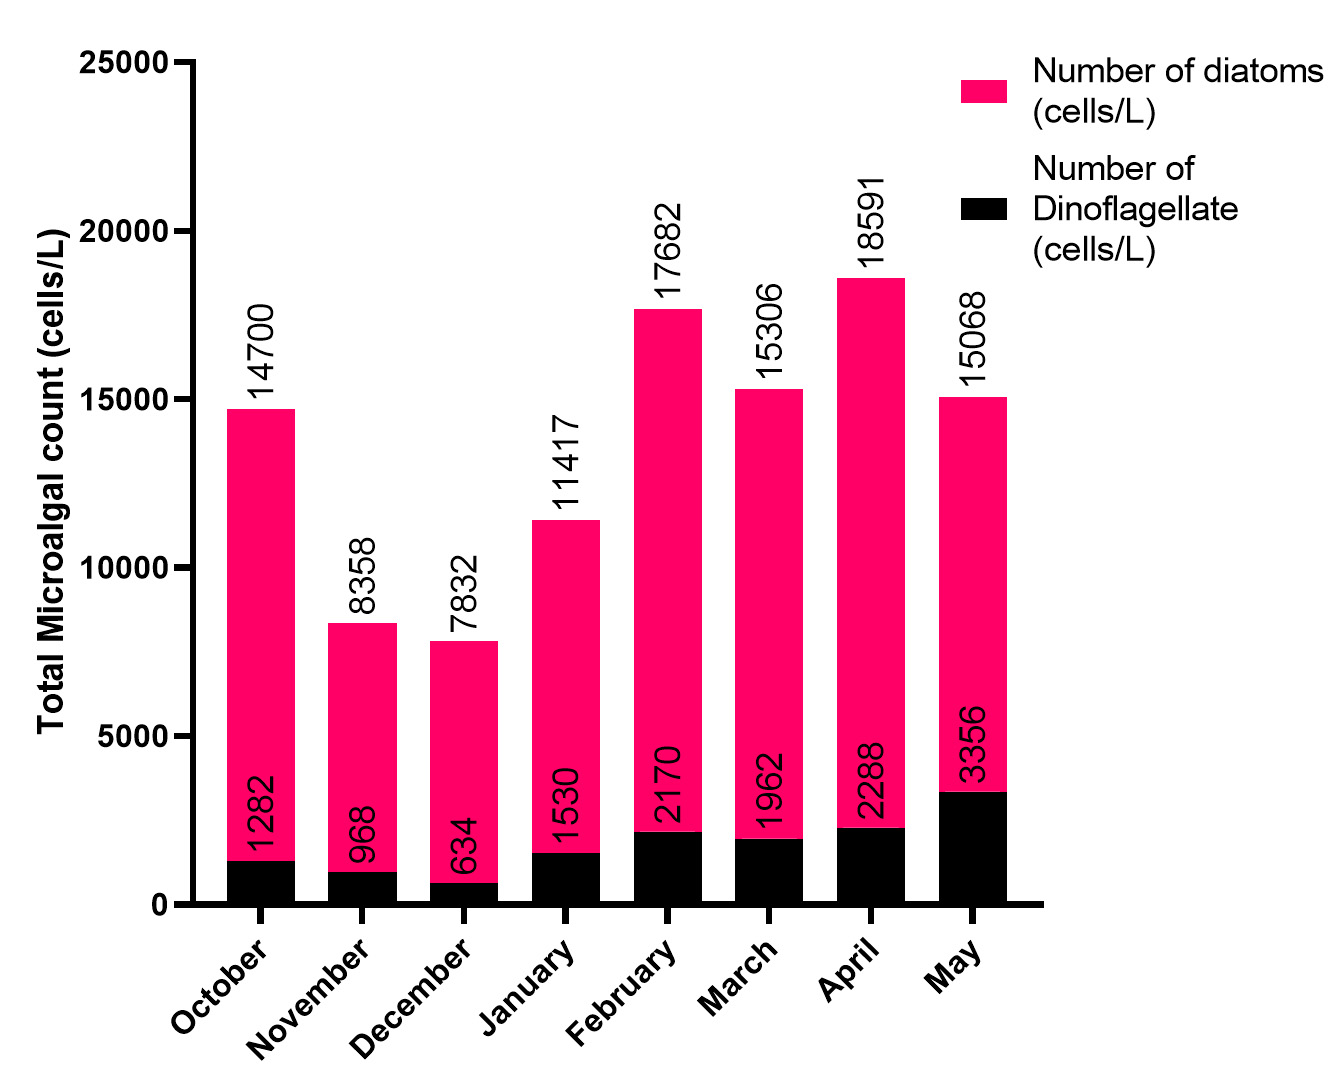
Fig. 2. Total diatoms and dinoflagellate cells observed in the study.
Identification of toxic species
The population of the predominant toxic species was shown in the Fig. 3. Counts of Tripos furca ranged between 56cells/L to 269 cells/L, Prorocentrum lima between 64 cells/L to 230 cells/L, Noctiluca scintillans between 64 cells/L to 308 cells/L and Dinophysis caudata between 82 to 368. The total toxic microalgae species were found to be higher on April (1171 cells/L) and lower on December (288 cells/L).
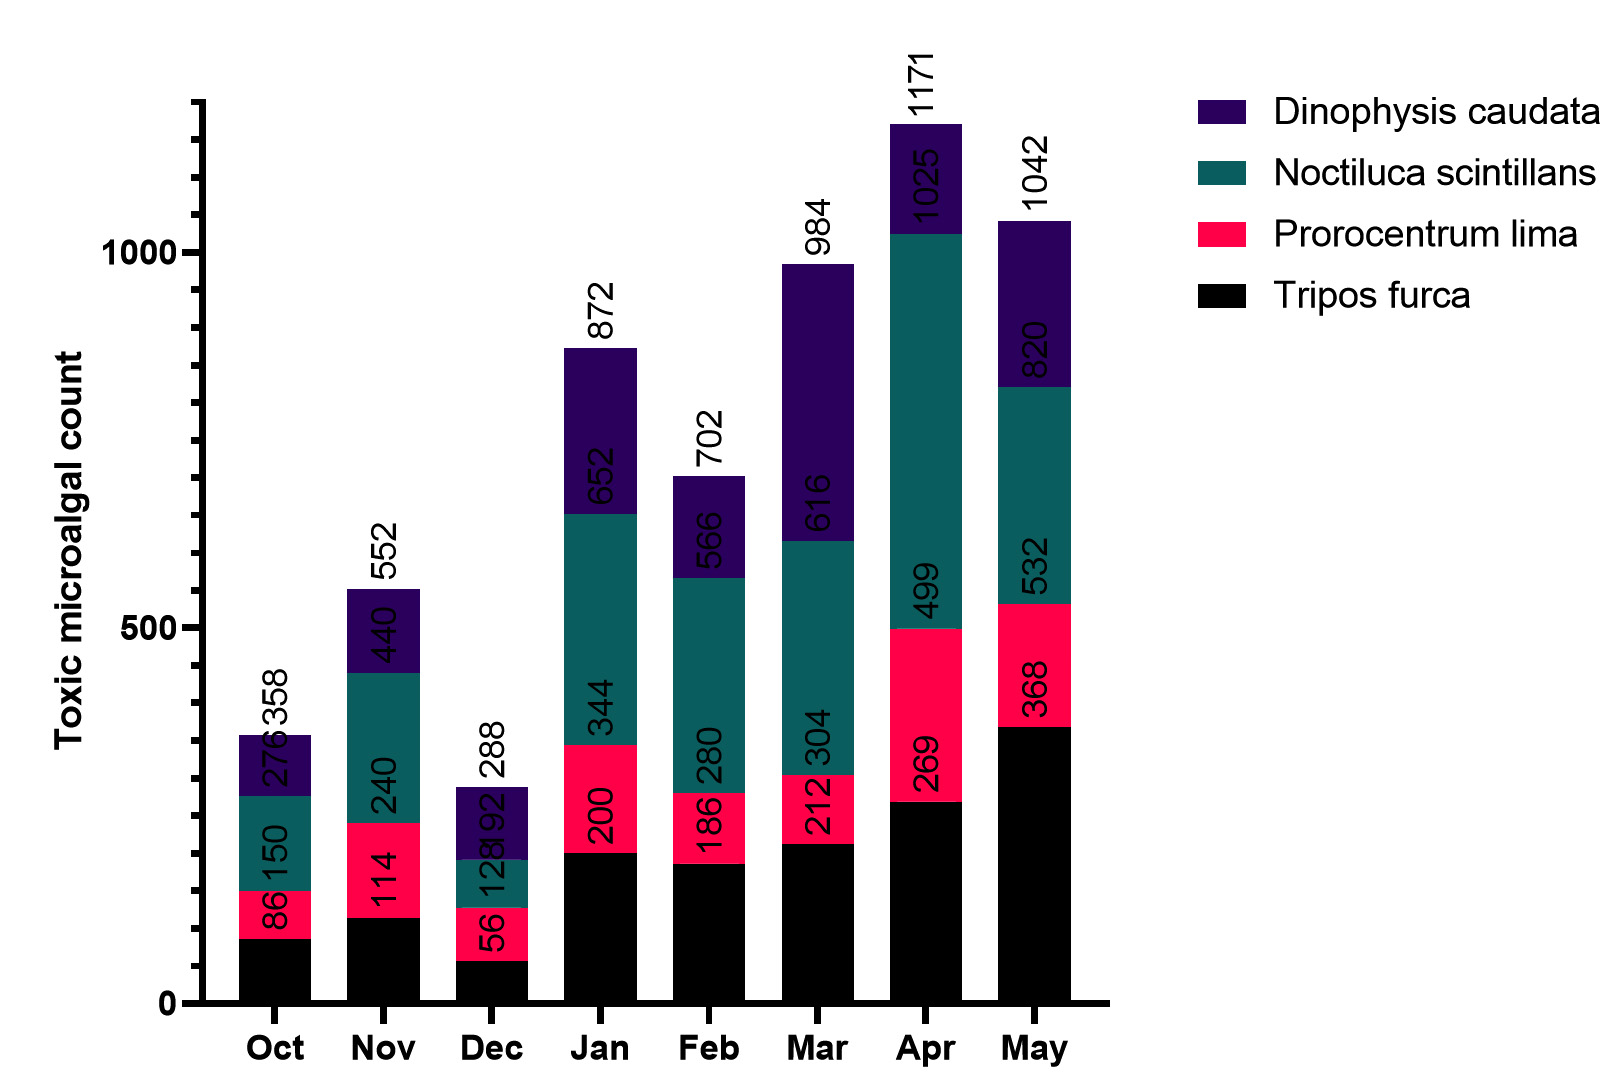
Fig. 3. Variation in population of the predominant dinoflagellate species.
Physical parameters
Physical parameters like temperature, salinity and pH were observed on the study area during October to May and are presented in Table 4. The temperature was found to be higher (29.1°C) during the month of March and lower (26.1°C) in the month of December. The pH showed an early morning (9-10 am) maximum of 8. 00 during November and a minimum of 7.44 in February. The salinity ranged between 33.3 ppt during May and 29.9 ppt in the month of December.
Table (4):
Physical parameters of the seawater.
Month |
Salinity (ppt) |
pH |
Temperature (°C) |
|---|---|---|---|
October |
31.6 |
7.93 |
27.9 |
November |
30.2 |
8.00 |
27.0 |
December |
29.9 |
7.8 |
26.1 |
January |
31.33 |
7.82 |
27.0 |
February |
31.3 |
7.44 |
27.7 |
March |
33.1 |
7.92 |
29.1 |
April |
32.1 |
7.61 |
28.8 |
May |
33.3 |
7.58 |
28 |
Chemical parameters
Chemical parameters such as levels of oxygen, nitrite, nitrate, total nitrogen, inorganic phosphate, and reactive silicate were analysed (Table 5). The oxygen content showed a maximum (6.30 mg/L) during the month of November and minimum (3.41 mg/L) in the months October and January. The inorganic phosphate ranged between 1.9821 μ-mol/L and 0.991 μ-mol/L at December and February. Higher levels of reactive silicate (5.8122 μ mol/L) were observed during March and lower levels (3.121 μ-mol/L) in February. The nitrate showed a maximum (4.4212 μ-mol/L) during the month of October and minimum (2.0020 μ-mol/L) in the month of December. The total nitrogen level was higher (20.42 μ-mol/L) in October and lower (6.28 μ-mol/L) in January. The total phosphorus showed a maximum (5.1293 μ-mol/L) during the month of May and minimum (3.41 μ-mol/L) in the month May.
Table (5):
Chemical parameters of the seawater samples.
Month |
O2 Content (mg/l) |
Nitrite (μ mol/l) |
Nitrate (μ mol/l) |
Total Nitrogen (μ mol/l) |
Inorganic Phosphate (μ mol/l) |
Total Phosphorus (μ mol/l) |
Reactive Silicate (μ mol/l) |
|---|---|---|---|---|---|---|---|
October |
3.41 |
0.3012 |
4.4212 |
20.42 |
1.8121 |
3.8121 |
5.0923 |
November |
6.30 |
0.24138 |
2.8021 |
18.11 |
1.8121 |
3.41 |
4.1283 |
December |
4.4 |
0.1939 |
2.0020 |
12.8138 |
1.9821 |
4.1816 |
4.8127 |
January |
3.41 |
0.181 |
3.81 |
6.28 |
0.991 |
4.31 |
3.212 |
February |
4.82 |
0.181 |
3.8121 |
8.531 |
0.991 |
3.856 |
3.121 |
March |
4.21 |
0.6123 |
3.68621 |
12.31 |
1.0381 |
4.3313 |
5.8122 |
April |
5.15 |
0.8311 |
4.1891 |
8.978 |
1.1180 |
4.3212 |
4.004 |
May |
5.44 |
0.8190 |
4.2231 |
8.8702 |
1.2400 |
5.1293 |
5.7180 |
Correlation of total microalgae count with physicochemical properties
Correlation analysis between microalgal counts and physical parameters are presented in Table 6. Dinoflagellates showed a positive correlation with salinity (r = 0.848; p = 0.008), Diatoms showed positive correlation with temperature (r = 0.804; p = 0.016) and total microalgal densities were positively correlated with temperature (r = 0.825; p = 0.012). Scatterplot matrices showing correlation with physical parameters are shown in Fig. 4. Correlation analysis of microalgae count with oxygen, nitrite, nitrate, reactive silicate, total nitrogen and total phosphorus are presented in Table 7 and shown in Fig. 5. Dinoflagellates showed a positive correlation with nitrite (r = 0.752; p = 0.032) and total phosphorus (r = 0.734, p = 0.038). Diatoms showed a positive correlation with nitrate (r = 0.774, p = 0.024) and total microalgae population densities were positively correlated with nitrate concentration (r = 0.811, p = 0.15).
Table (6):
Correlation of algal count with physical parameters.
| Correlations | |||||||
|---|---|---|---|---|---|---|---|
| Temperature | pH | Salinity | Tot_Dinoflagellate | Tot_Diatoms | Microalgal_count | ||
| Temperature | Pearson Correlation | 1 | -.171 | .836** | .630 | .804* | .825* |
| Sig. (2-tailed) | .685 | .010 | .094 | .016 | .012 | ||
| N | 8 | 8 | 8 | 8 | 8 | 8 | |
| pH | Pearson Correlation | -.171 | 1 | -.275 | -.665 | -.561 | -.624 |
| Sig. (2-tailed) | .685 | .509 | .072 | .148 | .098 | ||
| N | 8 | 8 | 8 | 8 | 8 | 8 | |
| Salinity | Pearson Correlation | .836** | -.275 | 1 | .848** | .605 | .701 |
| Sig. (2-tailed) | .010 | .509 | .008 | .112 | .053 | ||
| N | 8 | 8 | 8 | 8 | 8 | 8 | |
| Tot_Dinoflagellate | Pearson Correlation | .630 | -.665 | .848** | 1 | .595 | .725* |
| Sig. (2-tailed) | .094 | .072 | .008 | .119 | .042 | ||
| N | 8 | 8 | 8 | 8 | 8 | 8 | |
| Tot_Diatoms | Pearson Correlation | .804* | -.561 | .605 | .595 | 1 | .985** |
| Sig. (2-tailed) | .016 | .148 | .112 | .119 | .000 | ||
| N | 8 | 8 | 8 | 8 | 8 | 8 | |
| Microalgal_count | Pearson Correlation | .825* | -.624 | .701 | .725* | .985** | 1 |
| Sig. (2-tailed) | .012 | .098 | .053 | .042 | .000 | ||
| N | 8 | 8 | 8 | 8 | 8 | 8 | |
**. Correlation is significant at the 0.01 level (2-tailed).
*. Correlation is significant at the 0.05 level (2-tailed).
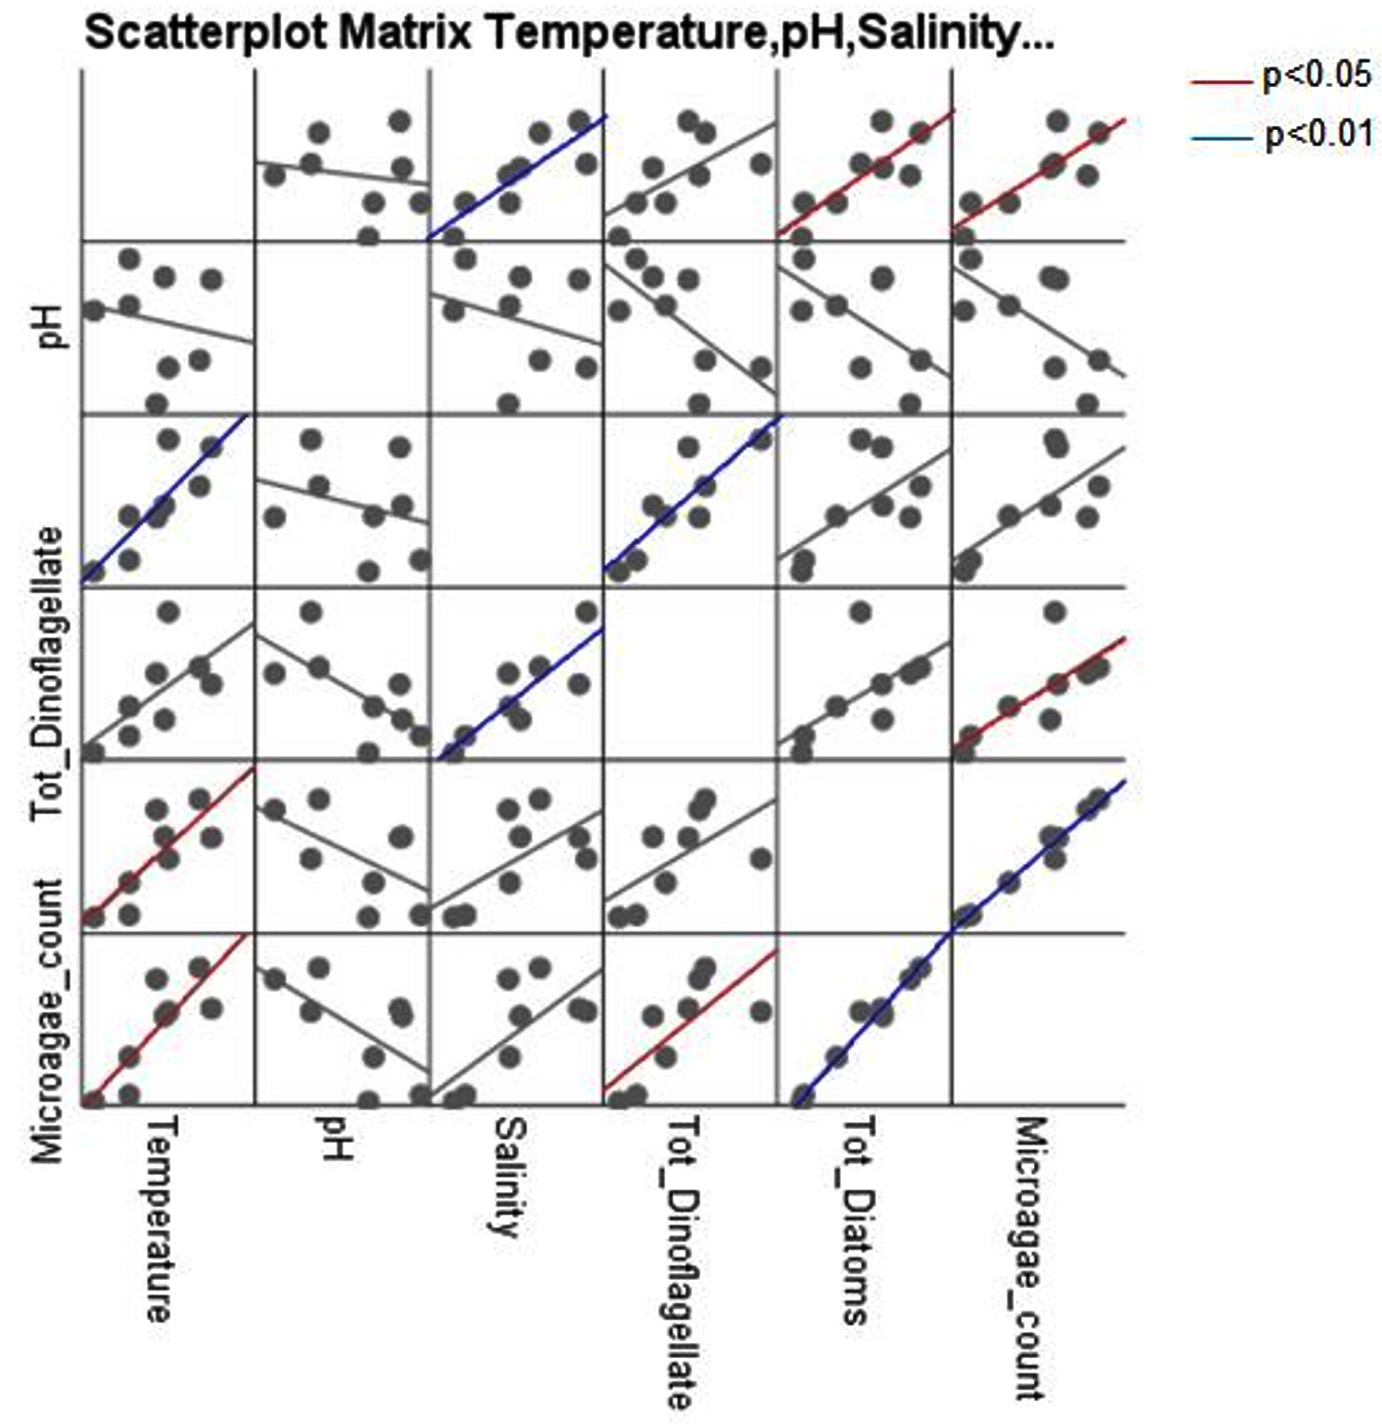
Fig. 4. Scatter plot between microalgal count and physical parameters of seawater.
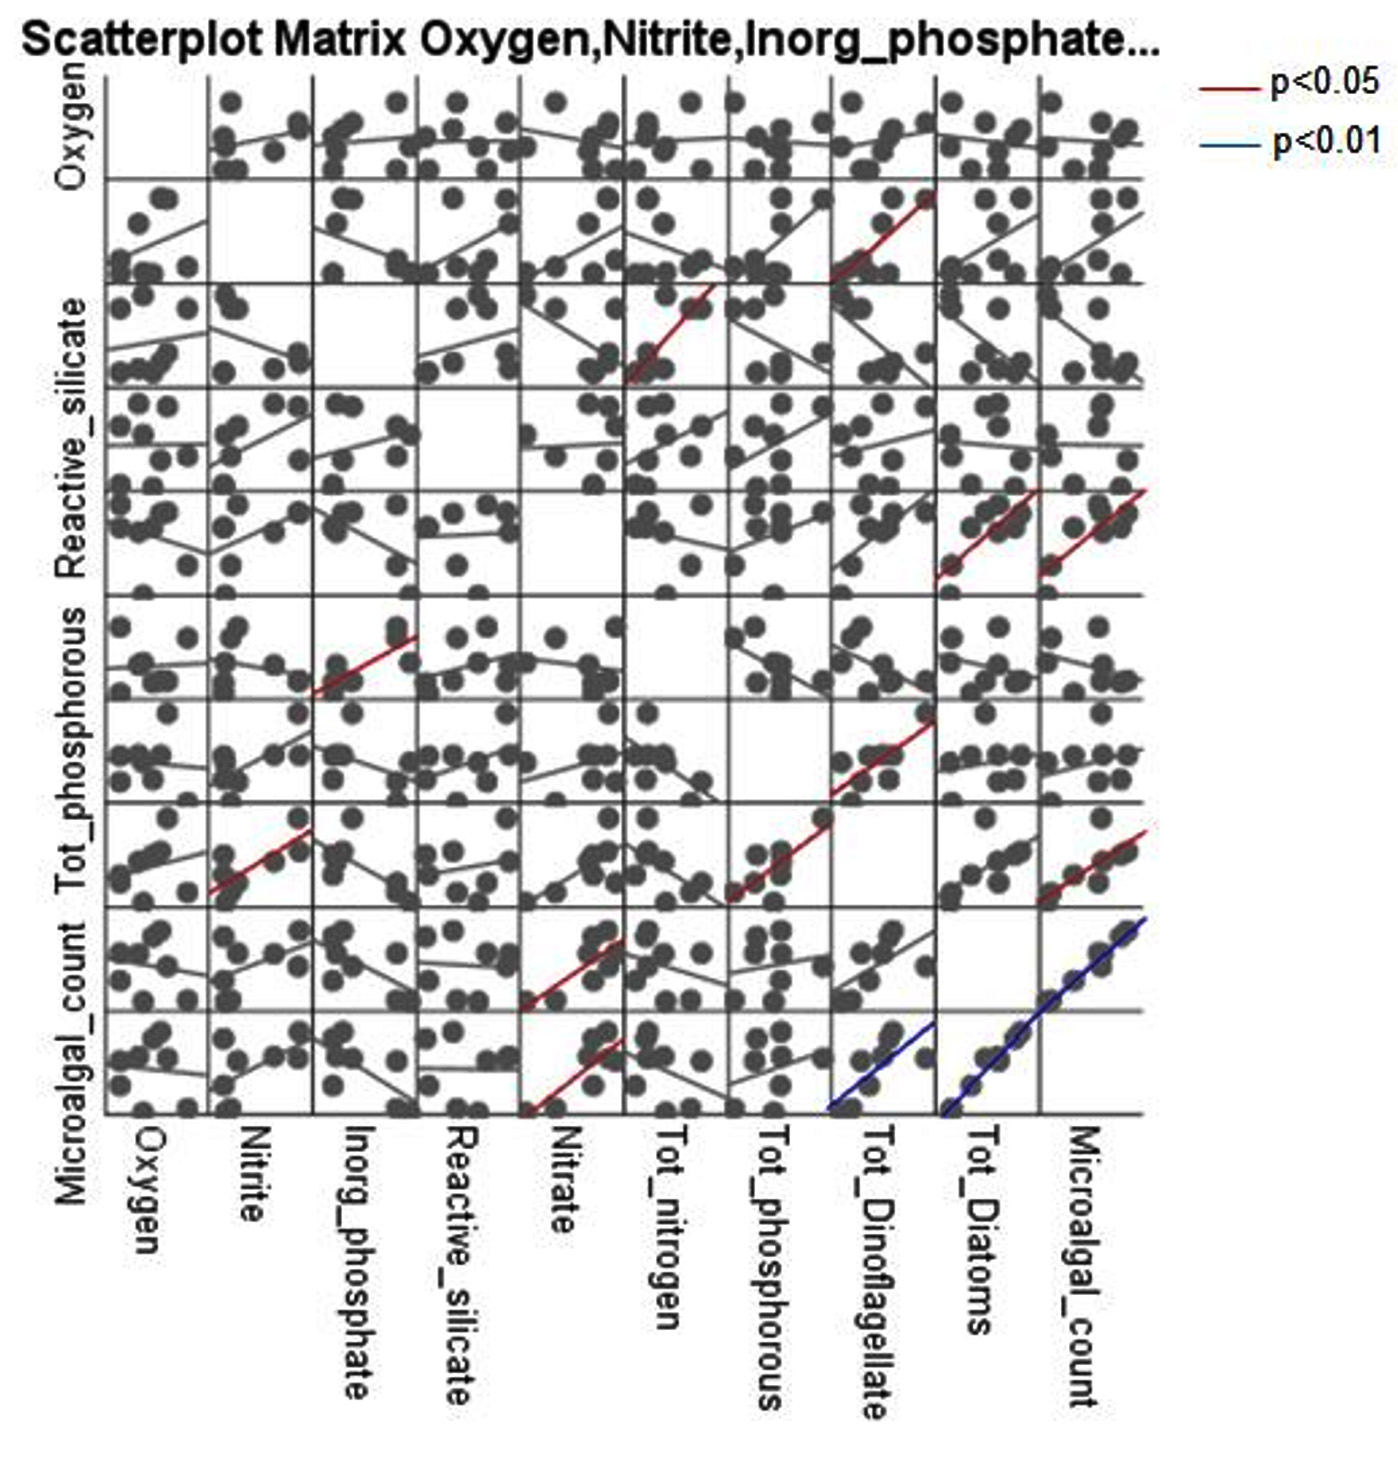
Fig. 5. Scatter plot between microalgal count and chemical parameters of seawater.
Harmful Algal Bloom (HAB) is found to be natural phenomena that have appeared throughout history. Due to factors like pollution with nutrients and climate change,24 the HAB events have been drastically increased in intensity, frequency, and geographic distribution, resulting in severe public health and economic impact. Recurrent global occurrence of HAB has greater impacts on fishery sources and the marine environments. The present study focuses on determining the microalgal diversity and blooms during Southwest and Northeast monsoon at Malabar Coast, Kerala, India. The Malabar Coast has two monsoons – South West during May/June to September and North East – November/December with a hot dry weather in between. A strong upwelling is regularly observed here during the summer.25 There are about half a million people involved with fisheries and the sea food industry directly and indirectly in the area. The annual fish harvest in the area has been estimated as 900 tones. There are more than 2000 coastal families directly depend on marine mussel culture which depends upon phytoplankton giving 1900 tons of farmed bivalves per annum.26
Table (7):
Correlation of microalgal counts with chemical parameters.
| Correlations | |||||||||||
|---|---|---|---|---|---|---|---|---|---|---|---|
| Oxygen | Nitrite | Inorg_phosphate | Reactive_silicate | Nitrate | Tot_nitrogen | Tot_phosphorous | Tot_Dinoflagellate | Tot_Diatoms | Microalgal_count | ||
| Oxygen | Pearson Correlation | 1 | .300 | .119 | .010 | -.247 | .053 | -.079 | .226 | -.151 | -.081 |
| Sig. (2-tailed) | .470 | .778 | .981 | .556 | .902 | .853 | .591 | .722 | .849 | ||
| N | 8 | 8 | 8 | 8 | 8 | 8 | 8 | 8 | 8 | 8 | |
| Nitrite | Pearson Correlation | .300 | 1 | -.364 | .524 | .494 | -.252 | .682 | .752* | .479 | .572 |
| Sig. (2-tailed) | .470 | .376 | .182 | .213 | .548 | .063 | .032 | .230 | .139 | ||
| N | 8 | 8 | 8 | 8 | 8 | 8 | 8 | 8 | 8 | 8 | |
| Inorg_phosphate | Pearson Correlation | .119 | -.364 | 1 | .270 | -.574 | .783* | -.427 | -.678 | -.626 | -.682 |
| Sig. (2-tailed) | .778 | .376 | .517 | .137 | .022 | .291 | .064 | .097 | .062 | ||
| N | 8 | 8 | 8 | 8 | 8 | 8 | 8 | 8 | 8 | 8 | |
| Reactive_silicate | Pearson Correlation | .010 | .524 | .270 | 1 | .051 | .365 | .442 | .213 | -.072 | -.016 |
| Sig. (2-tailed) | .981 | .182 | .517 | .905 | .374 | .273 | .613 | .866 | .970 | ||
| N | 8 | 8 | 8 | 8 | 8 | 8 | 8 | 8 | 8 | 8 | |
| Nitrate | Pearson Correlation | -.247 | .494 | -.574 | .051 | 1 | -.172 | .330 | .687 | .774* | .811* |
| Sig. (2-tailed) | .556 | .213 | .137 | .905 | .683 | .425 | .060 | .024 | .015 | ||
| N | 8 | 8 | 8 | 8 | 8 | 8 | 8 | 8 | 8 | 8 | |
| Tot_nitrogen | Pearson Correlation | .053 | -.252 | .783* | .365 | -.172 | 1 | -.612 | -.547 | -.266 | -.345 |
| Sig. (2-tailed) | .902 | .548 | .022 | .374 | .683 | .107 | .160 | .525 | .402 | ||
| N | 8 | 8 | 8 | 8 | 8 | 8 | 8 | 8 | 8 | 8 | |
| Tot_phosphorous | Pearson Correlation | -.079 | .682 | -.427 | .442 | .330 | -.612 | 1 | .734* | .174 | .307 |
| Sig. (2-tailed) | .853 | .063 | .291 | .273 | .425 | .107 | .038 | .680 | .460 | ||
| N | 8 | 8 | 8 | 8 | 8 | 8 | 8 | 8 | 8 | 8 | |
| Tot_Dinoflagellate | Pearson Correlation | .226 | .752* | -.678 | .213 | .687 | -.547 | .734* | 1 | .595 | .725* |
| Sig. (2-tailed) | .591 | .032 | .064 | .613 | .060 | .160 | .038 | .119 | .042 | ||
| N | 8 | 8 | 8 | 8 | 8 | 8 | 8 | 8 | 8 | 8 | |
| Tot_Diatoms | Pearson Correlation | -.151 | .479 | -.626 | -.072 | .774* | -.266 | .174 | .595 | 1 | .985** |
| Sig. (2-tailed) | .722 | .230 | .097 | .866 | .024 | .525 | .680 | .119 | .000 | ||
| N | 8 | 8 | 8 | 8 | 8 | 8 | 8 | 8 | 8 | 8 | |
| Microalgal_count | Pearson Correlation | -.081 | .572 | -.682 | -.016 | .811* | -.345 | .307 | .725* | .985** | 1 |
| Sig. (2-tailed) | .849 | .139 | .062 | .970 | .015 | .402 | .460 | .042 | .000 | ||
| N | 8 | 8 | 8 | 8 | 8 | 8 | 8 | 8 | 8 | 8 | |
**. Correlation is significant at the 0.01 level (2-tailed).
*. Correlation is significant at the 0.05 level (2-tailed).
A broad account of the occurrence, intensity, frequency, and geographical coverage of HAB in the exclusive economic zone (EEZ) of India were investigated by Padmakumar, Menon and Sanjeevan.27 Potential toxic microalgae documented from the Indian waters were found to be Dinophysis caudata, Prorocentrum lima, Coolia monotis, Tripos furca spp. and Gymnodinium spp. These species were the bloom forming organisms identified from the Indian waters. The bloom occurring dinoflagellate Noctiluca scintillans was the predominant and recurrently occurring species in the South Eastern Arabian Sea (SEAS) during the summer monsoon and green Noctiluca scintillans in the North Eastern Arabian Sea (NEAS) during the winter cooling. These observations correspond with the results of the present study.
Physicochemical properties of the seawater samples were analysed during two different monsoons. Physical properties analysed were salinity, pH and temperature and the chemical properties were oxygen, nitrite, nitrate, and total nitrogen, and inorganic phosphate, total phosphorus and reactive silicate. All the physicochemical parameters varied in different months. Pearson correlation coefficients were evaluated to identify the correlation of diatoms, dinoflagellates and total microalgal count with physicochemical properties. P-values < 0.05 were considered to be significant. Among then physical parameters, dinoflagellates showed a positive correlation with salinity, diatoms showed positive correlation with temperature and total microalgal population were positively correlated with temperature. Chemical parameters analysis showed for dinoflagellates a positive correlation with nitrite and total phosphorous. Diatoms showed positive correlation with nitrate and total microalgae population was positively correlated with nitrate content.
Similarly, a zero-dimensional numerical model was used by Zhou, Yu and Zhou,28 to verify the progression of microalgal blooms based on the coastal waters adjoining the Changjiang River estuary. The model showed a significant dynamic of the diatoms and dinoflagellate blooms. Analysis was carried out under different scenarios to analyse the effect of temperature, light intensity and nutrient source on the occurrence of microalgal blooms. The results indicate that temperature and light have gradual effects on their occurrence. Phosphorus stress is the most critical parameter controlling the occurrence of the microalgae blooms and nitrate plays a vital role in affecting the ratio of dinoflagellate blooms. The functions of various environmental factors like temperature, light and nutrients were evaluated under different scenario. It was observed that phosphate is the most critical parameter for the decline of diatom blooms and the occurrence of dinoflagellate bloom. Reactive silicate is still higher in seawaters and not a major factor determining the growth of the local diatom blooms.29
This is the first study on microalgal diversity on the Malabar coast and determined the correlation between physicochemical parameters and microalgal counts. Samples were collected from October to December (southwest and northeast monsoon). Total diatoms, dinoflagellates and microalgal population were identified.
Prevalence of predominant toxic species Dinophysis caudata, Noctiluca scintillans, Prorocentrum lima and Tripos furca on different months were estimated. Microalgal count was found to be higher on April and lower on December. Physicochemical parameters of the seawater samples were evaluated and their correlation with microalgae count was determined. Positive correlation was observed for temperature and nitrate content. This study brings better understanding of microalgal diversity and correlation of physicochemical properties on Malabar coastal areas.
ACKNOWLEDGMENTS
The authors are grateful to the Deanship of Scientific Research, Prince Sattam bin Abdulaziz University, Al-Kharj, Saudi Arabia for its support and encouragement in conducting this research and publishing this report.
CONFLICT OF INTEREST
The authors declare that there is no conflict of interest.
AUTHORS’ CONTRIBUTION
All authors listed have made a substantial, direct and intellectual contribution to the work, and approved it for publication.
FUNDING
None.
ETHICS STATEMENT
Not applicable.
AVAILABILITY OF DATA
All datasets generated or analyzed during this study are included in the manuscript.
- Tzanatos E, Moukas C, Koutsidi M. Mediterranean nekton traits: distribution, relationships and significance for marine ecology monitoring and management. Peer J. 2020;8:e8494.
Crossref - Trombetta T, Vidussi F, Roques C, Scotti M, Mostajir B. Marine Microbial Food Web Networks During Phytoplankton Bloom and Non-bloom Periods: Warming Favors Smaller Organism Interactions and Intensifies Trophic Cascade. Front Microbiol. 2020;23:11:502336.
Crossref - Marcellin-Gros R, Piganeau G, Stien D. Metabolomic insights into marine phytoplankton diversity. Mar Drugs. 2020;18(2):78.
Crossref - Metting FB. Biodiversity and application of microalgae. J Ind Microbiol Biotechnol. 1996;17(5-6):477-489.
Crossref - Benedetti M, Vecchi V, Barera S, Dall’Osto L. Biomass from microalgae: the potential of domestication towards sustainable biofactories. Microbial Cell Factories. 2018;17(1):173.
Crossref - Verfaillie A, Blockx J, Praveenkumar R, Thielemans W, Muylaert K. Harvesting of marine microalgae using cationic cellulose nanocrystals. Carbohydrate Polymers. 2020;240:116165.
Crossref - Berdalet E, Fleming LE, Gowen R, et al. Marine harmful algal blooms, human health and wellbeing: challenges and opportunities in the 21st century. J Mar Biol Assoc UK. 2016;96(1):61-91.
Crossref - Sandhya SV, Preetha K, Nair AV, Antony ML, Vijayan KK. Isolation, characterisation and phylogenetic diversity of culturable bacteria associated with marine microalgae from saline habitats of south India. Aquat Microb Ecol. 2017;79(1):21-30.
Crossref - Curran MC, Richlen ML. Harmful Algal Blooms (HABs): Track them like a scientist. Science Activities. 2019;56(3):77-87.
- Wells ML, Trainer VL, Smayda TJ, et al. Harmful algal blooms and climate change: Learning from the past and present to forecast the future. Harmful Algae. 2015;49:68-93.
Crossref - Shumway SE, Burkholder JM, Morton SL. Harmful Algal Blooms. A Compendium Desk Reference. First edition. John Wiley & Sons Ltd. 2018:18.
Crossref - Hallegraeff GM. Harmful algal blooms: a global overview. In: Hallegraeff GM, Anderson DM, Cembella AD (eds) Manual on harmful marine microalgae. IOC-UNESCO. Paris. 2003;11, 2nd edn.:25-49.
- Anderson DM. Approaches to monitoring, control and management of harmful algal blooms (HABs). Ocean & Coastal Management. 2009;52(7):342-347.
Crossref - Doucette GJ, Medlin LK, McCarron P, Hess P. Detection and Surveillance of Harmful Algal Bloom Species and Toxins, in: Harmful Algal Blooms. Wiley Online Library. 2018;39-114.
Crossref - National Research Council (US) Committee on the Ocean’s Role in Human Health. From Monsoons to Microbes: Understanding the Ocean’s Role in Human Health. Washington (DC): National Academies Press (US). 1999; 3, Harmful Algal Blooms. Available from: https://www.ncbi.nlm.nih.gov/books/NBK230692/
- Backer LC, McGillicuddy, D. J. Harmful Algal Blooms: At the Interface Between Coastal Oceanography and Human Health. Oceanography. 2006;19(2):94-106.
Crossref - Nguyen HVN, Smith ME, Swoboda HD. Shellfish Toxicity. [Updated 2020 Jul 21]. Treasure Island (FL): StatPearls Publishing; 2021. https://www.ncbi.nlm.nih.gov/books/NBK470225/
- Gokul EA, Shanmugam P. An optical system for detecting and describing major algal blooms in coastal and oceanic waters around India. J Geophys Res Ocean. 2016;121(6):4097-4127.
Crossref - Stedinger KA, Tangen K. Dinoglagellates. C.R. Tomas (ed.,) Identifying marine phytoplankton, Acaad. Press, St. Petersburg, FL, 1997:387-584.
Crossref - Santhanam R, Ramanathan N, Venkataramanujam K, Jegatheesan G. Phytoplankton of The Indian Seas, 1985;60-120.
- Subranmanian A. Noxious dinoflagellates in Indian waters In Toxic Dinoflagellates, edited by D M Anderson, A W White, and D G Baden New York, USA: Elsevier (Proceedings of the third International Conference, St. Andrews, New Brunswick, Canada, 8-12 June 1985). 1986:525-528.
- Guillard RRL. Culture of phytoplankton for feeding marine invertebrates. In Smith W.L., Chanley M.H (Eds.) Culture of Marine Invertebrate Animals. Plenum Press, New York, USA. 1975:26-60.
Crossref - Manual on Harmful Marine Microalgae. Hallegraeff GM, Anderson DM., Cembella AD. (Eds) IOC Manuals and Guides No. 33. UNESCO 1995:75.
- Hallegraeff GM, Anderson DM, Belin C, et al. Perceived global increase in algal blooms is attributable to intensified monitoring and emerging bloom impacts. Commun Earth Environ. 2021;2(1):117.
Crossref - D’Silva MS, Anil AC, Naik RK, D’Costa PM. Algal blooms: A perspective from the coasts of India. Nat Hazards. 2012;63(2):1225-1253.
Crossref - Banerjee S. Socio-geographical importance of malabar coast , India. Int Res J Modern Eng Tech Sci. 2020;2(12):363-365.
- Padmakumar KB, Menon NR, Sanjeevan VN. Is Occurrence of Harmful Algal Blooms in the Exclusive Economic Zone of India on the Rise? Int J Oceanogr. 2012;2012:263946.
Crossref - Zhou ZX, Yu RC, Zhou MJ. Seasonal succession of microalgal blooms from diatoms to dinoflagellates in the East China Sea: A numerical simulation study. Ecol Modell. 2017;360:150-162.
Crossref - Kumar PS, Thomas J. Seasonal distribution and population dynamics of limnic microalgae and their association with physico-chemical parameters of river Noyyal through multivariate statistical analysis. Sci Rep. 2019;9(1):15021.
Crossref
© The Author(s) 2021. Open Access. This article is distributed under the terms of the Creative Commons Attribution 4.0 International License which permits unrestricted use, sharing, distribution, and reproduction in any medium, provided you give appropriate credit to the original author(s) and the source, provide a link to the Creative Commons license, and indicate if changes were made.