


ISSN: 0973-7510
E-ISSN: 2581-690X
Pavan Kumar Pindi1
Liquid biofertilizers have gained the prominence over chemical fertilizers and have become crucial agents to enhance the crop productivity in sustainable agricultural approaches. In view of the demand and scarcity of liquid biofertilizer supply an attempt was made to formulate a liquid nutrient media with bioprocess variables in scalable laboratory batch fermentation bioprocess mode. In the current study, a statistical modeling with Response Surface Methodology (RSM) was simulated and scrutinized the process variables. The best optimum conditions were sorted out and fitted to formulate a liquid medium composition. Finally, liquid biofertilizer nutrient media with bioprocess variables were optimized. The current liquid biofertilizer has guaranteed the enhanced cell mass and efficient metabolic strength of Rhizobium WG strains for their mass production at scalable laboratory batch bioprocess mode. The results of the current investigation revealed that about 33.330 g/L of cell mass with Rhizobium strain WG MH290562 was achieved by a minimum liquid medium formulation comprising of yeast extract at 3.2 g, 55.6 rpm, 35.7 °C, K2HPO4 (0.5 g), MgSO4 (0.1 g), and pH 7.0. Based on the scrutinized data, it is satisfied with the optimized liquid biofertilizer formulation in scalable laboratory batch fermentation bioprocess mode. Hence, we strongly recommend this liquid nutrient media as sustainable biofertilizer formulation for Rhizobium WG Strain. At the same time, ecological survivability and sustained longevity studies and field trials are under progress.
Statistical Modeling, Rhizobium, Response Surface Methodology (RSM), Liquid Biofertilizer, Media Formulation
To boost the output of agricultural crops, it has long been customary to provide manure or fertilizers.1,2 Following the Second World War, farmers began to use chemical fertilizers more often and carelessly.3,4 The soil’s health was seriously threatened by the incorrect, indiscriminate application of fertilizers.5 To repair the land system, revitalization is necessary. The usage of conventional fertilizers and insecticides is intended to be reduced through the adoption of sustainable agricultural methods.6 Produce from agriculture is a dependent component that depends on synchronized environmental and agricultural activities. The use of bio-fertilizers sustainably has become more popular. However, in India, the use of biofertilizers is still in its infancy. It is anticipated that employing biofertilizers will be impossible without massive grassroots promotion of their use.
Rhizobium inoculants are prominent due to their unique ability to be used as biofertilizers for the legume crop.7 Rhizobium sp. is an effective and potent rhizobacterium for legumes by their Nitrogen fixing ability, and it also enables plants to grow on their own even in soils with low levels of nitrogen. It is more environmentally safe than chemical fertilizers and can fix between 75 and 97 kg of nitrogen per hectare per season.8,9
In addition to fixing nitrogen using legumes, it has been demonstrated that rhizobia promotes the growth of non-leguminous plants by a mix of direct and indirect methods.10,11 The production of vitamins and phytohormones, the suppression of plant ethylene synthesis, the development of stress tolerance, and the improvement of nutrient uptake (including the mineralization of organic phosphorus and the solubilization of inorganic phosphorus) are examples of direct mechanisms. Conversely, indirect mechanisms include the reduction or prevention of pathogenic microorganisms’ harmful effects, primarily through the production of fungicidal and/or antibiotic compounds, competition for nutrients (e.g., siderophore production), and the development of systemic resistance to pathogens. Likewise by interacting with other advantageous microbes, rhizobia can indirectly aid in the growth of non-leguminous crops.12,13
Evaluation of the optimal conditions for the efficient and profitable deployment of the PGPR as inoculants in the rhizosphere of the host plant is necessary for the use of microbial resources for sustainable agriculture.14,15 Therefore, based on the geo-climatic circumstances, an effective Rhizobium species is to be isolated.16,17 Rhizobium should be added in excess to ensure that the legumes plant becomes infected with the inoculated rhizobium.
Production of liquid biofertilizer has increased and has become a key factor in crop yield magic.18 Understanding the needs of the bio-process is necessary for optimizing the media composition for the mass production of Rhizobium.19 Physical and environmental characteristics, as well as the fermentation medium used as an input, are the only factors that affect biomass production.20 The large yield of biomass was produced as a result of optimizing the cultural conditions. Cell proliferation is necessary for high cell density.21 Most advantageous cellular division occurs when the carbon, nitrogen, mineral, trace element, and other required inorganic nutrients are supplied properly. Therefore, it is crucial to optimize the media and cultural environments. Together with culture media, fermenter design is essential for microbial development because it controls important environmental parameters like temperature, pH, oxygen, and nutrients. Effective, scalable, and reliable microbial production is made possible by design features such impellers, baffles, spargers, and control systems that improve mixing, oxygen transmission, and condition stability.22-26
The medium’s composition must be properly designed for proper microbial proliferation along with effective metabolism.27 Without a doubt, interactions between medium constituents are possible. The real reasons of the effects of the compounds used, however, are unknown due to their complexity. For instance, acetate production brought on by rapid growth may have an impact on metabolism. This may be quite harmful, as shown by a strain of Escherichia coli’s production of interferon.28 According to Matsui et al., the presence of other chemicals, such as metallic ions, or the concentration of dissolved oxygen can have an impact on a culture’s ability to produce acetate.29 Similarly, culture conditions influences and may also have an impact on how it is consumed by the Rhizobium. For instance, various mediums have been suggested for rhizobia culture growth.30,31 The standard medium consists of several minerals such as potassium phosphate, magnesium sulfate, and sodium chloride, a source of nitrogen and growth factors (yeast extract), and a carbon source (mannitol, sucrose, or glycerol). Although slow growers’ development on mannitol varies, this sugar is the standard carbon source employed in standard laboratory media.32 Slow growers have shorter generation durations on glycerol, the most gratifying carbohydrate, compared to glucose, mannitol, galactose, or sucrose.33 Although yeast extract can be the only source of carbon and nitrogen,34 large quantities can distort cells35 and even limit Rhizobium trifolii development, which calcium can restore.36-38
The one-component-at-a-time layout method is time-consuming, necessitates more trial runs, and is also unable to examine how different components interact with one another.39 In this aspect, the RSM is a useful mathematical and statistical strategy that is frequently employed.40 These experimental layouts accurately identify the key components by analyzing the effects of factors on the response.
The goal of the response surface methodology (RSM) is to optimize the response.41 It is used to model and analyze processes in which the response (dependent variable) of interest is influenced by a number of other variables, or independent variables.42,43 Box and Wilson first used the term RSM to explore the connections between a response and numerous associated factors. The major principles and elements that make up RSM were reviewed.44-51
RSM uses factorial designs and regression analysis, which makes it possible to compare the most effective variables, perform simulations to track interactions, and select the variables that will result in the most appropriate response for a certain reaction. The RSM-developed model demonstrated high reliability and reproducibility, with predicted values closely aligning with experimental results.52-54
A second-order polynomial regression model (also known as a quadratic model or a response surface model). The standard form of the equation is: yi=a0+∑j=1najxij+∑j=1n∑k=jnajkxijxik+ϵiy sub i equals a sub 0 plus sum from j equals 1 to n of a sub j x sub i j end-sub plus sum from j equals 1 to n of sum from k equals j to n of a sub j k end-sub x sub i j end-sub x sub i k end-sub plus epsilon
sub i
yi = a0 + nj = 1ajxij + nj =1nk = jajkxijxik+ei
In simple: y i = ∑ao + ∑_i=1 ∑ai xi + ∑_i=1 _∑j=1 a ij xi xj in which yi the expected response used as a based variable; xi (i = 1, 2 and 3) and a ij (i = 1,2,3; j = i.3) were the model coefficient parameters.48 The coefficient parameters have been anticipated by using more than one linear regression analysis the usage of the least squares method.
Response surface methodology (RSM) approach was utilized in the current study to optimize the process parameters and determine the ideal circumstances for developing a suitable growth medium for the best growth of Rhizobium strains for their mass production.
Culture of Rhizobium
Soil samples collected from six (6) different unexplored forest rhizosphere soils viz., Khammam, Karimnagar, Medak, Mahabubnagar, Adilabad, and Warrangal were used as the source for Rhizobium. The soil collected, labeled and transported in zip-lock baggage to the laboratory. Microcosm experiments were accomplished via taking homogenous mixture of collected soils inside the pot and Vigna radiata (green gram) seeds are sown and irrigated at regular intervals of time period. The pots were now and then irrigated with sterile Hoagland’s solution. The same scenarios have been accompanied till the crop attained the inflorescence level. After 45 days of the plants were extricated and the rhizosphere soil was collected at the same time root nodules were collected into a Petri-plate. The collected root nodules were surface sterilized with the HgCl2. Finally, they were washed with the sterile Hoagland’s solution.
Root nodules are transferred to a sterile test tube with sterile YEM broth and allowed to squash with a sterile glass rod. About 0.1 ml of the content was spread on the YEM-Agar plate for the prospectus colonies. Triplicates were maintained and the plates were incubated in a BOD Incubator at 25 °C for 24-48 hrs.
Mucilaginous, raised, translucent, and white coloured Rhizobium colonies developed after 24-48 hours of incubation, and typical single colonies were re-streaked 3-4 times on fresh sterile YEMA containing Petri-plates to obtain axenic culture.
Additional experiments were conducted to confirm the isolation of the Rhizobium. Somasegaram and Hoben have addressed the design of confirmatory testing.55 These assays include the Benedicts test, the Congo Red test, the growth on alkaline medium, the growth on glucose peptone agar, and the ketolactose test. Following biochemical confirmation of Rhizobium, 16S rRNA gene sequencing is used for molecular identification. The NCBI Gene Bank received the data.
Yeast Extract Mannitol medium composition
Mannitol-positive Rhizobium species should be isolated and grown on Yeast Mannitol Agar medium (YEMA). YEMA is more effective when Congo-Red is added, and it aids in the isolation of Rhizobium by helping to distinguish it from other bacteria.56 By incorporating an additional 1% mannitol into the medium, it is also beneficial for the maintenance of Rhizobium species.57
Potassium Dihydrogen Phosphate (KH2PO4)
Potassium dihydrogen phosphate (KH2PO4) also known as Potassium phosphate monobasic or Monopotassium phosphate (MPP) is a popular biological buffer with a very high buffering capacity. KH2PO4 is a component of buffer solutions and is utilized as a buffering system, supplier of potassium, and phosphorus in culture medium. The presence of phosphate and sodium chloride salts effectively buffers the medium against pH fluctuations and osmotic alterations.
Yeast extract
An autolysate of yeast cells is known as yeast extract. It is a supplement used in the making of culture media. It offers Rhizobium an excellent supply of readily available amino acids, auxiliary growth regulators, and vitamin-B complex. It can be used in microbial media as a source of nourishment. Yeast extract promotes bacterial growth well enough and supplies nitrogenous nutrients.58-60 Furthermore, it serves as a hydrogen donor in the respiratory process and maintains the oxidation-reduction potential of the medium in a region that is favorable for growth Rhizobia.61
Mannitol, Magnesium Sulphate and Sodium Chloride
For Rhizobium, mannitol serves as a source of fermentable sugar alcohol, energy, and a preferred carbon source.56 Essential ions for the growth are provided by magnesium sulphate. The presence of salts of sodium chloride buffers the media against osmotic fluctuations.
Optimization of Growth Conditions: An Experimental Approach
Sodium chloride (NaCl), magnesium sulphate (MgSO4), dipotassium phosphate (K2HPO4), yeast extract, and mannitol, are the ingredients used to make YEM broth. Additionally Agitation and temperature are maintained, as shown in the Table 1.
Table (1):
Representing the optimization conditions
Run |
Yeast extract |
Mannitol |
K2HPO4 |
MgSO4 |
NaCl |
Agitation |
Temperature |
|---|---|---|---|---|---|---|---|
1 |
1.5 |
12.5 |
0.75 |
0.15 |
0.15 |
125 |
25 |
2 |
1.5 |
12.5 |
0.75 |
0.15 |
0.15 |
125 |
25 |
3 |
1 |
10 |
0.5 |
0.2 |
0.1 |
150 |
30 |
4 |
2 |
10 |
0.5 |
0.2 |
0.2 |
100 |
20 |
5 |
1 |
15 |
1 |
0.2 |
0.1 |
100 |
20 |
6 |
2 |
15 |
1 |
0.1 |
0.2 |
100 |
20 |
7 |
2 |
10 |
1 |
0.2 |
0.1 |
100 |
30 |
8 |
1 |
10 |
0.5 |
0.1 |
0.1 |
100 |
20 |
9 |
1 |
15 |
0.5 |
0.1 |
0.2 |
150 |
20 |
10 |
2 |
10 |
0.5 |
0.1 |
0.2 |
150 |
30 |
11 |
1.5 |
12.5 |
0.75 |
0.15 |
0.15 |
125 |
25 |
12 |
1.5 |
12.5 |
0.75 |
0.15 |
0.15 |
125 |
25 |
13 |
1 |
15 |
0.5 |
0.2 |
0.2 |
100 |
30 |
14 |
2 |
15 |
0.5 |
0.2 |
0.1 |
150 |
20 |
15 |
2 |
15 |
1 |
0.2 |
0.2 |
150 |
30 |
16 |
2 |
15 |
0.5 |
0.1 |
0.1 |
100 |
30 |
17 |
1 |
10 |
1 |
0.1 |
0.2 |
100 |
30 |
18 |
2 |
10 |
1 |
0.1 |
0.1 |
150 |
20 |
19 |
1 |
15 |
1 |
0.1 |
0.1 |
150 |
30 |
20 |
1 |
10 |
1 |
0.2 |
0.2 |
150 |
20 |
21 |
1.5 |
12.5 |
0.75 |
0.15 |
0.15 |
125 |
25 |
22 |
1.5 |
12.5 |
0.75 |
0.15 |
0.15 |
125 |
25 |
Estimation of biomass
One of the most crucial parameters for fermentation investigations is the biomass concentration. The simplest ways to accomplish this is to measure dry/wet weight and optical density at 600 nm.
Dry weight measurement
An empty aluminum foil was dried in the oven. Weigh and keep them in desiccators (anhydrous CaSO4). Shake the flask to uniformly distribute the culture. The culture broth is subjected to centrifugation at 10,000 g for 5 minutes to separate the cells from the culture broth. Scrape the cell paste out of the centrifuge tube and place it in a weighing pan after carefully discarding the clear supernatant. Add a few ml of water to the centrifuge tube to rinse it. Additionally, pour the rinse water into the weighing pan. After all the water has been drawn through, the culture’s wet weight is measured.
Dry the cell paste placed on the filter paper in an oven at about 60 °C, to prevent charring of cells and filter paper. Frequently weigh the filter paper combined with the cell paste, until the dry weight remains constant. Depending on the temperature of the oven and the thickness of the paste, it will take the sample anywhere between 6 and 24 hours to completely dry. Determine the weight difference and convert the dry weight to g/l.
Measuring the optical density at 600 nm (OD600)
Measuring turbidity is a common way to figure out how many bacteria are in a culture broth. A photometer, which measures a microbiological sample’s absorbance in a cuvette at a wavelength of 600 nm, is the primary instrument used to make this measurement. The OD600 value reflects an approximation of the number of microbial cells in a solution, according to literature references. It must be remembered that this figure is simply an estimate because light can also be scattered by dead cells and cell debris, which can result in greater OD levels.62-64 According to Matlock et al., when comparing various photometers, the optical configuration of each one results in somewhat varied OD values.65,66
Mass production
YEM broth was seeded with the Rhizobium isolate and the bioprocess parameters were evaluated with conventional OVAT Method.
Evaluation of nutritional parameters using OVAT method
According to Jeevan et al., the OVAT method (One-Variable-at-a-Time Method) was used to examine the effects of different nutrients like carbon and nitrogen sources at 0.5% levels while keeping the amounts of other elements constant.39
Statistical Optimization with DOE analysis
Statistica 7.0 (Statsoft, USA) was utilized for experimental design and data analysis. The model’s statistical analysis was performed using analysis of variance (ANOVA). Student’s t-test was used to determine the significance of the regression coefficients and their corresponding probability, p (t), while Fisher’s F-test was employed to determine the significance of the second order model equation. The multiple determination coefficients, R2, describe the variation explained by Model. Each variable’s quadratic model was represented as a 2D contour plot.
Simulation of the design
In order to determine the most significant variables affecting production, FrF2 design with a set of two-level factorial design with 18 experiments was employed.66-69 PBD model was checked by F – test and goodness of fit by multiple regression analysis.69-71 The design of experiments (DoE) methodology was used by applying the statistical analysis system R software version.
The second-order polynomial equation for the variables x1 and x2 is as follows:
y = β0 + β1x1 + β2x2 + β3x1x2 + β4x21 + β5x22 + ε
where Y is the response variable, β0 the constant, β1, β2, β3 were the coefficients for the linear, quadratic, and for the interaction effects, respectively, and Xi and Xj the coded level of variables xi and xj. Surfaces for all variables were plotted using the quadratic equation shown above.
Rhizobium sps. WG strain was successfully isolated and identified by the confirmatory assays and 16S rRNA gene sequence. After successful submission of 16S rRNA gene sequence data to NCBI, the accession number: MH290562 was allotted. The isolate was successfully deposited in culture center JCM (Japan Collection of Microorganisms) and MTCC (Microbial Type Culture Collection) with the accession numbers JCM 33803 and MTCC 12969, respectively.
Table (2):
Frf2 2 level fractional factorial design with 22 experiments as simulated and performed for the rhizobium mass production
Run |
Yeast extract |
Mannitol |
K2HPO4 |
MgSO4 |
NaCl |
Agitation |
Temperature |
Response (Biomass) |
|---|---|---|---|---|---|---|---|---|
1 |
1.5 |
12.5 |
0.75 |
0.15 |
0.15 |
125 |
25 |
9.3 |
2 |
1.5 |
12.5 |
0.75 |
0.15 |
0.15 |
125 |
25 |
9.6 |
3 |
1 |
10 |
0.5 |
0.2 |
0.1 |
150 |
30 |
9.45 |
4 |
2 |
10 |
0.5 |
0.2 |
0.2 |
100 |
20 |
9.52 |
5 |
1 |
15 |
1 |
0.2 |
0.1 |
100 |
20 |
9.56 |
6 |
2 |
15 |
1 |
0.1 |
0.2 |
100 |
20 |
12.34 |
7 |
2 |
10 |
1 |
0.2 |
0.1 |
100 |
30 |
12.5 |
8 |
1 |
10 |
0.5 |
0.1 |
0.1 |
100 |
20 |
7.5 |
9 |
1 |
15 |
0.5 |
0.1 |
0.2 |
150 |
20 |
12.1 |
10 |
2 |
10 |
0.5 |
0.1 |
0.2 |
150 |
30 |
8.6 |
11 |
1.5 |
12.5 |
0.75 |
0.15 |
0.15 |
125 |
25 |
9.4 |
12 |
1.5 |
12.5 |
0.75 |
0.15 |
0.15 |
125 |
25 |
12.03 |
13 |
1 |
15 |
0.5 |
0.2 |
0.2 |
100 |
30 |
7 |
14 |
2 |
15 |
0.5 |
0.2 |
0.1 |
150 |
20 |
7.3 |
15 |
2 |
15 |
1 |
0.2 |
0.2 |
150 |
30 |
11 |
16 |
2 |
15 |
0.5 |
0.1 |
0.1 |
100 |
30 |
12 |
17 |
1 |
10 |
1 |
0.1 |
0.2 |
100 |
30 |
6.3 |
18 |
2 |
10 |
1 |
0.1 |
0.1 |
150 |
20 |
10 |
19 |
1 |
15 |
1 |
0.1 |
0.1 |
150 |
30 |
7.6 |
20 |
1 |
10 |
1 |
0.2 |
0.2 |
150 |
20 |
12.5 |
21 |
1.5 |
12.5 |
0.75 |
0.15 |
0.15 |
125 |
25 |
8.9 |
22 |
1.5 |
12.5 |
0.75 |
0.15 |
0.15 |
125 |
25 |
12.6 |
Fractional factorial design with 2 level was simulated with 22 runs, the experiments were conducted and the response was calculated, tabulated in Table 2 and the design was allowed for DOE analysis with the linear regression equation.
The significant factors for the model are x1, Yeast extract, x6 Agitation and x7 Temperature. In order to stimulate a response we applied First order and second order polynomial equation as follows rsm (formula = Response ~ FO(x1, x6, x7) + TWI (x1, x6, x7), data = Design.1AA.coded.coded)
x1:x6 and x1:x7 are highly significant with P-value 0.002183 and 0.011225. The results are shown in Table 3.
Table (3):
Model fitted with linear regression equation rsm Model.19 (Coded model).
| Call: RSM (formula = Response ~ FO(x1, x6, x7) + TWI(x1, x6, x7), data = Design.1AA.coded.coded) | ||||
|---|---|---|---|---|
| Coefficients: | ||||
| Estimate | Std. Error | t-value | Pr(>|t|) | |
| (Intercept) | 9.86818 | 0.29972 | 32.9244 | 2.101e-15 *** |
| x1 | 0.70312 | 0.35146 | 2.0006 | 0.063873 |
| x6 | 0.11437 | 0.35146 | 0.3254 | 0.749349 |
| x7 | -0.39813 | 0.35146 | -1.1328 | 0.275086 |
| x1:x6 | -1.29688 | 0.35146 | -3.6900 | 0.002183 ** |
| x1:x7 | 1.01563 | 0.35146 | 2.8898 | 0.011225 * |
| x6:x7 | -0.25813 | 0.35146 | -0.7344 | 0.474003 |
Signif. codes: 0 ‘***’ 0.001 ‘**’ 0.01 ‘*’ 0.05 ‘.’ 0.1 ” 1
Multiple R-squared: 0.6503, Adjusted R-squared: 0.5105
F-statistic: 4.65 on 6 and 15 DF, P-value: 0.007316
Note: *** indicates statistically highly significant (Very strong evidence)
** indicates statistically very significant (strong evidence)
* indicates statistically significant (moderate evidence)
“.” Indicates marginally significant (weak evidence)
No symbol indicates statistically no significant.
Further analysis conducted and the regression coefficient or R2 was found to be 0.6503 that means this model can explain about 65% of the association for the response. Hence the model can be and was accepted.
It has been a strong evidence from the response surface plot i.e. Figure, where yeast extract and agitation have shown positive effect and resulted in 12 g/l of biomass production by Rhizobium sp. WG. Similar studies were performed by Gupta, he simulated RSM for biomass optimization Rhizobium leguminosarum strain BIHB 645, and obtained 2 g/L.71,72 Current findings are very better then compared to those of Kaur and Satyanarayna, who obtained 1.7 fold biomass production by Thermomucor indicae-seudaticae.73 The current results of RSM method experiments were more beneficial as compared to other studies of optimization of fermentation conditions for the generation of biomass.73-81
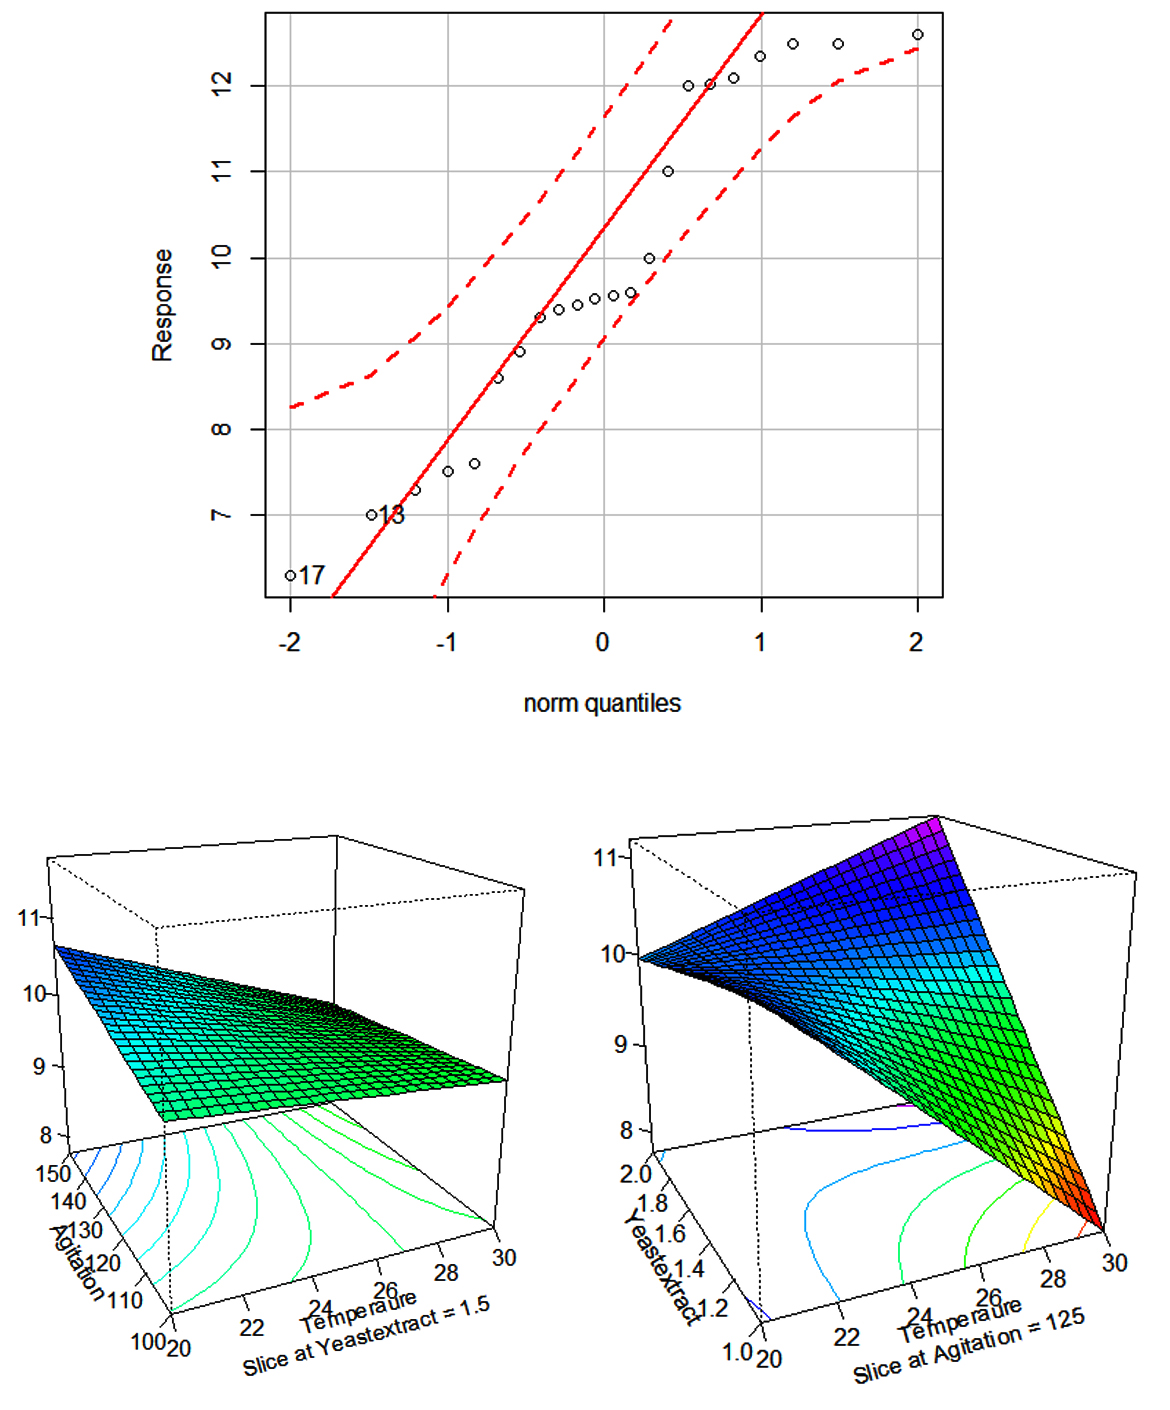
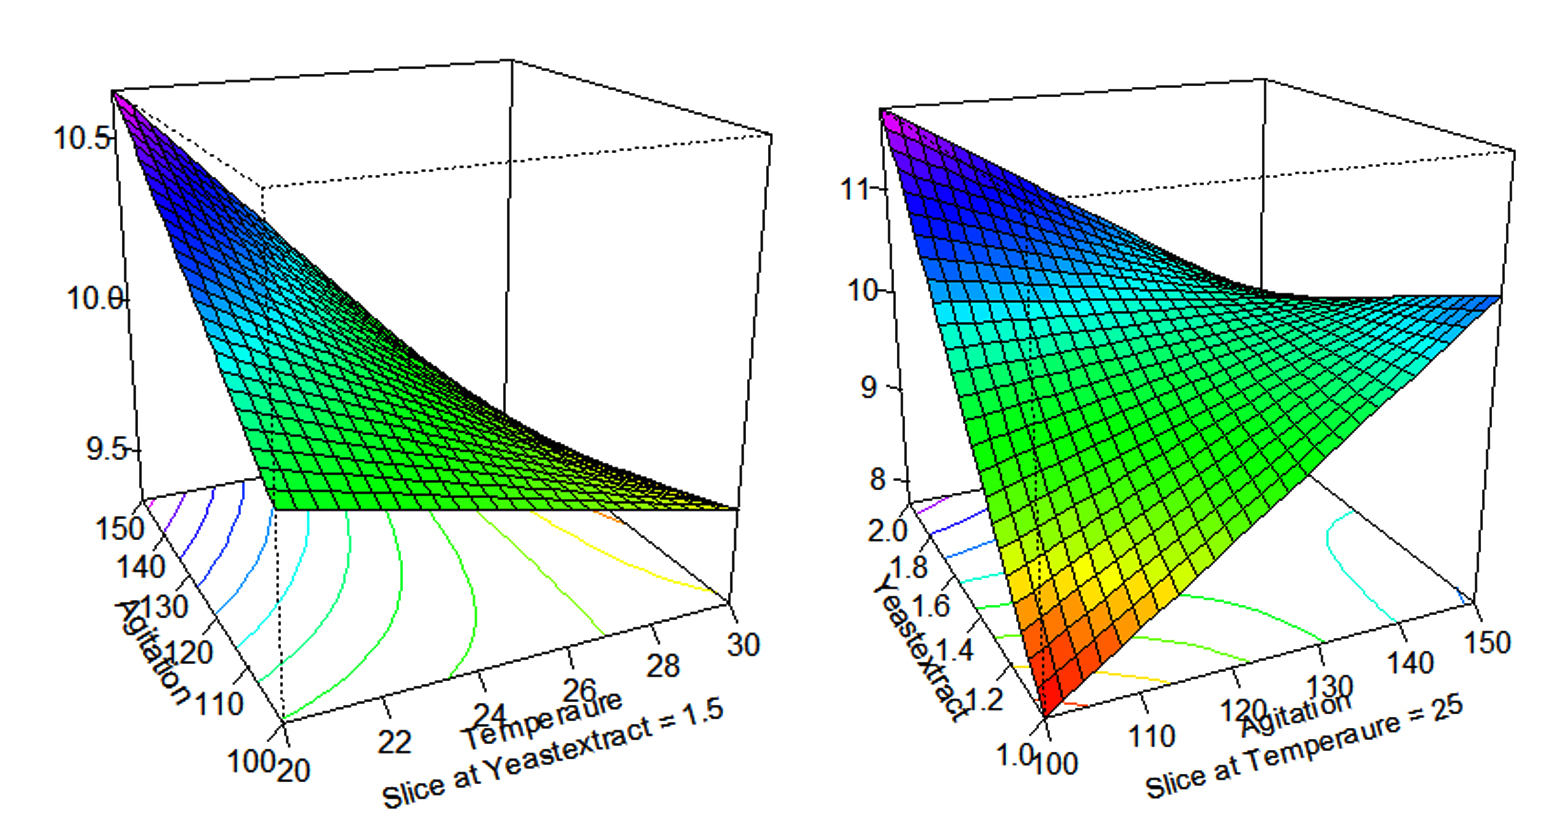
Figure. Response surface graph that representing the biomass production of Rhizobium sp. (WG) to parameters; Agitation, Temperature, and Yeast Extract
The present investigation on RSM analysis, from Table 4, reveals that yeast extract at 3.2 g, 55.6 rpm, 35.7 °C of temperature and K2HPO4 0.5 g, MgSO4 0.1 g and NaCl 0.1 g pH 7.0 could yield 33.330 g/L of biomass of Rhizobium sps. WG strain under defined laboratory conditions.
Table (4):
Steepest of accent was calculated by using the RSM model
| > Steepest of accent (rsmModel.19) | ||||||||
|---|---|---|---|---|---|---|---|---|
| #> Path of steepest ascent from ridge analysis | ||||||||
| #> | dist | x1 | x6 | x7 | Yeast Extract | Agitation | Temperature | yhat |
| #> 1 | 0.0 | 0.000 | 0.000 | 0.000 | | 1.5000 | 125.000 | 25.000 | | 9.868 |
| #> 2 | 0.5 | 0.450 | -0.211 | 0.050 | | 1.7250 | 119.725 | 25.250 | | 10.289 |
| #> 3 | 1.0 | 0.817 | -0.505 | 0.279 | | 1.9085 | 112.375 | 26.395 | | 11.077 |
| #> 4 | 1.5 | 1.166 | -0.793 | 0.513 | | 2.0830 | 105.175 | 27.565 | | 12.305 |
| #> 5 | 2.0 | 1.511 | -1.077 | 0.747 | | 2.2555 | 98.075 | 28.735 | | 13.975 |
| #> 6 | 2.5 | 1.854 | -1.361 | 0.982 | | 2.4270 | 90.975 | 29.910 | | 16.092 |
| #> 7 | 3.0 | 2.196 | -1.644 | 1.217 | | 2.5980 | 83.900 | 31.085 | | 18.652 |
| #> 8 | 3.5 | 2.536 | -1.926 | 1.451 | | 2.7680 | 76.850 | 32.255 | | 21.646 |
| #> 9 | 4.0 | 2.880 | -2.210 | 1.688 | | 2.9400 | 69.750 | 33.440 | | 25.123 |
| #> 10 | 4.5 | 3.220 | -2.492 | 1.922 | | 3.1100 | 62.700 | 34.610 | | 29.010 |
| #> 11 | 5.0 | 3.559 | -2.773 | 2.156 | | 3.2795 | 55.675 | 35.780 | | 33.330 |
| Response: Response | ||||||||
| Sum Sq | Df | F value | Pr(>F) | |||||
| FO(x1, x6, x7) | 10.656 | 3 | 1.7972 | 0.190921 | ||||
| TWI(x1, x6, x7) | 44.480 | 3 | 7.5021 | 0.002697 ** | ||||
| Residuals | 29.645 | 15 | ||||||
Signif. codes: 0 ‘***’ 0.001 ‘**’ 0.01 ‘*’ 0.05 ‘.’ 0.1 ” 1
Note: *** indicates statistically highly significant (Very strong evidence)
** indicates statistically very significant (strong evidence)
* indicates statistically significant (moderate evidence)
“.” Indicates marginally significant (weak evidence)
No symbol indicates statistically no significant.
When the necessary amounts of carbon, nitrogen, minerals, trace elements, and other required inorganic nutrients are provided, cellular division occurs most profitably. The media and cultural settings must therefore be optimized. Mannitol-positive Rhizobium species should be isolated and grown on YEMA medium plates.56 By incorporating an additional 1% mannitol into the medium, it is also beneficial for the maintenance of Rhizobium species.82-86 By having salts of phosphate and sodium chloride, the medium is well buffered against pH shifts and osmotic variations. Nitrogen-rich nutrients are provided by yeast extract. Energy is provided by mannitol, and necessary ions are provided by magnesium sulphate.56
The medium’s composition must be properly planned, intended to ensure microbial growth and effectiveness of metabolism.17 Without a doubt, interactions between medium constituents are possible. The true reasons behind the effects of the substances used, however, are unknown due to their complexity.
In order to compare the most effective factors, execute simulations, and choose the variables that will produce the best yield of Rhizobium, the response surface methodology (RSM) technique effectively used factorial designs and regression analysis. In the current study, the RSM technique was successfully used to optimize the process parameters and identify the perfect conditions for creating a viable growing medium for Rhizobium strains for their mass production. According to the current RSM analysis study, 33.330 g/L of biomass of the Rhizobium sps. WG strain could be produced using yeast extract 3.2 g, K2HPO4 0.5 g, MgSO4 0.1 g, and NaCl 0.1 g at pH 7.0 and 55.6 rpm at 35.7 °C. In order to produce a high yield of biomass of microorganisms intended to be utilized as bioinoculants, the culture conditions can be optimized with the use of RSM studies.
ACKNOWLEDGMENTS
The authors would like to thank Prof. G.N. Srinivas, Vice Chancellor, Palamuru University, Mahabubnagar, Telangana, for his continuous support.
CONFLICT OF INTEREST
The authors declare that there is no conflict of interest.
AUTHORS’ CONTRIBUTION
All authors listed have made a substantial, direct and intellectual contribution to the work, and approved it for publication.
FUNDING
None.
DATA AVAILABILITY
All datasets generated or analyzed during this study are included in the manuscript.
ETHICS STATEMENT
This article does not contain any studies on human participants or animals performed by any of the authors.
- Cassman KG. Ecological intensification of cereal production systems: yield potential, soil quality, and precision agriculture. Proc Natl Acad Sci U S A. 1999;96(11):5952-5959.
Crossref - Foley JA, Ramankutty N, Brauman KA, et al. Solutions for a cultivated planet. Nature. 2011;478(7369):337-342.
Crossref - Sharifuddin HA, Shahbuddin MF, Anuar AR, Zaharah AR, Samy J. Nature farming research in Malaysia: effect of organic amendment and EM on crop production. In: Proceedings of the 3rd International Conference on Kyusei Nature Farming; October 5, 1993; Santa Barbara, CA, USA. 1993:145-150.
- Ruttan VW. Sustainable growth in agricultural production. In: The Impact of Population Growth on Well-being in Developing Countries. 2013:139.
Crossref - Dwivedi BS, Shukla AK, Singh VK, Yadav RL. Improving nitrogen and phosphorus use efficiencies through inclusion of forage cowpea in the rice-wheat systems in the Indo-Gangetic Plains of India. Field Crops Res. 2003;80(3):167-193.
Crossref - Pimentel D, Burgess M. An Environmental, Energetic and Economic Comparison of Organic and Conventional Farming Systems. In: Pimentel D, Peshin R. (eds) Integrated Pest Management. Springer, Dordrecht.
Crossref - Burton JC. Rhizobium inoculants for developing countries. Tropical Agriculture. 1981;58(4):291-295.
- Paul EA, Kucey RM. Carbon flow in plant microbial associations. Science. 1981;213(4506):473-474.
Crossref - Zahran HH. Rhizobium-legume symbiosis and nitrogen fixation under severe conditions and in an arid climate. Microbiol Mol Biol Rev. 1999;63(4):968-989.
Crossref - Mehboob I, Naveed M, Zahir ZA. Rhizobial association with non-legumes: mechanisms and applications. Crit Rev Plant Sci. 2009;28(6):432-456.
Crossref - Mehboob I, Naveed M, Zahir ZA, Ashraf M. Potential of Rhizobia for Sustainable Production of Non-legumes. In: Ashraf M, Öztürk M., Ahmad, M, Aksoy A. (eds) Crop Production for Agricultural Improvement. Springer, Dordrecht.
Crossref - Antoun H, Beauchamp CJ, Goussard N, Chabot R, Lalande R. Potential of Rhizobium and Bradyrhizobium species as plant growth promoting rhizobacteria on non-legumes: effect on radishes (Raphanus sativus L.). Plant and Soil. 1998;204(1):57-67.
Crossref - Fahde S, Boughribil S, Sijilmassi B, Amri A. Rhizobia: a promising source of plant growth-promoting molecules and their non-legume interactions: examining applications and mechanisms. Agriculture. 2023;13(7):1279.
Crossref - Tilak KVBR, Ranganayaki N, Pal KK, et al. Diversity of plant growth and soil health supporting bacteria. Curr Sci. 2005;89(1):136-150.
- Panpatte DG, Shelat HN, Vyas RV, Jhala YK. Plant Growth Promoting Rhizobacteria-A Promising Tool for Eco-Friendly Agriculture. J Pure App Microbiol. 2014;8(6):4947-4959.
- Kumar S, Pindi PK. Data on host specificity and symbiotic association between indigenous Rhizobium BD1 strain and Vigna radiata (green gram). Data in Brief. 2021;39:107520.
Crossref - Kumar S, Pindi PK. Host Specificity and Symbiotic Association Between InDigenous Rhizobium Strain and Arachis hypog. Curr Trends Biotechnol Pharma. 2022;16(4):456-470.
- Satyanarayana SD. Liquid Microbial Consortium-A Potential Tool for Sustainable Soil Health. J Biofertil Biopestic. 2012;3(4).
Crossref - Chandra SJ, Pallavi P, Anuradha BS, Reddy SR. Optimization of bioprocess for enhanced production of alkaline protease by a Bacillus subtilis SHmIIIa through Plackett-Burman design. Afr J Microbiol Res. 2015;9(28):1738-1744.
Crossref - Willey JM, Sherwood L, Woolverton CJ. Prescott’s microbiology. New York: McGraw-Hill. 2014
- Nancib N, Branlant C, Boudrant J. Metabolic roles of peptone and yeast extract for the culture of a recombinant strain of Escherichia coli. J Ind Microbiol. 1991;8(3):165-169.
Crossref - Das HK. Textbook of biotechnology. John Wiley & Sons; 2007.
- Michael JP, Cha EC, Noel RK. Microbiology: Concepts and applications. 1993 Pelczar Jr MJ, Chan EC, Krieg NR. Microbiology: concepts and applications. 1993.
- Prescott LM, Harley JP, Klein D. Microbiology. 6th ed. McGraw Hill Publishers, USA.2005.
- Berenjian A, eds. Essentials in fermentation technology. Springer International Publishing. 2019.
Crossref - Martinez-Espinosa RM, eds. New Advances on Fermentation Processes. BoD-Books on Demand. 2020.
Crossref - Meyer HP, Leist C, Fiechter A. Acetate formation in continuous culture of Escherichia coli K12 D1 on defined and complex media. J Biotechnol. 1984;1(5-6):355-358.
Crossref - Reiling HE, Laurila H, Fiechter A. Mass culture of Escherichia coli: Medium development for low and high density cultivation of Escherichia coli B/r in minimal and complex media. J Biotechnol. 1985;2(3-4):191-206.
Crossref - Matsui T, Yokota H, Sato S, Mukataka S, Takahashi J. Pressurized culture of Escherichia coli for a high concentration. Agric Biol Chem. 1989;53(8):2115-2120.
Crossref - Burton JC. Rhizobium species. In: Peppler HJ, Perlman D eds. Microbial technology. Academic Press. 1979;1:29-58.
Crossref - Weaver RW, Frederick LR. Rhizobium. Methods of Soil Analysis: Part 2 Chemical and Microbiological Properties. Agronomy monograph. 1982;9:1043-1070.
Crossref - Burton JC. Legume inoculant production manual. University of Hawaii, Department of Agronomy and Soil Science, College of Tropical Agriculture and Human Resources. 1984.
- Sherwood MT. Improved synthetic medium for the growth of Rhizobium. J Appl Microbiol. 1970;33(4):708-713.
Crossref - Arias A, Martinez-Drets G. Glycerol metabolism in Rhizobium. Can J Microbiol. 1976;22(2):150-153.
Crossref - Meade J, Higgins P, O’gara F. Production and storage of Rhizobium leguminosarum cell concentrates for use as inoculants. J Appl Bacteriol. 1985;58(5):517-524.
Crossref - Skinner FA, Roughley RJ, CHANDLER MR. Effect of yeast extract concentration on viability and cell distortion in Rhizobium spp. J Appl Microbiol. 1977 Oct 1;43(2):287-297.
Crossref - Bissonnette N, Lalande R, Bordeleau LM. Large-scale production of Rhizobium meliloti on whey. Appl Environ Microbiol. 1986;52(4):838-841.
Crossref - Zhang Y, Ku YS, Cheung TY, et al. Challenges to rhizobial adaptability in a changing climate: Genetic engineering solutions for stress tolerance. Microbiol Res 2024;288:127886.
Crossref - Kaur J. Bacterial inoculants for rhizosphere engineering: Applications, current aspects, and challenges. In: Dubey RC, Kumar P. Rhizosphere Engineering. 2022:129-150.
Crossref - Chandra SJ, Pallavi P, Anuradha BS, Reddy SR. Optimization of bioprocess for enhanced production of alkaline protease by a Bacillus subtilis SHmIIIa through Plackett-Burman design. Afr J Microbiol Res. 2015;9(28):1738-44.
Crossref - Ghosh V, Lonhare A. Response Surface Methodology: A Statistical Tool to Optimize Process Parameters (Quantitative Data) to Maximize the Microbial Biomass and Their Bioactive Metabolites. In: Sahu AK, Raut RD, Raja R, Sahu AK, Sahu NK eds. Industrial and Manufacturing Designs: Quantitative and Qualitative Analysis. Scrivener Publishing. 2024:139-171.
Crossref - Breig SJM, Luti KJK. Response surface methodology: A review on its applications and challenges in microbial cultures. Materials Today: Proceedings. 2021;42(Part 5):2277-2284.
Crossref - Latha S, Sivaranjani G, Dhanasekaran D. Response surface methodology: A non-conventional statistical tool to maximize the throughput of Streptomyces species biomass and their bioactive metabolites. Crit Rev Microbiol. 2017;43(5):567-82.
Crossref - Plackett RL, Burman JP. The design of optimum multifactorial experiments. Biometrika. 1946;33(4):305-325.
Crossref - Box GEP, Wilson KB. . On the Experimental Attainment of Optimum Conditions. In: Kotz S, Johnson NL (eds) Breakthroughs in Statistics. Springer Series in Statistics. Springer, New York, NY.
Crossref - Box GEP, Draper NR. Empirical model-building and response surfaces. John Wiley & Sons. 1987.
- Box GEP, Hunter WG, Hunter JS. Statistics for Experimenters, John Wiley & Sons. Inc., New York, NY. 1978;136.
- Cochran WG, Cox GM. Experimental designs.,(John Wiley & Sons: New York). London Sydney. 1957.
- Johnson NL, Leone FC, Johnson NL. Statistics and experimental design in engineering and the physical sciences. New York, London and Sydney: John Wiley & Sons Inc., 1964
- Hill W. Hunter. WG. A Review of Response Surface Methodology: A Literature Survey. Technometrics. 1966;8(4):571-590.
Crossref - Myers RH, Carter WH. Response surface techniques for dual response systems. Technometrics. 1973;15(2):301-317.
Crossref - Myers RH, Montgomery DC, Anderson-Cook CM. Response surface methodology: process and product optimization using designed experiments. John Wiley & Sons. 2016.
- Efetobor UJ, Onokwai AO, Onokpite E, Okonkwo UC. Response surface methodology application for the optimization of biogas yield from an anaerobic Co-digestion process. Environment. 2024;10:12:205-221.
Crossref - Maheswari C, Shankar S, Alexander SA, Ramani G, Maheswari P. Improving the Groundnut Oil Extraction Efficiency using RSM and Central Composite Design (CCD) Optimization Techniques. J Eng Sci Technol Rev. 2024;17(2):215-222.
Crossref - Khuri AI, Cornell JA (2nd eds). Response surfaces: designs and analyses. CRC press. 2018.
Crossref - Somasegaran P, Hoben HJ. Handbook for rhizobia: methods in legume-Rhizobium technology. Springer Science & Business Media. 2012.
- Rao NS. Soil microorganisms and plant growth. 1995.
- Gherna R, Pienta P, Cote R. ATCC catalogue of bacteria & bacteriophages. American Type Culture Collection, Rockville, Md. 1992. ISBN: 9780930009441.
- Chen J, Zhang Y, Du GC, Hua ZZ, Zhu Y. Biodegradation of polyvinyl alcohol by a mixed microbial culture. Enzyme Microb Technol. 2007;40(7):1686-1691.
Crossref - PF Stanbury, A Whitaker, SJ Hall. Principles of Fermentation Technology, 2nd Eds.
Crossref - Li Y, Ren N, Yang C, Li J, Li P. Molecular characterization and fermentative hydrogen production of a wild anaerobe in clostridium genus. Front Energy Power Eng China. 2007;1(4):403-407.
Crossref - Allen EK, Allen ON. Biochemical and symbiotic properties of the rhizobia. Bacteriol Rev. 1950;14(4):273-330.
Crossref - Janke SA, Fortnagel P, Bergmann R. Microbiological turbidimetry using standard photometers. Biospektrum. 1999;6:501-502.
- Eppendorf AG. OD600 Measurements Using Different Photometers. Eppendorf AG: Hamburg, Germany. 2015.
- Zapata A, Ramirez-Arcos S. A comparative study of McFarland turbidity standards and the Densimat photometer to determine bacterial cell density. Curr Microbiol. 2015;70(6):907-909.
Crossref - Matlock BC, Beringer RW, Ash DL, Allen MW, Page AF. Analyzing differences in Bacterial Optical Density Measurements between Spectrophotometers. 2011. https://static.igem.org/mediawiki/2018/0/0b/T–UCL–poster.pdf
- Gromping U. An algorithm for blocking regular fractional factorial 2-level designs with clear two-factor interactions. Comput Stat Data Anal. 2021;153:107059.
Crossref - Marget WM. Experimental designs for multiple responses with different models (Doctoral dissertation, Iowa State University) 2015. 2015. 10009258 https://dr.lib.iastate.edu/handle/20.500.12876/29125
- Hardianto A, Zakiyyah SN, Kusumaningtyas P, Prabowo S, Hartati YW. Identification of Influential Factors in the Development of Modified Screen-printed Carbon Electrode in the DNA-based Electrochemical Biosensor Using the Design of Experiment. Sensors & Materials. 2023;35(12):4235.
Crossref - Deconinck E, Coomans D, Heyden YV. Exploration of linear modelling techniques and their combination with multivariate adaptive regression splines to predict gastro-intestinal absorption of drugs. J Phar Biomed Anal. 2007;43(1):119-130.
Crossref - Deconinck E, Ates H, Callebaut N, Van Gyseghem E, Vander Heyden Y. Evaluation of chromatographic descriptors for the prediction of gastro-intestinal absorption of drugs. J Chromatogr A. 2007;1138(1-2):190-202.
Crossref - Gupta R. Polyphasic characterization and optimization of growth conditions for high cell density batch cultivation of Rhizobium leguminosarum using response surface methodology (doctoral dissertation, csir-ihbt) 2012. https://ihbt.csircentral.net/98/1/reporttext.pdf
- Kaur P, Satyanarayana T. Production of cell-bound phytase by Pichia anomala in an economical cane molasses medium: optimization using statistical tools. Process Biochem. 2005;40(9):3095-3102.
Crossref - Anvari M, Khayati G, Rostami S. Optimisation of medium composition for probiotic biomass production using response surface methodology. J Dairy Res. 2014;81(1):59-64.
Crossref - Bardhan P, Baruah J, Raj GB, Kalita E, Mandal M. Optimization of culture conditions for biomass and lipid production by oleaginous fungus Penicillium citrinum PKB20 using response surface methodology (RSM). Biocatal Agric Biotechnol. 2021;37:102169.
Crossref - Kanaga S, Silambarasan T, Malini E, Mangayarkarasi S, Dhandapani R. Optimization of biomass production from Chlorella vulgaris by response surface methodology and study of the fatty acid profile for biodiesel production: A green approach. Biocatal Agric Biotechnol. 2022;45:102505.
Crossref - Yu HS, Lee NK, Kim WJ, Lee DU, Kim JH, Paik HD. Optimization of an industrial medium and culture conditions for probiotic Weissella cibaria JW15 biomass using the Plackett-Burman design and response surface methodology. J Microbiol Biotechnol. 2022;32(5):630-637.
Crossref - Nagajothi K, Murugesan AG. Polyhydroxy butyrate biosynthesis by Azotobacter chroococcum MTCC 3858 through groundnut shell as lignocellulosic feedstock using resource surface methodology. Sci Rep. 2023;13(1):10743.
Crossref - Kiprotich D, Muriithi DK, Njogu MK. Optimization of Groundnuts (Archis hypogeal) Yield through Response Surface Methodology. 2024. Asian J. Prob. Stat. 26(10):95-107
Crossref - Lhamo P, Mahanty B, Behera SK. Optimization of biomass and polyhydroxyalkanoate production by Cupriavidus necator using response surface methodology and genetic algorithm optimized artificial neural network. Biomass Conversion and Biorefinery. 2024;14(17):20053-20068.
Crossref - Kolotylo V, Piwowarek K, Synowiec A, Kieliszek M. Optimization of fermentation conditions for microbial transglutaminase production by Streptoverticillium cinnamoneum KKP 1658 using response surface methodology (RSM). Folia Microbiol. 2025;70(1):259-269.
Crossref - Sunder, Yadav S, Pal J. Optimisation of process parameters for lignocellulosic biomass degradation by Pseudomonas sp. using response surface methodology. Int J Biol Macromol. 2025;309:142792.
Crossref - Gherna RL, Reddy CA. Culture preservation. In: Reddy CA, Beveridge TJ, Breznak JA, Marzluf GA, Schmidt TM, Snyder LR eds. Methods for General and Molecular Microbiology. ASM Press 2007:1019-1033.
Crossref - She RC, Petti CA. Procedures for the Storage of Microorganisms. In: Jorgensen JH, Carroll KC, Funke G, et al. eds,. Manual of Clinical Microbiology. ASM Press. 2015:161-168.
Crossref - Petti CA, Carroll KC. Procedures for the Storage of Microorganisms. In: Carroll KC, Funke G, Jorgensen JH, Landry ML, Warnock DW eds. Manual of Clinical Microbiology. ASM Press 2011:124-131.
Crossref - Tlusty B, Grossman JM, Graham PH. Selection of rhizobia for prairie legumes used in restoration and reconstruction programs in Minnesota. Can J Microbiol. 2004;50(11):977-983.
Crossref
© The Author(s) 2026. Open Access. This article is distributed under the terms of the Creative Commons Attribution 4.0 International License which permits unrestricted use, sharing, distribution, and reproduction in any medium, provided you give appropriate credit to the original author(s) and the source, provide a link to the Creative Commons license, and indicate if changes were made.