

ISSN: 0973-7510
E-ISSN: 2581-690X
Cultural, morphological and pathogenic studies revealed a wide range of variability of among the 20 isolates of A. carthami of safflower which represented four geographic regions of the state of Maharashtra. All 20 test isolates exhibited a great cultural variability in mycelial growth, colony colour, growth speed, colony shape and sporulation. Significantly highest mycelial growth was found in isolate AcHl (90.00 mm), followed by AcBl (89.67 mm) and AcAn (88.83 mm). Among morphological variability in respect of mycelial width, conidial dimensions, beak length and number of vertical and horizontal septa eight isolates exhibited large mycelial width (7.05 to 9.80 µm), six isolates with medium sized with mycelium width (5.40 to 6.46 µm) and six with small sized mycelium width (3.25 to 4.86 µm). On the basis of average conidial dimensions (length X breadth), the test isolates were categorized into three groups viz., large, medium and small sized conidia were found in nine isolates of which average length ranged from 36.37 to 50.32 µm and width from 13.06 to 17.19 µm; seven isolates were with medium sized conidia (26.80-35.37 X 9.94-14.73 µm) and rest four isolates with small sized conidial (22.45-25.17 X 7.28-9.27 µm). About eight isolates exhibited long beak length (11.05 to 16.43 µm), seven isolates with medium beak length (8.13 to 11.27 µm) and rest five isolates were of short beak length (6.04 to 7.46 µm). Among the test isolates, horizontal septation on conidia was ranged from 1 to 12 and vertical septation from 0 to 3. All of the 20 isolates of A. carthami exhibited a wide range of pathogenic variability. However, the aggressive isolates (viz., AcHl, AcBl, AcAn, AcJg, etc.) showed least incubation period, highest leaf spot frequency with maximum sized leaf spots.
Alternaria carthami, safflower, cultural, morphological, pathogenic variability.
Safflower is the most important rabi oilseed crops grown in India. In general, the crops have low average productivity due to the prevalence of various biotic and abiotic stresses. Diseases are among the major biotic stresses. Alternaria blight caused by Alternaria carthami is an important and a widespread destructive disease of safflower. Depending on the severity of the disease, yield losses as high as 25-60% have been reported in India (Singh and Prasad, 2005).
The Alternaria spp. are one of the widely distributed phytopathogens infecting a wide range of agronomical and horticulture crop plant species, cultivated worldwide. In Alternaria spp., the existence of a high level of variability viz., cultural, morphological and pathogenic etc. have earlier been reported by several workers (Rajender et al., 2013; Sharma et al., 2013; Giri et al., 2014; Nikam et al., 2015). The variants within population of the phytopathogen may certainly affect the rate of disease development and can induce infections even in disease tolerant or resistant host plant species. To develop an effective programme of breeding for disease resistance comprehensive understandings of pathogenic, morphological, cultural and pathogenic variability are essential. Therefore, in present studies, cultural, morphological and pathogenic variability of A. carthami isolates collected from various agro-climatic zones and geographical regions of state of Maharashtra was attempted.
Cultural, morphological and pathogenic variability among A. carthami isolates
Cultural variability among A. carthami isolates
Twenty test isolates of A. carthami obtained one each from twenty districts under various geographical regions of the Maharashtra state were aseptically inoculated on PDA medium separately, maintaining three plates / isolate and incubated at 28±2°C, in an BOD incubator. Observations on cultural characteristics viz., colony diameter, colony colour / pigmentation, appearance, growth rate, shape, margin and zonation were recorded after a week of incubation and sporulation was recorded at 15 days of incubation.
Morphological variability among A. carthami isolates
The morphological characteristics viz., hyphal width, size of conidia, length of beak of each test isolate (10 days old pure culture growth on PDA) were recorded by measuring with ocular micrometer, which was calibrated using stage micrometer, by applying standard procedure given by Aneja (2001) under the compound microscope (make: Labomed Vision 2000) at 400x magnification and under 10 random microscopic fields. Similarly, numbers of transverse and longitudinal septa / conidium were counted.
Pathogenicity assay and pathogenic variability among of A. carthami isolates
In order to confirm identification of the disease and its causal agent, the pathogenicity test was attempted in pot culture under screen house conditions. Seeds of safflower cv. Manjira susceptible to Alternaria blight (A. carthami) were surface sterilized with 0.1% HgCl2 and sown (@ 10 seeds/pot) in the earthen pots (30 cm dia.) filled with steam sterilized potting mixture of soil : sand : FYM (2 : 1 : 1). After two week, two healthy growing safflower seedlings per pot were maintained, watered regularly and kept in the screen house for further growth and development. The spore-cum-mycelial suspensions of A. carthami test isolates was prepared separately from 10 days pure culture in plates, by flooding with 5-10 ml sterile distilled water. This resultant suspension was suitably diluted with sterile distilled water to get inoculum concentration of 2 x 10⁶ spores/ml. Thirty days old seedlings (2 / pot/ isolate / replication) of safflower cv. Manjira growing in earthen pots were artificially spray inoculated the spore-cum-mycelial suspension separately of the test isolates (Giri et al., 2013), the experiment was planned with CRD and all the test isolates replicated thrice. Safflower cv. Manjira seedlings grown in earthen pots and sprayed with sterile water (without inoculum) were maintained as uninoculated suitable control. These pots (both inoculated and uninoculated) were covered with polythene bags during evening hours and kept overnight, watered regularly to create optimum relative humidity and maintained in screen house for development of the disease symptoms.
From the artificially inoculated and Alternaria blight diseases safflower leaves the test isolates were reisolated separately on PDA medium and incubated at 28±2°C. After a week of incubation the cultural and morphological characteristics developed of the test isolates were observed and compared with the characteristics (cultural and morphological) of the original test isolates obtained from naturally Alternaria blight diseased safflower foliage. To satisfy Koch’s postulates, symptoms developed on artificial inoculated safflower leaves were compared with original symptoms on naturally diseased plants. Observations on incubation period (days to expression of initial symptoms), number of lesions / plant and diameter of the lesions were recorded.
Isolates of A. carthami, representing 20 districts of the Maharashtra state
| Sr. No. | Districts | A. carthami Isolates | Agro-Climatic Zone | Av. Rainfall (mm) |
|---|---|---|---|---|
| Marathwada Region (08) | ||||
| 1 | Parbhani | AcPb | Assured Rainfall Zone (7) | 700-900 |
| 2 | Nanded | AcNd | Central Vidharbha Zone (8) | 900-1150 |
| 3 | Hingoli | AcHl | Central Vidharbha Zone (8) | 900-1150 |
| 4 | Latur | AcLt | Assured Rainfall Zone (7) | 700-900 |
| 5 | Osmanabad | AcOs | Assured Rainfall Zone (7) | 700-900 |
| 6 | Beed | AcBd | Scarcity Zone (6) | <700 |
| 7 | Aurangabad | AcAb | Assured Rainfall Zone (7) | 700-900 |
| 8 | Jalna | AcJl | Assured Rainfall Zone (7) | 700-900 |
| Vidharbha Region (05) | ||||
| 9 | Buldana | AcBl | Assured Rainfall Zone (7) | 700-900 |
| 10 | Washim | AcWs | Central Vidharbha Zone (8) | 900-1150 |
| 11 | Akola | AcAk | Assured Rainfall Zone (7) | 700-900 |
| 12 | Amaravati | AcAm | Assured Rainfall Zone (7) | 700-900 |
| 13 | Yavatmal | AcYt | Central Vidharbha Zone (8) | 900-1150 |
| Khandesh Region (04) | ||||
| 14 | Jalgaon | AcJg | Assured Rainfall Zone (7) | 700-900 |
| 15 | Dhule | AcDl | Scarcity Zone (6) | <700 |
| 16 | Nandurbar | AcNb | Western Maharashtra Plain Zone (5) | 700-1200 |
| 17 | Nasik | AcNs | Scarcity Zone (6) | <700 |
| Western Maharashtra Region (03) | ||||
| 18 | Ahmadnagar | AcAn | Scarcity Zone (6) | <700 |
| 19 | Satara | AcSt | Western Maharashtra Plain Zone (5) | 700-1200 |
| 20 | Solapur | AcSl | Scarcity Zone (6) | <700 |
Cultural variability among A. carthami isolates
The results obtained on cultural characteristics viz., colony / mycelial growth, growth rate, colony appearance, margin, sporulation and concentric zonation etc in respect of 20 test isolates of A. carthami grown on PDA are presented in Table 1 and depicted in Plate 1.
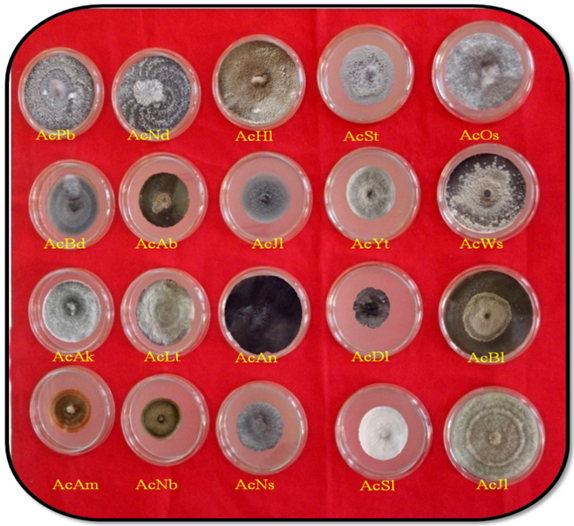 Plate 1. Cultural variability among the test isolates of A. carthami
Table (1):
Cultural variability among the isolates of A. carthami.
| Characters | Isolates | |||||||||
|---|---|---|---|---|---|---|---|---|---|---|
| AcPb (Parbhani) | AcNd (Nanded) | AcHl (Hingoli) | AcSt (Satara) | AcOs (Osmanabad) | AcBd (Beed) | AcAb (Aurangabad) | AcJl (Jalna) | AcYt (Yavatmal) | AcWs (Washim) | |
| 1 | 2 | 3 | 4 | 5 | 6 | 7 | 8 | 9 | 10 | |
| Colony Dia. (mm) | 87.00 | 86.50 | 90.00 | 77.83 | 83.67 | 79.33 | 75.67 | 73.00 | 74.50 | 85.50 |
| Colour | Creamy white | Black | Off white | Off white | Creamy white | Grayish / black | Black | Light gray | Grayish black | Brown |
| Appearance | Cottony | Cottony | Cottony | Cottony | Fluffy | Feathery | Feathery | Feathery | Fluffy | Fluffy |
| Growth speed | Fast | Fast | Fast | Medium | Medium | Medium | Medium | Slow | Slow | Fast |
| Shape | Circular | Circular | Circular | Irregular | Irregular | Circular | Irregular | Circular | Circular | Irregular |
| Margin | smooth | smooth | Smooth | rough | rough | smooth | rough | smooth | smooth | rough |
| Sporulation | +++ | ++++ | ++++ | ++ | +++ | +++ | ++++ | +++ | ++++ | ++++ |
| Zonation | Present | Present | Present | Absent | Absent | Present | Absent | Present | Present | Absent |
| Characters | AcAk (Akola) |
AcLt (Latur) |
AcAn (Ahmadnagar) |
AcDl (Dhule) |
AcBl (Buldana) |
AcAm (Amravati) |
AcNb (Nandurbar) |
AcNs (Nasik) |
AcSl (Solapur) |
AcJg (Jalgaon) |
| 11 | 12 | 13 | 14 | 15 | 16 | 17 | 18 | 19 | 20 | |
| Colony Dia. (mm) | 80.17 | 81.83 | 88.83 | 65.17 | 89.67 | 68.83 | 67.00 | 71.17 | 72.33 | 88.00 |
| Colour | Brown | Olivaceous black | Black | Black | Brown | Yellowish | Olivaceous black | Light gray | Creamy white | Creamy white |
| Appearance | Feathery | Fluffy | Feathery | Feathery | Fluffy | Cottony | Feathery | Fluffy | Cottony | Cottony |
| Growth | Medium | Medium | Fast | Slow | Fast | Slow | Slow | Slow | Slow | Fast |
| Shape | Irregular | Irregular | Irregular | Circular | Circular | Circular | Circular | Irregular | Irregular | Circular |
| Margin | Rough | Rough | Rough | Smooth | Smooth | Smooth | Smooth | Rough | Rough | Smooth |
| Sporulation | +++ | +++ | ++++ | ++ | ++++ | ++ | ++ | +++ | ++ | ++++ |
| Zonation | Absent | Absent | Absent | Present | Present | Present | Present | Absent | Absent | Present |
Sporulation: ++++ = Excellent, +++ = Good, ++ = Fair, + = Poor, Dia: Diameter
Colony / mycelial growth: SE±: 0.46, CD (P = 0.01): 1.29
Mycelial growth
The results (Table 1) indicated that among the test isolates, mycelial growth was varied from 65.17 mm (AcDl) to 90.00 mm (AcHl). However, it was significantly highest in isolate AcHl (90.00 mm), followed by the isolates viz., AcBl (89.67 mm), AcAn (88.83 mm) all three were at par, AcJg (88.00 mm), AcPb (87.00 mm) both were at par, AcNd (86.50 mm), AcWs (85.50 mm) both were at par and AcOs (83.67 mm). In rest of the test isolates, mycelial growth was ranged from 65.17 mm to 79.33 mm; however, it was moderate in the isolate AcNs (71.17 mm), followed by AcSl (72.33 mm) and AcJl (73.00), all were at par and it was significantly minimum in AcDl (65.17 mm).
Colony colour
On the basis of colony colour, the test isolates were categorized into eight groups. Group I consisted four isolates with creamy white colony (AcPb, AcOs, AcSl and AcJg), group II contained of four isolates with creamy black colony (AcNd, AcAb, AcAn and AcDl), group III consisted two isolates with off white colony (AcHl and AcSt), group IV consisted two isolates with grayish black colony (AcBd and AcYt), group V consisted two isolates with light gray colony (AcJl and AcNs), group VI consisted three isolates with brown colony (AcWs, AcAk and AcBl), group VII consisted two isolates with olivaceous black colony (AcLt and AcNb) and group VIII consisted a single isolate with yellowish colony (AcAm).
Colony growth rate
On the basis colony growth rate, the test isolates were categorized as fast growing, moderate growing and slow growing. In fast growing category, the seven isolates included were AcPb, AcNd, AcHl, AcWs, AcAn, AcBl and AcJg; medium / moderate growing category the six isolates included were AcSt, AcOs, AbBd, AcAb, AcAk and AcLt and in slow growing category the seven isolates included were AcJl, AcYt, AcDl, AcAm, AcNb, AcNs and AcSl.
Colony shape and margin
On the basis of colony shape (circular or irregular) and colony margin (smooth or rough), the test isolates were categorized into two groups. The group I included about 11 isolates with circular colony and smooth margin, which were AcPb, AcNd, AcHl, AcBd, AcJl, AcYt, AcDl, AcBl, AcAm, AcNb and AcJg. The group II included the isolates with irregular colony and rough margin, which contained rest of the nine isolates viz., AcSt, AcOs, AcAb, AcWs, AcAk, AcLt, AcAn, AcNs and AcSl.
Sporulation and concentric zonation
The sporulation induced by the test isolates varied from poor (+) to excellent (++++). However, it was excellent (++++) in about eight isolates viz., AcNd, AcHl, AcAb, AcYt, AcWs, AcAn, AcBl and AcJg; good (+++) in seven isolates viz, AcPb, AcOs, AcBd, AcJl, AcAk, AcLt and AcNs and fair (++) in five isolates viz., AcSt, AcDl, AcAm, AcNb and AcSl. The zonation was present in about 11 test isolates viz., AcPb, AcNd, AcHl, AcBd, AcJl, AcYt, AcDl, AcAm, AcBl AcNb and AcJg; while, it was absent in rest of the 9 test isolates viz., AcSt, AcOs, AcAb, AcWs, AcAk, AcLt AcAn, AcNs and AcSl.
Morphological variability among A. carthami isolates
Results (Table 2 and Plate 2) revealed that all the 20 test isolates of A. carthami exhibited a wide range of variability in respect of mycelial width, conidial dimensions, beak length and number of vertical and horizontal septa.
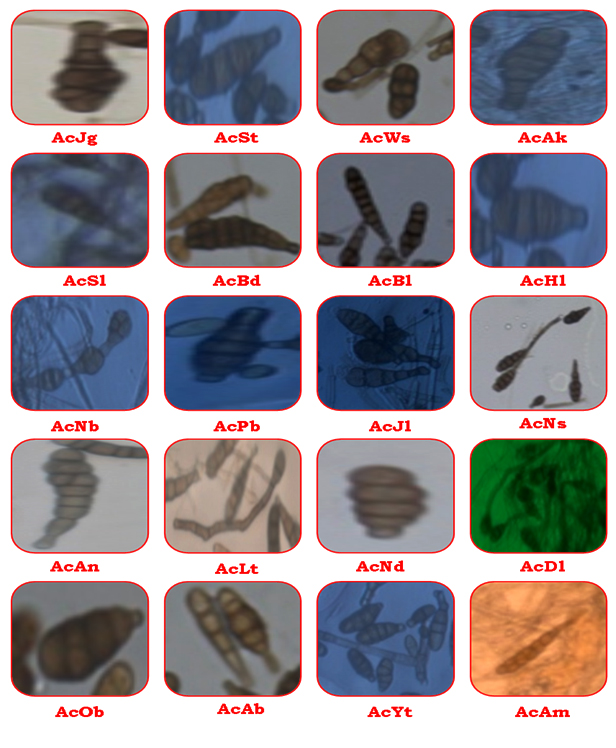 Plate 2. Close-up view of conidia of A. carthami test isolates
Table (2):
Morphological variability among the isolates of A. carthami.
| Sr. No. | Isolates / Districts | Av. Mycelial width (µm) | Av. Size of conidia (µm) | Av. Beak length (µm) | No. of Septa (Range) | ||
|---|---|---|---|---|---|---|---|
| Length | Breadth | H | V | ||||
| 1 | AcPb (Parbhani) |
7.81 | 38.30 | 15.62 | 11.27 | 1 – 5 | 1 – 2 |
| 2 | AcNd (Nanded) |
7.50 | 29.38 | 11.24 | 8.10 | 1 – 4 | 0 – 2 |
| 3 | AcHl (Hingoli) |
9.80 | 36.37 | 16.35 | 16.43 | 1 – 4 | 1 – 3 |
| 4 | AcSt (Satara) |
5.89 | 25.17 | 7.93 | 06.86 | 1 – 4 | 0 – 1 |
| 5 | AcOs (Osmanabad) |
7.05 | 27.87 | 11.70 | 07.46 | 1 – 5 | 0 – 1 |
| 6 | AcBd (Beed) |
6.10 | 41.45 | 16.06 | 13.03 | 1 – 6 | 1 – 2 |
| 7 | AcAb (Aurangabad) |
5.70 | 39.40 | 15.31 | 12.04 | 1 – 5 | 1 – 2 |
| 8 | AcJl (Jalna) |
4.86 | 32.27 | 12.76 | 10.59 | 3 – 5 | 0 – 1 |
| 9 | AcYt (Yavatmal) |
5.40 | 30.00 | 12.27 | 10.24 | 2 – 4 | 0 – 1 |
| 10 | AcWs (Washim) |
7.50 | 28.20 | 14.13 | 09.01 | 4 – 8 | 0 – 2 |
| 11 | AcAk (Akola) |
6.30 | 50.32 | 15.02 | 14.65 | 3 – 8 | 0 – 1 |
| 12 | AcLt (Latur) |
6.46 | 45.80 | 14.62 | 15.24 | 4 – 8 | 1 – 2 |
| 13 | AcAn (Ahmadnagar) |
8.46 | 39.11 | 13.56 | 13.45 | 2 – 5 | 1 – 2 |
| 14 | AcDl (Dhule) |
3.25 | 22.45 | 7.28 | 06.04 | 1 – 4 | 0 – 1 |
| 15 | AcBl (Buldana) |
9.25 | 40.35 | 13.06 | 14.34 | 4-12 | 1 – 3 |
| 16 | AcAm (Amravati) |
3.78 | 35.37 | 9.94 | 11.05 | 1 – 3 | 0 – 1 |
| 17 | AcNb (Nandurbar) |
3.53 | 26.80 | 10.78 | 09.47 | 1 – 3 | 0 – 1 |
| 18 | AcNs (Nasik) |
4.10 | 23.57 | 8.44 | 07.10 | 2 – 5 | 1 – 2 |
| 19 | AcSl (Solapur) |
4.54 | 23.92 | 9.27 | 06.50 | 2 – 4 | 1 – 2 |
| 20 | AcJg (Jalgaon) |
8.15 | 37.55 | 17.19 | 12.96 | 2 – 6 | 0 – 2 |
H : Horizontal, V : Vertical
Mycelial width
On the basis of mycelial width, the test isolates were categorized into three groups viz., large, medium and small sized mycelium. About eight isolates exhibited large mycelial width in the range of 7.05 to 9.80 µm. However, it was maximum in the isolate AcHl (9.80 µm), followed by AcBl (9.25 µm), AcAn (8.46 µm) and AcJg (8.15 µm); while, in rest of the four isolates (AcPb, AcWs, AcNd and AcOs) the mycelial width was ranged from 7.05 to 7.81µm.
In medium sized mycelium category, six isolates were grouped with mycelial width in the range 5.40 to 6.46 µm. However, maximum mycelial width was recorded in AcLt (6.46 µm) isolate, followed by the isolates viz., AcAk (6.30 µm), AcBd (6.10 µm), AcSt (5.89 µm), AcAb (5.70 µm) and AcYt (5.40 µm).
In small sized mycelium category, about six isolates were grouped with mycelial width in the range of 3.25 to 4.86 µm. However, it was maximum in the isolate AcJl (4.86 µm), followed by AcSl (4.54 µm), AcNs (4.10 µm), AcAm (3.78 µm), AcNb (3.53 µm) and AcDl (3.25 µm).
Conidial size
The results revealed that the test isolates, exhibited a wide range of variability in respects of average conidial dimensions (length X breadth) and on the basis of which they were categorized into three groups viz., large, medium and small sized conidia.
In large sized conidial group, about nine isolates were included with their average conidial length in the range of 36.37 to 50.32 µm and their average width in the range of 13.06 to 17.19 µm. Among these isolates, highest average conidial size (length X breadth) was recorded in the isolate AcAk (50.32 X 15.02 µm), followed by the isolates viz., AcLt (45.80 X 14.62 µm), AcBd (41.45 X 16.06 µm), AcBl (40.35 X 13.06 µm), AcAb (39.40 X 15.31 µm), AcAn (39.11 X 13.56 µm) and AcPb (38.30 X 15.62 µm). Rest of three isolates in this group recorded conidial size in the range of 36.37-37.55 X 16.35-17.19 µm.
In the medium sized conidial group, seven isolates were included, of which average conidial size was ranged from 26.80-35.37 X 9.94-14.73 µm. Among these isolates, maximum average conidial size was recorded in the isolate AcAm (35.37 X 9.94 µm), followed by the isolates viz., AcJl (32.27 X 12.76 µm), AcYt (30.00 X 12.27 µm) and AcNd (29.38 X 11.24 µm). Rest of the three isolates in this group recorded average conidial size in the rage of 26.80-28.20 X 10.78-14.30 µm.
In small sized conidial group, only four isolates were grouped, of which average conidial size was ranged from 22.45-25.17 X 7.28-9.27 µm. Among these isolates, maximum conidial size was recorded in the isolate AcSt (25.17 X 7.93 µm), followed by the isolates viz., AcSl (23.92 X 9.27 µm) and AcNs (23.57 X 8.44 µm); while it was least in the isolate AcDl (22.45 X 7.28 µm).
Beak length
On the basis of conidial average beak length, the test isolates were also categorized into three groups viz., long, medium and short beaked.
In long beaked group, about eight isolates were included with average beak length in the range of 11.05 to 16.43 µm. However, it was highest in the isolate AcHl (16.43 µm), followed by the isolates viz., AcLt (15.24 µm), AcAk (14.65 µm), AcBl (14.34 µm), AcAn (13.45 µm), AcBd (13.03 µm), AcJg (12.96 µm) and AcAb (12.04 µm).
In medium beaked group, about seven isolates were included with average beak length in the range of 8.13 to 11.27 µm. Among these isolates, maximum average beak length was recorded in AcPb (11.27 µm), followed by the isolate viz., AcAm (11.05 µm), AcJl (10.59 µm), AcYt (10.24 µm), AcNb (9.47 µm), AcWs (9.01 µm) and AcNd (8.10 µm),
In small beaked group, about five isolates were included with average beak length in the range of 6.04 to 7.46 µm. Among these isolates, maximum average beak length was recorded with the isolate AcOs (7.46 µm), followed by AcNs (7.10 µm), AcSt (6.86 µm), AcSl (6.50 µm) and AcDl (6.04 µm).
Septation
Results revealed marked variability among the test isolates in respect of their horizontal and vertical septa on the conidia. Among the test isolates, horizontal septation was ranged from 1 to 12 and vertical septation from 0 to 3. Of the test isolates, AcBl recorded maximum horizontal (4-12) and vertical (1-3) septations, followed by the isolate viz., AcWs and AcLt (each H: 4-8 and V: 0-2), AcAk (H: 3-8 and V : 0-1), AcJl (H: 3-5 and V: 0-1), AcJg (H: 2-6 and V: 0-2), AcAn and AcNs (each H: 2-5 and V: 1-2) and AcYt (H: 2-4 and V: 0-1). Rest of the isolates recorded horizontal and vertical septation in the range of 1-3 to 1-6 and 0-1 to 0-3.
Thus, from this foregoing results it has been inferred that all 20 test isolates of A. carthami representing four geographic regions of the Maharashtra state exhibited a varied range morphological characteristics. The mycelial width, conidium size and their beak length were varied from small to large, as well as septations (H and V) were ranged from 1-12 (horizontal) to 0-3 (vertical).
Cultural and morphological variability studies in A. carthami, A. brassicae, A. sesame, A. solani, A. lini, isolates was attempted earlier by several workers. Mortensen (1983) reported mycelial growth of the A. carthami isolates ranged from 81 to 32 mm on PDA within 8 days, conidial amount from 0.1 X 10⁵ to 19.3 X 10⁵ per plate. Mycelial growth in isolate 4 and 43-1 was rapid mycelial growth (81 and 79 mm) and it was slow isolates S-a, 22 and 49-1 (65, 64 and 60 mm, respectively). Vishwanath et al. (2002) reported cultural variability among three isolates of A. brassicae in respect of growth and colony chararacters. Savitha and Naik (2004) that the isolates of Alternaria spp. infecting sesamum produced fluffy to raised dark brown or light grey mycelium (72-88 mm) on PDA. Cultural variability among the isolates of various Alternaria spp. reported earlier were A. brassicae (Prasad et al., 2012; Singh and Singh, 2014), A. helianthi (Rajender et al., 2013).
Morphological variability in respect of conidial size, beak length and conidial septation observed in present study in respect of A. carthami coincides with several earlier workers. Deokar and Raghuwanshi (2002) studied six isolates of A. carthami and reported variability in conidial size (42-69 X 11-17 µm length and 41-58 X 10-14 µm breadth), horizontal septation (0-7), vertical septation (0-3), small to large beak length and light brown to dark brown conidia. Ramegowda and Naik (2008) reported variability in mycelial width (2.87-6.95 µm), large sized conidia with medium to long beak length in the isolates of A. macrospora causing leaf blight of cotton. Prasad et al. (2012) reported conidial length (96-120 X 24-32 µm) and breadth (24-40 µm), with transverse septa (7-9) and longitudinal septa (2-4) in A. carthami. Sharma et al. (2013) reported variability in conidial length (37.88 to 57.65 µm) and width (6.0 to 9.5 µm), transverse septa (2.33 to 6.0) and minimum number of longitudinal septa in A. brassicae isolates. Singh et al. (2014) studied morphological variability among A. brassicae isolates and reported their hyphal width (3.0-5.9 µm), muriform or ovate conidia (86.40-240.5 X 15.5-30 µm), transverse septa (5-16), longitudinal septa (0-8) and beak length (10-130 µm).
Pathogenicity test and pathogenic variability
Pathogenicity test (Plate 3) of A. carthami (20) was conducted in screen house using Alternaria blight susceptible safflower cv. Manjira and results obtained on pathogenic traits viz., incubation period, number of spots and size of the spots are presented in Table 3.
 Plate 3. Pathogenicity test and pathogenic variability of A. carthami isolates on safflower Cv. Manjira
Table (3):
Pathogenic variability among A. carthami isolates.
Sr. No. |
Isolates / Districts |
Av. incubation period (days)* |
Av. no. of spots* |
Av. size of spot (mm2)* |
|---|---|---|---|---|
1 |
AcPb (Parbhani) |
7 |
16.33 |
14.28 |
2 |
AcNd (Nanded) |
7 |
15.67 |
13.88 |
3 |
AcHl (Hingoli) |
5 |
22.00 |
17.14 |
4 |
AcSt (Satara) |
7 |
10.50 |
09.07 |
5 |
AcOs (Osmanabad) |
7 |
10.67 |
09.52 |
6 |
AcBd (Beed) |
8 |
09.67 |
08.64 |
7 |
AcAb (Aurangabad) |
7 |
13.33 |
11.90 |
8 |
AcJl (Jalna) |
8 |
08.50 |
07.16 |
9 |
AcYt (Yavatmal) |
8 |
09.00 |
07.79 |
10 |
AcWs (Washim) |
7 |
14.00 |
12.96 |
11 |
AcAk (Akola) |
7 |
11.00 |
10.43 |
12 |
AcLt (Latur) |
7 |
12.50 |
11.10 |
13 |
AcAn (Ahmadnagar) |
5 |
19.67 |
15.82 |
14 |
AcDl (Dhule) |
9 |
05.00 |
02.80 |
15 |
AcBl (Buldana) |
5 |
21.33 |
16.54 |
16 |
AcAm (Amravati) |
9 |
06.33 |
04.77 |
17 |
AcNb (Nandurbar) |
9 |
05.50 |
03.18 |
18 |
AcNs (Nasik) |
9 |
07.00 |
05.37 |
19 |
AcSl (Solapur) |
8 |
07.67 |
06.72 |
20 |
AcJg (Jalgaon) |
6 |
18.50 |
15.11 |
SE± |
0.28 |
0.15 |
0.13 |
|
CD (P = 0.01) |
0.82 |
0.41 |
0.34 |
*: Mean of three replications, Av.: Average, No.: Number
Symptoms
All 20 test isolates of A. carthami were found pathogenic to safflower. The symptoms induced under pathogenicity test were identical to those symptoms observed on naturally diseased safflower crop foliage during survey.
Incubation period
Results revealed that among various pathogenic traits of A. carthami, the incubation period was varied in the susceptible safflower cv. Manjira. On the basis of incubation period (day to expression of first symptom), the test isolates were categorized in three groups viz., A (highly aggressive with minimum of 5-6 days incubation period), B (moderately aggressive with moderate of 7-8 days incubation period) and C (less aggressive with 9 or more days incubation period). Accordingly, in group A the isolates (04) included were AcHl, AcAn, AcBl and AcJg; in group B the isolates (12) included were AcPb, AcNd, AcSt, AcOs, AcAb, AcWs, AcAk, AcLt, AcBd, AcJl, AcYt and AcSl and in group C the isolates (04) included were viz., AcAm, AcNb, AcDl and AcNs.
Frequency of leaf spots
There were significant variations in the frequency of leaf spots (average number of spots / plant) on safflower cv. Manjira (Table 3) and it was ranged from 5.00 (AcDl) to 22.00 (AcHl). On the basis of frequency of the leaf spots, the test isolates were categorized in to three groups viz., A (highly virulent = leaf spot frequency in the range of 22.00 to 15.67 / plant), B (moderately virulent = leaf spot frequently in the range of 10.50 to 14.00 / plant) and C (less virulent = leaf spot frequency in the range of 5.00 to 13.33 / plant). In group A of highly virulent isolates the leaf spot frequency was ranged from 15.67 (AcNd) to 22.00 (AcHl) per plant; however, it was significantly highest with the isolate AcHl (22.00), followed by AcBl (21.33), AcAn (19.67), AcJg (18.50), AcPb (16.33) and AcNd (15.67). In group B of moderately virulent isolates, the leaf spot frequency was ranged from 10.50 (AcSt) to 14.00 (AcWs); however, it was significantly maximum with the isolate AcWs (14.00), followed by AcAb (13.33), AcLt (12.50), AcAk (11.00), AcOs (10.67) and AcSt (10.50), later two isolates were at par. In group C of less virulent isolates, the leaf spot frequency was ranged from 5.00 (AcDl) to 13.33 (AcAb) per plant; however, it was significantly maximum with the isolate AcLt (12.50), followed by AcAk (11.00), AcOs (10.67), AcSt (10.50), AcBd (9.67) and AcYt (9.00).
Size of leaf spots
Size / diameter of the spots induced by A. carthami isolates on foliage of safflower cv. Manjira was also found to be varied significantly among the test isolates and it was ranged from 2.80 to 17.14 mm.2
Based on average size (mm2) of the leaf spots, the test isolates were categorized into three groups viz., A (with maximum average leaf spot size in the range 12.96 to 17.14 mm2), B (with medium average leaf spot size in the range of 7.16 to 11.90 mm2) and C (with small average leaf spot size in the range of 2.80 to 6.72 mm2). In group A, those isolates which induced large sized spots (12.96 to 17.14 mm2) were included and significantly large sized leaf spots were induced by the isolates AcHl (17.14 mm2), followed by the isolates AcBl (16.54 mm2), AcAn (15.82 mm2), AcJg (15.11 mm2), AcPb (14.28 mm2), AcNd (13.88 mm2) and AcWs (12.96 mm2). In group B of medium sized leaf spots, maximum sized spots were induced with the isolate AcAb (11.90 mm2), followed by the isolates AcLt (11.10 mm2), AcAk (10.43 mm2), AcOs (9.52 mm2), AcSt (9.07 mm2), AcBd (8.64 mm2), AcYt (7.79 mm2) and AcJl (7.16 mm2). In group C of small sized leaf spot, maximum sized spots were induced with the isolate AcSl (6.72 mm2), followed by AcNs (5.37 mm2) and AcAm (4.77 mm2); whereas significantly smallest sized leaf spots were induced by the isolates AcDl (2.80 mm2) and AcNb (3.18 mm2).
Thus, from this ongoing results it was concluded that all 20 isolates of A. carthami representing four geographic regions of the Maharashtra state exhibited a wide range of pathogenic variability. However, the aggressive isolates (viz., AcHl, AcBl, AcAn, AcJg, AvNd, etc.) showed highly virulent least incubation period, highest leaf spot frequency and maximum sized leaf spots. Whereas, moderately virulent / aggressive isolates exhibited each moderate incubation period, leaf spot frequency and their size. In less virulent isolates viz., AcAm, AcDl, AcNb and AcNs through incubation period was maximum (> 9 days), but leaf spot frequency and their size were of lower degree.
Pathogenic association of A. carthami with safflower causing Alternaria leaf spot / blight was reported earlier by several workers under controlled conditions of screen house by inoculating spore cum mycelial suspension (A. carthami) on susceptible safflower cultivars (Singh and Prasad, 2005; Ranaware et al., 2010; Gholve et al., 2015).
The cultural and morphological characteristics of A. carthami found in present study are in consonance with the earlier reported (Deokar and Raghuwanshi, 2002; Taware et al., 2014). Gholve et al. (2015) reported that A. carthami produced initially white, cottony profused aerial mycelium, which gradually turned greenish grey in colour. Aged culture completely black with no aerial mycelium on Potato dextrose agar Microscopic characteristics such as brownish black septate mycelium and dark brown beaked conidia with transverse and longitudinal septation of A. carthami observed during present study were also reported earlier by several workers (Ranaware et al., 2010; Prasad et al., 2012; and Gholve et al., 2015).
Pathogenic diversity among isolates of the Alternaria spp. infecting various oilseeds and vegetable crops was reported in past. Meena et al. (2011) reported pathogenic variability in A. brassicae isolates in respect of disease severity on host differentials and lesion size. Virulent isolates produced large sized lesions with higher per cent disease severity. Sigh et al. (2013), Sharma et al. (2013) and Giri et al. (2014) were of similar opinion in respect of pathogenic variability in A. brassicae causing leaf blight of rapeseed-mustard. Kolte et al. (2005) reported pathogenic variability in leaf spots produced. Virulent isolates produced large spots with dark margins. Jadhav et al. (2011) reported existence of pathogenic variability in A. macrospora isolates from cotton. They found that in virulent isolates the incubation period very short (8-9 days), large lesion size and maximum number of lesions per unit leaf area; whereas, the less virulent isolates required maximum incubation period (8-13 days), small sized lesion and their minimum frequency.
Thus, in present study pathological, cultural, morphological and pathogenic variability observed among the isolates of A. carthami may be attributed to their geographic distribution in the Maharashtra state, long tern influence of weather parameters at a particular location, ability of the pathogen to adopt the safflower varieties grown etc.
ACKNOWLEDGMENTS
I greatly acknowledge to my Dr. K. T. Apet, Head, Department of Plant Pathology, Vasantrao Naik Marathwada Krishi Vidyapeeth, Parbhani for their support during research work for the completion of my Ph.D. degree programme.
- Aneja, K. R. Experiments in microbiology, plant pathology, tissue culture and mushroom production technology. (3rd edn). New Age Intern. Pvt. Ltd. Pub., New Delhi, 2001; 10-15.
- Deokar, C. D. and Raghuwanshi, K. S. Morphological variations of Alternaria carthami isolates on different growth media. Sesame and Safflower Newsletter, 2002; 17 : 115-116.
- Gholve, V. M., Taware, M. R. and Wagh, S. S. Symptomatology, isolation, identification and pathogenicity test of Alternaria blight of safflower. Trends Biosci, 2015; 8 (1) : 57-60.
- Giri, P. P., Tasleem, M., Taj, G., Mal, R. and Kumar, A.. Morphological, cultural, pathogenic and molecular variability amongst mustard isolates of Alternaria brassicae in Uttarakhand. African J. Biotech., 2014; 13(3) : 441-448.
- Jadhav, B. M., Perane, R. R., Kale, A. A. and Pawar, N. B. Morphological, pathological and molecular variability among Alternaria macrospora isolates causing leaf blight of cotton. Indian Phytopath., 2011; 64(3) : 254-257.
- Kolte, S. J., Patni, C. S., Bhatiya, B. S. and Singh, K. Pathogenic variability of A. brassicae causing Alternaria blight of mustard. J. Mycol. Pl. Pathol., 2005; 35(3) : 550
- Meena, P. D., Goyal, P. and Sharma, P. Pathogenic variability among Alternaria brassicae population infecting oilseed Brassicas in India. Indian J. Pl. Prot. 2011; 39(3) : 212-214.
- Nikam, P. S., Suryawanshi, A. P. and Chavan A. A. Pathogenic, cultural, morphological and molecular variability among eight isolates of Alternaria solani, causing early blight of tomato. African J. Biotech., 2015; 14(10) : 872-877.
- Prasad, M. S. L., Sujatha, K. and Naresh, N. Variation in morphological and cultural characters of isolates of Alternaria carthami. J. Oilseeds Res. 29 (Spl. Issue), 2012: 362-364.
- Rajender, J., Pushpavathi, B., Prasad, M. S. L. and Naresh, N. Cultural, morphological and pathogenic characterization of isolate of Alternaria helianthi causing sunflower blight. Indian J. Pl. Prot., 2013; 41(1) : 76-84
- Ramegowda, G. and Naik, M. K.. Morphological, cultural and physiological in isolates of Alternaria spp. Infecting Bt-cotton. J. Mycol. Pl. Pathol., 2008; 38(2) : 267-271.
- Ranaware, A., Singh, V. and Nimbalkar, N.. In vitro antifungal study of the efficacy of some plant extracts for inhibition of Alternaria carthami fungus. Indian J. Nat. Prod. Reso., 2010; 1 (3) : 384-386.
- Savitha, A. S. and Naik, M. K.. Cultural, morphological, physiological, molecular and pathogenic diversity of Alternaria spp. of sesame. J. Mycol. Pl. Pathol., 2004; 34(3) :1007.
- Sharma, M., Deep, S., Bhati, D. S., Chowdappa, P., Selvamani, R. and Sharma, P. Morphological, cultural, pathogenic and molecular studies of Alternaria brassicae infecting cauliflower and mustard in India. African J. Microbiol. Res., 2013; 7(26) : 3351-3363.
- Singh, M. and Singh, H. K. Morphological and cultural variability in Alternaria brassicae isolates of Indian mustard, Brassica juncea L. Czern and Coss. in Uttar Pradesh. Trends Biosci., 2014; 7(20) : 3125-3128.
- Singh, M., Gupta, R. P., Singh, H. K., Kumar, A. and Kumar A. Morphological variability in Alternaria brassicae isolates of Indian mustard, Brassica juncea L. Czern. and Coss. Trends Biosci. 2014; 7(17) : 2382-2384.
- Singh, R., Mohan, C. and Sharma, V. K. Morphological and pathological variations in isolates of Alternaria brassicae causing leaf blight of rapeseed and mustard. Pl. Dis. Res., 2013; 27(1) : 22-27
- Singh, V. and Prasad, R. D. (2005). Integrated management of pests and diseases in safflower. Directorate of Oilseeds Research, Hyderabad, India PP : 49
- Taware, M. R., Gholve, V. M. and Utpal Dey (2014). Bio-efficacy of fungicides, bioagents and plant extracts / botanicals against Alternaria carthami, the causal agent of Alternaria blight of safflower (Carthamus tinctorius L.). Aftrican J. Microbio. Res. 8(13) : 1400-1412.
- Vishwanath, R. P., Awasthi and Kolte, S. J. (2002). Morphological, cultural, pathogenic and biomolecular variability in Alternaria brassicae. Indian Phytopath. 55(3) : 381.
© The Author(s) 2016. Open Access. This article is distributed under the terms of the Creative Commons Attribution 4.0 International License which permits unrestricted use, sharing, distribution, and reproduction in any medium, provided you give appropriate credit to the original author(s) and the source, provide a link to the Creative Commons license, and indicate if changes were made.