


ISSN: 0973-7510
E-ISSN: 2581-690X
Currently, the whole world is struggling with the biggest health problem COVID-19 name coined by the World Health Organization (WHO). This was raised from China in December 2019. This pandemic is going to change the world. Due to its communicable nature, it is contagious to both medically and economically. Though different contributing factors are not known yet. Herein, an effort has been made to find the correlation between temperature and different cases situation (suspected, confirmed, and death cases). For a said purpose, k-means clustering-based machine learning method has been employed on the data set from different regions of China, which has been obtained from the WHO. The novelty of this work is that we have included the temperature field in the original WHO data set and further explore the trends. The trends show the effect of temperature on each region in three different perspectives of COVID-19 – suspected, confirmed and death.
Coronavirus, COVID-19, Machine Learning, k-means Clustering
Study reveals that approximately dozens of viruses exist in the corona family, but humans are affected by its seven types [1]. Some are caused by mild colds in people, while remaining are deadly, and it is believe that they are to be transmitted from animals like bats [1,2]. The WHO has been noticed about these special pneumonic cases in the last week of December. The following week the cause of this special condition was found as COVID-2019. This causes an acute respiratory disease in humans, has emerged as the latest worldwide epidemic, having already claimed a considerable number of lives, especially in China. Last year in December 2019, COVID-19 emerged as a pandemic in Wuhan, China and thousands of people got affected [3].
In response to the sudden explosion of nCoV-2019 (Figure 1) [4], the Research and Development wing of WHO is actively trying to find the appropriate diagnostics and vaccination [5]. Day by day, medical experts are working rigorously and trying to explore its severe consequence such as human body respiratory symptoms get affected, particularly in the elderly people imparting mortality rate [6].

Fig. 1. The 2019-nCoV structure. Coronaviruses belong in the family Coronaviridae and can cause disease in mammals and birds. The coronavirus spike (S) protein mediates membrane fusion by binding to cellular receptors. (reprinted from [4] with permission under the terms of Creative Commons Attribution 4.0 International License
Different types of non-pharmaceutical interventions are taken and suggested to manage the COVID-19 effectively because there are no licensed authentic vaccines or coronavirus antivirals are found, one of the effective managements is seen i.e., lockdown [7]. The pessimistic view of this lockdowm is that it effects the whole world economy particularly transportation because the people are in quarantine state. Richard Baldwin, a professor of international economics at the Graduate Institute in Geneva said, “This virus is as economically contagious as it is medically contagious,” [8]. It is mandatory to establish a health clinic with an Artificial Intelligence (AI) based trained system, in order to fight/prevent quickly these natural epidemics [9].
It is quite difficult to estimate the fatality ratio with COVID-19. As of 07 March 2020, there were approximately 80,813 confirmed cases of COVID-19 [10] are particularly seen in china. Its subsequent spread worldwide and has been challenging the global public health community to confront a novel infectious disease (corona virus disease 2019, COVID-19). The rapid and accurate detection of corona virus is therefore becoming increasingly important. Machine learning applications have been widely used in medical sciences for various purposes such as disease diagnosis, prognosis, and different kinds of analytics including death rates by a disease. Deep learning method is applied on COVID-19 data set, detection accuracy rate is 86.7% [6].
We aim to explore the correlation between temperature and different cases situation (suspected, confirmed, and death cases). For a said purpose k-means machine learning method has been employed on the data set from different regions of China, which has been obtained from the WHO. We hope our study findings will inform the global community of the emergence of this novel COVID-19 and its impact on economy.
This section presents our applied methodology for the analysis of COVID-19 data set, taken from the World Health Organization (WHO) data set [11]. The data analysis has been performed using WEKA machine learning tool [12] to obtain the different trends. The methodology comprises these steps: data set collection, database design and description, clustering for attaining the trends.
Data Set Collection
Data set is a prerequisite for data analysis. In the present research work, we have used the data set of ‘Coronavirus disease (COVID-2019) situation reports’, which has been collected from the World Health Organization (WHO) [11]. This data set covers the corona infection rate in different regions of China with respect to temperature.
Data Set Design and Description
The WHO data set, has all the attributes as shown in Table 1 except two attributes – lowest temperature and highest temperature which have added separately. The reason of adding these two attributes because temperature is one of the factors of spreading the coronavirus. For this, we added two additional attributes in the WHO data set, highest and lowest temperature for each city/region given in the WHO data set, which have been recorded from the AccuWeather website. After adding temperature fields, the results could be more promising for exploring the trends/patterns. The design the of the data set is presented in Table 1 with explanation of each attribute and corresponding values of data type and constraint. A sample record from the data set is shown in Table 2.
Table (1):
Description of attributes used in COVID-19 Data Set.
Attribute |
Explanation |
Data Type |
Constraint |
|---|---|---|---|
Region |
Name of the China cities |
char |
not null |
Population (10000s) |
City population |
number |
not null |
Confirmed cases |
Declared COVID-19 cases |
number |
not null |
Suspected cases |
Suspected COVID-19 cases due to the symptoms |
number |
not null |
Death |
Number of death cases due to the COVID-19 infection |
number |
not null |
Lowest Temperature |
City’s Lowest temperature of the day |
number |
not null |
Highest Temperature |
City’s highest temperature of the day |
number |
not null |
Table (2):
A sample of records in the COVID-19 Data Set.
Region |
Population (10000s) |
Confirmed |
Suspected |
Death |
Highest Temp |
Lowest Temp |
|---|---|---|---|---|---|---|
Hubei |
5917 |
570 |
64 |
34 |
14 |
4 |
Applied Classifier- Clustering
Clustering is a well-known unsupervised machine learning classifier, and it is significantly used for pattern discovery procedure from the dispersed data set. A good clustering method produces high-quality clusters to ensure that the similarity among inter-cluster is less, and high in intra-cluster. In other words, members of a cluster are more like to each other than they are like members of different clusters. A cluster is a collection of data objects that are similar in some sense to one another and identifies clusters in a set of data and builds a typology of sets using a certain set of data. In the present research analysis, the clustering technique is applied on the COVID-19 data set. It is useful here because there are many cases and no obvious natural grouping is found. Here, the clustering machine learning algorithm is useful to find whatever grouping may exist.
K-means Clustering for COVID-19
Clustering can be done by various algorithms such as k-means, Density-Based Spatial Clustering of Applications with Noise (DBSCAN), and Hierarchical Clustering.
In the present investigation, k-means clustering has been applied because it is a distance based, fast processing, and has a linear complexity O(n) [13]. The concept of k-means clustering algorithm is given by [14]. The steps are as follows:
Select the number of ’k’ clusters to be identified into the space represented by the objects that are being clustered, which are represented in the initial group of centroids.
Each data point is categorized by calculating the distance between that point to each group centroid, and then classify the point closest center to it.
Recompute the group centroid based on classified points.
Repeat Steps 2 and 3 until the centroids does not change.
Table (3):
K-means Cluster results on COVID-19 data set.
Cluster ID |
Region |
Population (10000s) |
Confirmed |
Suspected |
Deaths |
Highest Temp |
Lowest Temp |
|---|---|---|---|---|---|---|---|
0 |
Zhejiang |
5913.10 |
1 |
0.8 |
0 |
13.1 |
6 |
1 |
Hunan |
6801.90 |
0 |
0 |
0 |
10.54 |
5.72 |
2 |
Taipei and environs |
2359 |
1.71 |
0 |
0 |
19.85 |
14 |
3 |
Liaoning |
4359 |
0.57 |
18.57 |
0 |
6.57 |
-0.57 |
4 |
Yunnan |
4859.33 |
0 |
1.33 |
0 |
20.22 |
6.55 |
5 |
Fujian |
3872.8 |
0 |
0 |
0 |
17.6 |
11.6 |
6 |
Hainan |
934 |
0 |
0.71 |
0.14 |
26.71 |
20.71 |
7 |
Jiangsu |
7822.53 |
0 |
0 |
0 |
13.46 |
3.92 |
8 |
Inner Mongolia |
2534 |
0 |
0 |
0.14 |
4.85 |
-7.85 |
9 |
Shanghai |
2424 |
0.71 |
14.85 |
0 |
12.57 |
6.85 |
10 |
Chongqing |
3102 |
0 |
2.57 |
0 |
21 |
13 |
11 |
Fujian |
3941 |
0 |
0 |
0 |
23 |
14 |
12 |
Xinjiang |
2487 |
0 |
0 |
0 |
16 |
-3 |
13 |
Ningxia |
688 |
0.28 |
0.14 |
0 |
11.42 |
-2.57 |
14 |
Shandong |
10047 |
0.28 |
0 |
0 |
7.28 |
0.71 |
15 |
Heilongjiang |
3773 |
0.14 |
0.28 |
0 |
-1.28 |
-12.28 |
16 |
Gansu |
2637 |
0 |
0.85 |
0 |
14.42 |
-0.85 |
17 |
Macao SAR |
66 |
0 |
0 |
0 |
20.85 |
17.42 |
18 |
Xizang |
344 |
0 |
0 |
0 |
18 |
14.66 |
19 |
Tianjin |
1560 |
0 |
12.28 |
0 |
11.28 |
-1.14 |
20 |
Shanxi |
3718 |
0 |
0 |
0 |
11.57 |
3.54 |
21 |
Jilin |
2704 |
0 |
1.4 |
0 |
1.14 |
-11.42 |
22 |
Xinjiang |
2487 |
0 |
0 |
0 |
4.16 |
-2.83 |
23 |
Sichuan |
8341 |
0.14 |
0.85 |
0 |
17.42 |
10.57 |
24 |
Qinghai |
603 |
0 |
0 |
0 |
8.14 |
-5.28 |
25 |
Guangdong |
11346 |
0.42 |
0.14 |
0 |
21.71 |
15.57 |
26 |
Henan |
9605 |
0 |
0 |
0.14 |
14.42 |
3.57 |
27 |
Hong Kong SAR |
745 |
4 |
0 |
0 |
20.42 |
14.85 |
28 |
Jiangxi |
4211.33 |
0 |
0.16 |
0 |
12.16 |
8.08 |
29 |
Xizang |
344 |
0 |
0 |
0 |
24.5 |
17.25 |
30 |
Hubei |
5917 |
189.85 |
59.57 |
33.14 |
14 |
6.28 |
31 |
Beijing |
2154 |
2.14 |
11.57 |
0 |
9.85 |
-1.42 |
32 |
Shaanxi |
3864 |
0 |
0 |
0 |
15 |
3.28 |
33 |
Guangxi |
4926 |
0 |
0 |
0 |
20.57 |
13.85 |
All |
Hubei |
4200.67 |
5.99 |
3.73 |
0.98 |
13.73 |
4.96 |
The objective of the experiment is to analyze the effect of temperature on the covid-19 cases including suspected, confirmed, and death in the popular cities of China (as per WHO report). The analysis is made on Temperature Þ {death, con f irmed, suspected}. In each case the null values are ignored from Table 3. Based on Equation 1, we have created three sub Tables 4 to 7 and they are graphically represented in Figure 2 to 4, where X-axis represents the cluster results of temperature with death, confirmed, and suspected and Y-axis represents the different regions.
Table{ 4, 5, 7} Ì Table 3 …… (1)
From the k-means clustering technique 34 clusters are found as shown in Table 3. Three possible patterns are revealed, as discussed in subsequent subsections.
Table (4):
K-means Cluster results on COVID-19 for death Vs Temperature.
Cluster ID |
Region |
Population (10000s) |
Death |
Highest Temp |
Lowest Temp |
|---|---|---|---|---|---|
6 |
Hainan |
934 |
0.14 |
26.71 |
20.71 |
8 |
Inner Mongolia |
2534 |
0.14 |
4.85 |
-7.85 |
26 |
Henan |
9605 |
0.14 |
14.42 |
3.57 |
30 |
Hubei |
5917 |
33.14 |
14 |
6.28 |
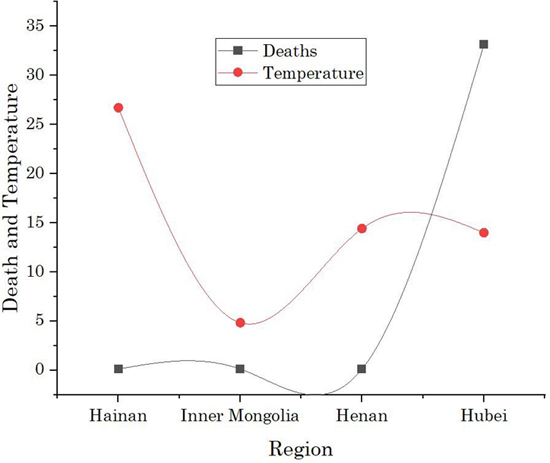
Fig. 2. Cluster results on the effect of Temperature on death cases by COVID-19
Trend 1: Effect of temperature on Death cases
From the analysis of clustering results shown in Table 4, we see the trends that Hubei has the highest number of death cases i.e., 33.14%, in Figure 2, we can see a clear jump in Hubei. After that, three regions, Hainan, Henan, and Inner Mongolia have the same death rate i.e., 0.14% at different temperatures. Out of four regions, three have death cases when the recorded temperature ≥ 14◦C. Hainan has the highest jump in temperature, but the death rate is same as with Henan and Inner Mongolia. Interestingly, Inner Mongolia has a death case at less temperature 4.85◦C compare to others.
Trend 2: Effect of temperature on Confirmed cases
Filtered cluster results manipulated in Table 5, same trend has been detected as we have seen in Table 4 that cluster#30, Hubei has the highest number of cases (confirmed) i.e., around 189.85, compare to other regions. Some regions such as Hong Kong SAR, Taipei, Beijing and Zhejiang attains value ≥ 1. While other regions such as Liaoning, Shangai, Shandong, and Sichuan have less confirmed cases. If we interrelate the cluster results with temperature value as shown in Figure 3, the trend seems there is no as such direct relationship between the temperature and confirmed Covid-19 cases. Some exception cases such as when the cluster value for Hubei temperature reaches to ≥ 14◦C then the number confirmed cases escalates higher and reaches up to 189.95. However, Table 5 shows the maximum temperature is 21.71◦C for region Guangdong but have confirmed cases are around 0.42. It is also noted from Table 5 that Guangdong is the highly populous region, which means spread the COVID-19 pandemic is controlled here by certain precautionary measures.
Table (5):
K-means Cluster results on Confirmed COVID-19 cases Vs Temperature.
Cluster ID |
Region |
Population (10000s) |
Confirmed |
Highest Temp |
Lowest Temp |
|---|---|---|---|---|---|
0 |
Zhejiang |
5913.1 |
1 |
13.1 |
6 |
2 |
Taipei and environs |
2359 |
1.71 |
19.85 |
14 |
3 |
Liaoning |
4359 |
0.57 |
6.57 |
-0.57 |
9 |
Shanghai |
2424 |
0.71 |
12.57 |
6.85 |
13 |
Ningxia |
688 |
0.28 |
11.42 |
-2.57 |
14 |
Shandong |
10047 |
0.28 |
7.28 |
0.71 |
15 |
Heilongjiang |
3773 |
0.14 |
-1.28 |
-12.28 |
23 |
Sichuan |
8341 |
0.14 |
17.42 |
10.57 |
25 |
Guangdong |
11346 |
0.42 |
21.71 |
15.57 |
27 |
Hong Kong SAR |
745 |
4 |
20.42 |
14.85 |
30 |
Hubei |
5917 |
189.85 |
14 |
6.28 |
31 |
Beijing |
2154 |
2.14 |
9.85 |
-1.42 |
Table (6):
Evidence from Primary Data Set for Hainan Region claims Suspected Covid-19 cases to Death cases without getting Confirmed.
Region |
Population (10000s) |
Confirmed |
Suspected |
Death |
|---|---|---|---|---|
Hainan |
934 |
0 |
3 |
0 |
Hainan |
934 |
0 |
1 |
0 |
Hainan |
934 |
0 |
0 |
0 |
Hainan |
934 |
0 |
0 |
0 |
Hainan |
934 |
0 |
1 |
0 |
Hainan |
934 |
0 |
0 |
1 |
Hainan |
934 |
0 |
0 |
0 |
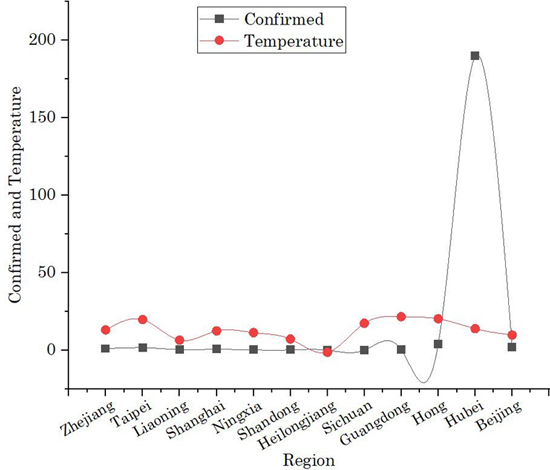
Fig. 3. Cluster results on the effect of Temperature on confirmed cases by COVID-19.
Trend 3: Effect of temperature on Suspected cases
The clustered suspected cases are presented in Table 7, for region Hubei the common trend has been seen i.e., compare to other cities. As depicted in Figure 4, this city has the highest number suspected cases. Another trend is that Hubei, afflicted at the same temperature of 14◦C, which was clearly seen in the trends of death and confirmed cases (refer to Table 4 and 5). Another trend has been explored that region Hainan is common with the clusters of death as shown in Table 4 with the temperature of 26.71◦C. The similarity in these trends is that these two cities/regions are affected at the same temperature. Here, the analytical results, stress us to argument that the suspected cases of Hainan city comes directly into the death cases, without going to confirmed phase as evidence provided in Table 6.
Table (7):
K-means Cluster results on Suspected COVID-19 cases Vs Temperature.
Cluster ID |
Region |
Population (10000s) |
Suspected |
Highest Temp |
Lowest Temp |
|---|---|---|---|---|---|
0 |
Zhejiang |
5913.1 |
0.8 |
13.1 |
6 |
3 |
Liaoning |
4359 |
18.57 |
6.57 |
-0.57 |
4 |
Yunnan |
4859.33 |
1.33 |
20.22 |
6.55 |
6 |
Hainan |
934 |
0.71 |
26.71 |
20.71 |
9 |
Shanghai |
2424 |
14.85 |
12.57 |
6.85 |
10 |
Chongqing |
3102 |
2.57 |
21 |
13 |
13 |
Ningxia |
688 |
0.14 |
11.42 |
-2.57 |
15 |
Heilongjiang |
3773 |
0.28 |
-1.28 |
-12.28 |
16 |
Gansu |
2637 |
0.85 |
14.42 |
-0.85 |
19 |
Tianjin |
1560 |
12.28 |
11.28 |
-1.14 |
21 |
Jilin |
2704 |
1.4 |
1.14 |
-11.42 |
23 |
Sichuan |
8341 |
0.85 |
17.42 |
10.57 |
25 |
Guangdong |
11346 |
0.14 |
21.71 |
15.57 |
28 |
Jiangxi |
4211.33 |
0.16 |
12.16 |
8.08 |
30 |
Hubei |
5917 |
59.57 |
14 |
6.28 |
31 |
Beijing |
2154 |
11.57 |
9.85 |
-1.42 |

Fig. 4. Cluster results on the effect of Temperature on the suspected COVID-19 cases.
In summary, from the data analysis, we found that temperature is not only the significant factor for the spread of COVID-19 pandemic. While exploring the effect of temperature in suspected, confirmed, death cases; we have seen the diverse nature of trends for each city except Hubei. We can say that other attributes are also playing the role in the COVID-19. Till now, no potential precaution has been seen except the lock-down, which has been seen in China that slowed its spread. We need to focus on developing the AI based system in the hospitals that can assist the medical doctors to monitor the communicable like COVID-19 disease patterns, serving as part of the early detection that alert the world to potential outbreaks. The future work in this area may investigate (1) analytics of taking the whole world COVID-19 data sets, (2) taking more attributes in the primary data set such as age and type of intervention for better knowledge discovery.
ACKNOWLEDGMENTS
We are thankful to the School of Engineering and Sciences, Tecnologico de Monterrey, Mexico; Jaypee University of Information Technology, India, Department of Pharmacology, Hayat Unani Medical College & Research Center, India, and Deanship of Scientific Research, Prince Sattam Bin Abdulaziz University, Alkharj, Saudi Arabia for help and support.
CONFLICT OF INTEREST
The listed author(s) declare no conflict of interest in any capacity, including competing or financial.
AUTHORS’ CONTRIBUTION
All listed author(s) have made a substantial, direct and intellectual contribution to the work, and approved it for publication.
FUNDING
None.
ETHICS STATEMENT
This article does not contain any studies with human participants or animals performed by any of the authors.
AVAILABILITY OF DATA
Not applicable.
- Bilal M, Nazir M, Parra-Saldivar R, Iqbal HM. 2019-nCoV/COVID-19 – Approaches to Viral Vaccine Development and Preventive Measures. J Pure Appl. Microbiol. 2020;14, Article Number 6168.
Crossref - Fan Y, Zhao K, Shi ZL, Zhou P. Bat Coronaviruses in China. Viruses. 2019;11: 210.
Crossref - Gates B. Responding to Covid-19-A Once-in-a-Century Pandemic? N Eng J Med. 2020.
Crossref - Gibbens S. Will warming spring temperatures slow the coronavirus outbreak? https://www.nationalgeographic.com/science/2020/02/what-happens-to-coronavirus-covid-19-in-warmer-spring-temperatures/ [Last accessed on Mar 2020, 2020]
- Hall M, Frank E, Holmes G, Pfahringer B, Reutemann P, Witten IH. The WEKA Data Mining Software: An Update. SIGKDD Explor. Newsl. 2009;11:10–18.
Crossref - Heymann DL, Shindo N. COVID-19: what is next for public health? The Lancet. 2020;395:542–545.
Crossref - Iqbal HM, Romero-Castillo KD, Bilal M, Parra-Saldivar R. The Emergence of Novel-Coronavirus and its Replication Cycle-An Overview. J Pure Appl Microbiol. 2020;14.
Crossref - Likas A, Vlassis N, Verbeek JJ. The global k-means clustering algorithm. Pattern Recognition. 2003;36: 451–461.
Crossref - Pandemic AE. Coronavirus disease (COVID-2019) RD. https://foreignpolicy.com/2020/03/09/coronavirus-economic-pandemic-impact-recession/ [Last accessed on Mar 2020, 2020]
- WHO. Coronavirus disease (COVID-2019) RD. https://www.who.int/blueprint/priority-diseases/key-action/novel-coronavirus/en/ Last accessed on Mar 2020, 2019.
- WHO. Coronavirus disease (COVID-2019) situation reports. https://www.who.int/emergencies/diseases/novel-coronavirus-2019/situation-reports Last accessed on Mar 2020, 2020.
- worldometers. Coronavirus Cases. https://www.worldometers.info/coronavirus/ Last accessed on Mar 2020, 2020.
- Xu X, Jiang X, Ma C, et al. Deep Learning System to Screen Coronavirus Disease 2019 Pneumonia. arXiv preprint arXiv. 2002.09334 2020.
- Yuan C, Yang H. Research on K-value selection method of K-means clustering algorithm. J Multidisciplinary Scientific Journal. 2019;2:226–235.
Crossref
© The Author(s) 2020. Open Access. This article is distributed under the terms of the Creative Commons Attribution 4.0 International License which permits unrestricted use, sharing, distribution, and reproduction in any medium, provided you give appropriate credit to the original author(s) and the source, provide a link to the Creative Commons license, and indicate if changes were made.