


ISSN: 0973-7510
E-ISSN: 2581-690X
The aim of this study was to evaluate the possible anti-inflammatory effect of 940nm diode laser in treating carrageenan induced arthritis in temporomandibular joint in Wistar albino rats, using different energy density of LLLT, by clinical assessment of the inflammation. it was concluded that 74J/cm2 LLLT had very efficient in edema reduction and restore function with good anti-inflammatory effect, on the other hand 171J/cm2 had appear to be in or near the borderline between non-thermal and thermal lasers eradiation in considering to Westar rat skin.
Anti-inflammatory activity, Temporomandibular joint, Wistar albino.
Temporomandibular joint disorders (TMDs) are considered as the most common non-dental-related orofacial pain conditions which are usually presents with an inflammatory component 1,2 many types of non-surgical treatments are usually used to treat TMDs to improve and enhance function and to reduce or cure symptoms 3such as physical therapy4 , drug therapy2,5, various types of occlusal splints4,6 , acupuncture7 and low level laser therapy3 which is very promising method to treat TMDs2,3,8. Carrageenan is an extract of seaweeds; Chondrus spp. and Gigartinaspp which is commonly known as Irish moss, chemically it is a sulphatedmucopolysaccharide9, for many years it had been used to induce inflammation in rat joints as in footpad , paw10 and temporo-mandibular joint2,5, carrageenan induced arthritis is the most common and reliable method to test new anti-inflammatory drugs effectiveness and assessment of new strategies to treat inflammatory arthritis2,11. Low level laser therapy (LLLT) is a light-source therapeutic method that utilize light of a single wavelength, and acts through photochemical non-thermal reactions in the cells5,12, LLLT is a good option to treat arthritis in the temporomandibular joint due to its known analgesic, anti-inflammatory and regenerative effects13, another important advantage of LLLT is patient acceptance and reduce or stop using drugs thus get rid of its side effects2,14 such as gastric ulcer and nephrotoxicity15.Previous studies have shown very good effects of LLLT of different wavelength such as 780, 850, 660 on carrageenan induced arthritis in rat TMJ2,5,15-18. The aim of this study was to clinical evaluation of the effectiveness of 940nm LLLT on carrageenan induced arthritis in Wistar albino rats TMJ, using two different energy density (171J/cm2 and 74J/cm2).
Subjects
Following approval by the Committee of the college of Dentistry of the University of Baghdad, sixty male Wistar rats (150-200g) obtained from the animal house of the higher institute of infertility diagnosis and research assisting production of the University of Al-Nahrain were used in this study. Animals kept in acrylic cages lined with wood chips and maintained at 24°C in a day/night light cycle with limitless access to food and water. Procedure was carried out in the animal house during light period of the day from 8:30 a.m. to 12:30 p.m.
Preparation and calibration of laser device
Epic X diode laser device and deep tissue handpiece were used in this experiment, the handpiece was covered with tin foil diaphragm with central 10mm radius circular opening, the tin foil diaphragm was used to cover and protect eyes and ears from laser beam. Laser power was calibrated using Laser power and energy meter (Mastero, Gentec, Quebec, Canada), in put power was set to 4 watts as manufacturer recommendation to pain therapy and the output power measured by power meter was around 1.48 watts, then the input power set at 1.6 watts and the output power were measured by the power meter which was around 0.650 watts.
Formation of the experimental groups
Animals were randomly assigned to four experimental groups as following:
Negative control group: injected by normal saline into TMJ area and applying deep tissue handpiece with 0 J/cm2 .
Positive control group: injected with carrageenan solution into TMJ area with and applying deep tissue handpiece with 0 J/cm2 .
LLLT with 171 J/cm2 group: injected with carrageenan solution into TMJ area with and applying deep tissue handpiece with 171 J/cm2 .
LLLT with 74 J/cm2 group: injected with carrageenan solution into TMJ area with and applying deep tissue handpiece with 171 J/cm2 .2
Injection of saline and applying 0 J/cm2 were made to ensure that all animals undergo the same circumstances and stressful procedures.
Carrageenan injection
Freshly prepared 1% carrageenan solution was made by dissolving carrageenan powder (Modernist, USA) in normal saline (Pioneer Co. IRAQ). The animals were anesthetized by inhalation of Diethyl ether (stab/ BHT, Netherlands) in close plastic container then hair on TMJ area were removed using hair removal cream and plastic spatula. thepostero-inferior border of the left zygomatic arch was palpated and a needle of an insulin syringe was inserted immediately below this point and then advanced in the anterior direction until reaching the postero-lateral aspect of the condyle. Then, 50 µL of the carrageenan solution was injected into the left TMJ2,5,19,20.
LLLT procedure
Low level laser therapy procedure was made transcutaneously in one contact point facing the central position of left TMJ, immediately after carrageenan injection while the animal is under anesthesia, using diode laser device ( Biolase epic X, USA) and deep tissue handpiece ( Biolase epic, USA), using wavelength 940 nm, spot radius 10mm, irradiation time 90 second and energy density for first experimental group was 171J/cm2 and 74 J/cm2 for the second experimental group, the procedure were repeated every 48 hours for the next seven days (four session of irradiation).
Clinical assessment
Each animal was weighted before the induction of arthritis and every next day till the end of experiment (eight times) to evaluate weight changes21,22, and percentage of weight changes were recorded for each animal.Circumferences of animal head were measured using measuring tape in a circle around the head just anteriorly to the ears in line over TMJs in both sides before the induction of arthritis and every next day till the end of experiment (eight times) to evaluate circumferences changes which represent edema in TMJ 23 and percentage of circumferences changes were recorded for each animal.
Statistical analysis
Data were analyzed using SigmaStat for Windows version 4.0 build 4.0.0.37, Systat, USA. and the figures were made using Microsoft office 2016. Comparison between study groups were made using one-way ANOVA and multiple post hoc comparisons were performed using the Tukey test. A probability level of less than 0.05 was considered to indicate statistical significance
Clinical assessment was done by evaluation of weight changes and edema in TMJ area caused by injection of carrageenan solution into TMJ between study groups, 128 Westar albino rats were used in this experiment divided into four study groups; negative control, positive control, 171J/cm2 LLLT and 74J/cm2 LLLT, 30 animals were randomly assigned in each experimental group and eight were died during or briefly after induction of arthritis.
Weight changes
Each animal was weighted by digital weight meter after light anesthesia early in the morning from 8-9 am from day of arthritis induction by carrageenan (day zero) and for the next seven days, statistically there was highly significant increase of weight in the negative control group (p=<0.001) and non-significant decrease in weight in positive control and 171J/cm2 laser therapy group (P = 0.903 and 0.426 respectively) and there was non-significant increase in weight in 74J/cm2 laser therapy group (table 1), a non-significant increase in weight was reported from day one to day four in LLLT group treated by 171J/cm2 laser radiation then a non-significant decrease of weight was reported till the end of the experiment (Fig. 1).
Table 1: comparison of weight changes
Table 2: comparison of weight changes
| day | Negative control | Positive control | 171 J/cm2 | 74J/cm2 | P value | ||||
| mean | SD | mean | SD | mean | SD | mean | SD | ||
| 0 | 182.103 | 22.626 | 182.241 | 29.693 | 181.241 | 18.820 | 183.172 | 30.482 | (P = 0.968) |
| 1 | 184.345 | 22.263 | 182.379 | 29.499 | 183.138 | 19.860 | 183.034 | 32.546 | (P = 0.994) |
| 2 | 189.750 | 23.266 | 179.200 | 28.490 | 186.417 | 18.354 | 183.308 | 31.638 | (P = 0.538) |
| 3 | 193.792 | 22.950 | 180.080 | 28.614 | 188.542 | 18.101 | 189.000 | 31.797 | (P = 0.322) |
| 4 | 203.316 | 21.380 | 172.750 | 23.067 | 189.632 | 16.550 | 190.143 | 30.552 | (P = 0.004) |
| 5 | 206.526 | 23.595 | 173.133 | 23.964 | 186.474 | 14.664 | 191.316 | 23.620 | (P = <0.001) |
| 6 | 206.895 | 21.807 | 173.933 | 23.819 | 182.632 | 15.334 | 194.368 | 25.771 | (P = <0.001) |
| 7 | 209.895 | 22.285 | 174.643 | 23.581 | 178.579 | 15.806 | 196.632 | 26.764 | (P = <0.001) |
Table 3:.comparison of weight changes in day four
| Comparison between | Diff of Means | t | P | P<0.050 | |
| Negative | Positive | 30.566 | 3.804 | 0.002 | Yes |
| 74J/cm2 | Positive | 17.393 | 2.214 | 0.142 | No |
| 171 J/cm2 | Positive | 16.882 | 2.101 | 0.148 | No |
| Negative | 171 J/cm2 | 13.684 | 1.781 | 0.219 | No |
| Negative | 74 J/cm2 | 13.173 | 1.757 | 0.160 | No |
| 74J/cm2 | 171J/cm2 | 0.511 | 0.0682 | 0.946 | No |
Table 4:comparison of weight changes in day five
| Comparison between | Diff of Means | t | P | P<0.050 | |
| Negative | Positive | 33.393 | 4.459 | <0.001 | Yes |
| Negative | 171 J/cm2 | 20.053 | 2.850 | 0.029 | Yes |
| 74 J/cm2 | Positive | 18.182 | 2.428 | 0.070 | No |
| Negative | 74 J/cm2 | 15.211 | 2.162 | 0.099 | No |
| 171 J/cm2 | Positive | 13.340 | 1.781 | 0.152 | No |
| 74 J/cm2 | 171 J/cm2 | 4.842 | 0.688 | 0.494 | No |
Table 5: comparison of weight changes in day six
| Comparison between | Diff of Means | t | P | P<0.050 | |
| Negative | Positive | 32.961 | 4.352 | <0.001 | Yes |
| Negative | 171 J/cm2 | 24.263 | 3.411 | 0.005 | Yes |
| 74 J/cm2 | positive | 20.435 | 2.698 | 0.035 | Yes |
| negative | 74 J/cm2 | 12.526 | 1.761 | 0.228 | No |
| 74 J/cm2 | 171 J/cm2 | 11.737 | 1.650 | 0.196 | No |
| 171 J/cm2 | positive | 8.698 | 1.149 | 0.255 | No |
Table 6: comparison of weight changes in day seven
| Comparison between | Diff of Means | t | P | P<0.050 | |
| Negative | Positive | 35.252 | 4.610 | <0.001 | Yes |
| Negative | 171 J/cm2 | 31.316 | 4.424 | <0.001 | Yes |
| 74 J/cm2 | Positive | 21.989 | 2.876 | 0.021 | Yes |
| 74 J/cm2 | 171 J/cm2 | 18.053 | 2.550 | 0.038 | Yes |
| Negative | 74 J/cm2 | 13.263 | 1.874 | 0.126 | No |
| 171 J/cm2 | Positive | 3.936 | 0.515 | 0.608 | No |
Table 7: head circumferences comparison among study groups
Day |
-ve Control
Mean±SD |
+ve control
Mean±SD |
171J/cm2
Mean±SD |
74J/cm2
Mean±SD |
P value |
0 |
82.75±7.62 |
84.12±5.49 |
85.06±4.18 |
85.12±3.48 |
0.648 |
1 |
82.8±7.61 |
96.76±3.63 |
93.47±6.38 |
92.12±3.87 |
|
2 |
83.67±8.06 |
96.75±3.86 |
92.67±6.15 |
88.5±4.08 |
|
3 |
83.8±8.18 |
96.5±3.4 |
89.17±5.1 |
87.33±3.89 |
|
4 |
84.2±9.9 |
95.43±4.12 |
89.86±5.21 |
85.71±5.15 |
0.017 |
5 |
84.2±9.95 |
95.29±4.54 |
88.57±4.54 |
85.2±4.21 |
0.027 |
6 |
84.2±9.95 |
93.86±6.39 |
88±4.43 |
85.2±4.27 |
0.093 |
7 |
84.3±9.83 |
93.67±7.42 |
87±4.4 |
84.8±3.96 |
0.131 |
Comparison of weight changes between study groups on each day of the experiment (table 2) showed a non-significant differences between them in the first four days of the experiment, but a highly significant differences were reported from day 4-7 so Pairwise Multiple Comparison Procedures using Holm-Sidak method were done to clarify the particular differences in every study group for the day 4-7.Analysis of day four (Table 3) results reveals highly significant differences in weight between negative and positive study groups (p=0.002) and non-significant differences between all other groups. In day five of the experiment; mean of weight of the positive control group was highly-significantly lower than that of negative control group (P= <0.001) and there was statistically significant decrease in weight of 171J/cm2 group in comparing to negative control ( P=0.029), regarding 74 J/cm2 groupa non-significant differences were recorded( table 4). Day six results; weight mean of positive control group continued to be highly significantly lower than that of negative control one with P= <0.001, 171 J/cm2 group also continued to be highly significantly lower than that of negative control group with P=0.005, regarding 74 J/cm2 there were non-significant differences in comparing to negative control, but there was significant increase in weight when comparing 74 J/cm2 to the positive control group with P= 0.035 as shown in table (5).in the last day of the experiment, day seven; weight differences were continued to increase between groups, regarding positive control group and 171 J/cm2 group the mean of weight in both were statistically highly significantly lower than that of negative control(P=<0.001), regarding 74 J/cm2 group there was non-significantly different from mean of negative control group, but significant increase in weight were obvious in comparing to positive and 171 J/cm2 croup and the P value were 0.021 and 0.038 respectively as shown below in table (6).
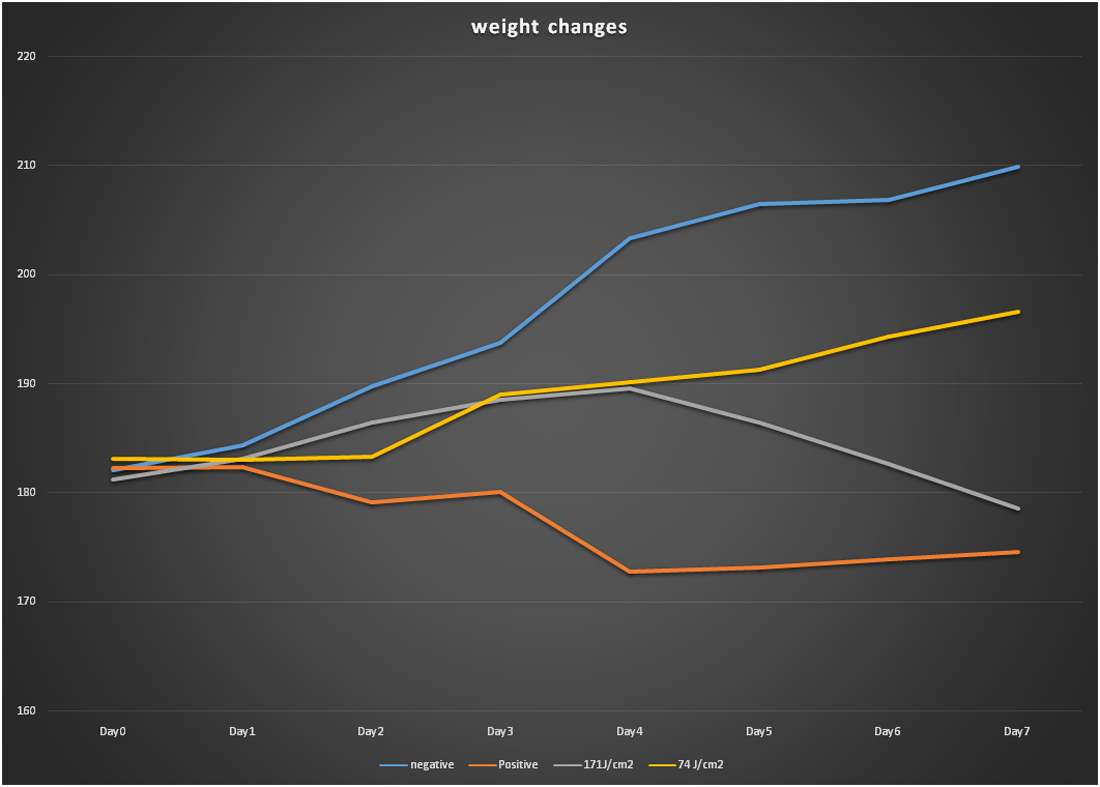
Fig. 1.Weight changes through the experiment
Edema assessment
Injection of carrageenan solution into TMJ area caused marked edema (figure 2) was obvious with naked eye, to assess the validity of LLLT treatment the circumference of rat head was measured before and every successive day to the end of the experiment (figure 3), one-way ANOVA to compare between means of head circumferences with negative control group which was injected with normal saline solution instead of carrageenan solution.
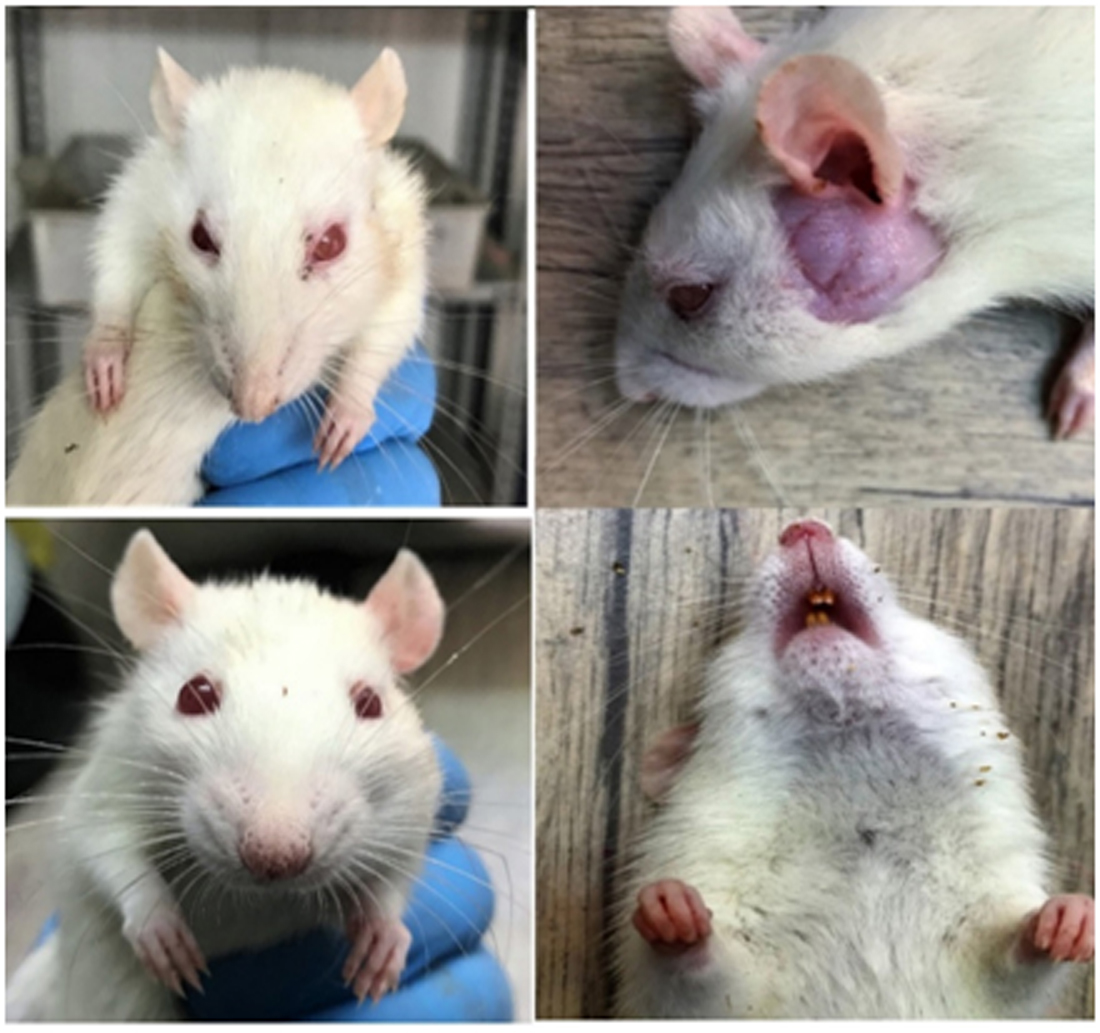
Fig. 2.Edema caused by carrageenan injection in TMJ area
The analysis of one-way ANOVA of head circumferences in day zero showed non-significant differences between study groups (P=0.648) which indicate no edema present at this moment, 24 hours later highly significant differences with P value <0.001, for the next two days till day three the same results were reported with the exact P value, then in day four and day five the differences begun to decrease but the differences still statistically significant with P value 0.017, 0.027 respectively, in the last two days of the experiment ( day 6 and 7) the decrease in differences continued to reach a non-significant level as shown in table (7).
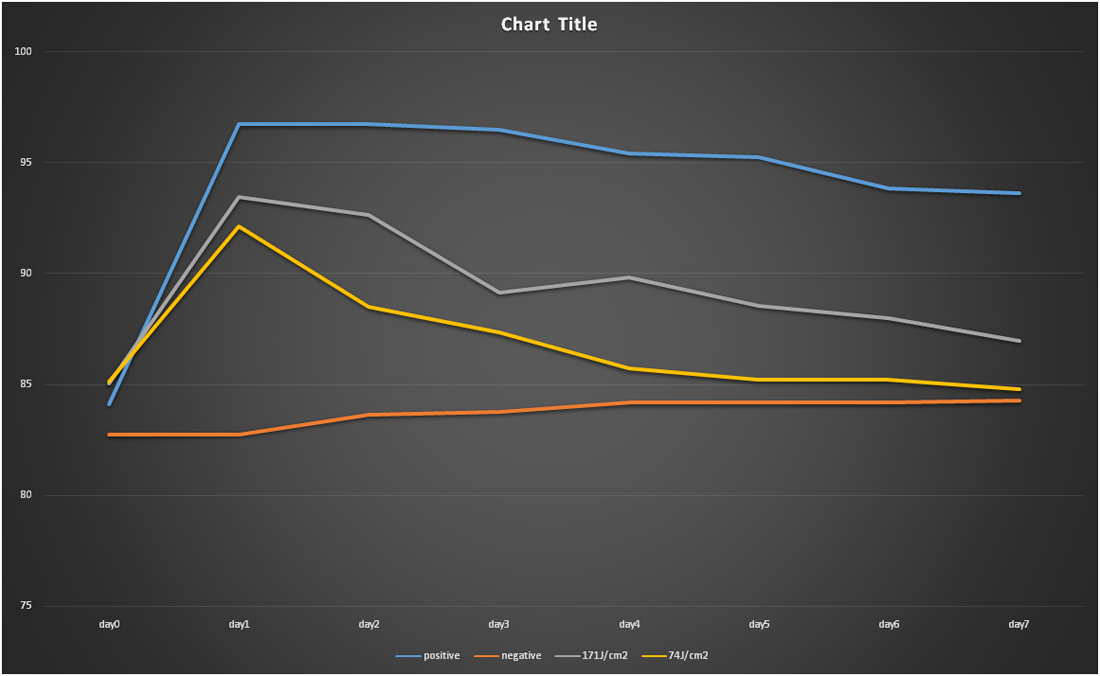
Fig. 3. Head circumference changes during the days of the experiment
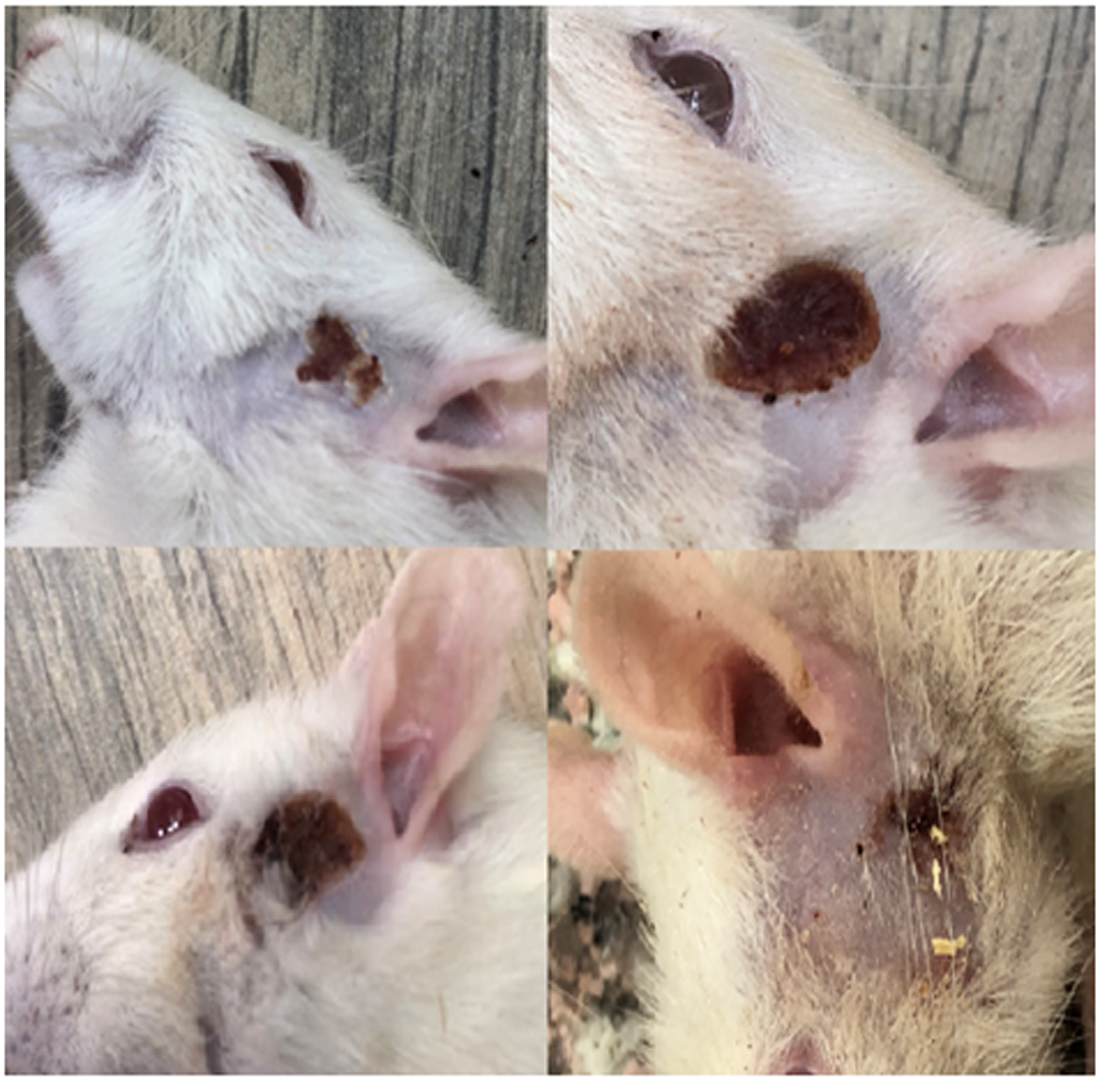
Fig. 4. Samples of burnings caused by 171J/cm2 laser therapy
Table 8: head circumferences comparison in day zero between every pairs
1st group |
2nd group |
P value |
-ve Control |
+ve control |
0.935 |
-ve Control |
171J/cm2 |
0.669 |
-ve Control |
74J/cm2 |
0.660 |
+ve control |
171J/cm2 |
0.985 |
+ve control |
74J/cm2 |
0.982 |
171J/cm2 |
74J/cm2 |
1.000 |
Table 9: head circumferences comparison in day one between every pairs
1st group |
2nd group |
P value |
-ve Control |
+ve control |
|
-ve Control |
171J/cm2 |
|
-ve Control |
74J/cm2 |
|
+ve control |
171J/cm2 |
0.435 |
+ve control |
74J/cm2 |
0.123 |
171J/cm2 |
74J/cm2 |
0.956 |
Post hoc analysis were done to compare all pair of study groups in each day of the experiment, in day zero the analysis revealed as it was expected a non-significant differences between study groups (table 8). Twenty-four hours later the numbers dramatically changed with highly significant increase of head circumferences (P=<0.001) in positive control, 171J/cm2 and 74J/cm2 groups in comparing to negative control group (table 9) which were due to the massive edema caused by carrageenan solution injected in TMJ in these groups, non-significant differences were recorded between all three group which were injected with carrageenan solution which revealed that the swelling was almost identical at this stage between them. In day two the head circumferences were still highly significantly higher in positive control and 171J/cm2 groups when compared with negative control group thus the edema was still obvious in these groups 48 hours after the initial induction of inflammation by carrageenan solution, but things were different in 74J/cm2 LLLT group, a non- significant difference with P value = 0.197 was reported between 74J/cm2 LLLT group and negative control group and highly significant differences between 74J/cm2 LLLT group and positive control group with P value =0.007 which indicate that the edema begun to subside only 48 hours after the initial induction of inflammation, also there were a non- significant difference with P value = 0.407 between 171J/cm2 and positive control which mean that this parameter are still not effective in this stage (table 10).
Table 10: head circumferences comparison in day two between every pairs
1st group |
2nd group |
P value |
-ve Control |
+ve control |
|
-ve Control |
171J/cm2 |
0.001 |
-ve Control |
74J/cm2 |
0.197 |
+ve control |
171J/cm2 |
0.407 |
+ve control |
74J/cm2 |
0.007 |
171J/cm2 |
74J/cm2 |
0.387 |
Table 11: head circumferences comparison in day three between every pairs
1st group |
2nd group |
P value |
-ve Control |
+ve control |
|
-ve Control |
171J/cm2 |
0.112 |
-ve Control |
74J/cm2 |
0.487 |
+ve control |
171J/cm2 |
0.018 |
+ve control |
74J/cm2 |
0.002 |
171J/cm2 |
74J/cm2 |
0.929 |
Table 12: head circumferences comparison in day four between every pairs
1st group |
2nd group |
P value |
-ve Control |
+ve control |
0.014 |
-ve Control |
171J/cm2 |
0.431 |
-ve Control |
74J/cm2 |
0.990 |
+ve control |
171J/cm2 |
0.526 |
+ve control |
74J/cm2 |
0.071 |
171J/cm2 |
74J/cm2 |
0.769 |
Table 13: head circumferences comparison in day five between every pairs
1st group |
2nd group |
P value |
-ve Control |
+ve control |
0.015 |
-ve Control |
171J/cm2 |
0.665 |
-ve Control |
74J/cm2 |
0.999 |
+ve control |
171J/cm2 |
0.336 |
+ve control |
74J/cm2 |
0.093 |
171J/cm2 |
74J/cm2 |
0.904 |
Day three results analysis with post hoc showed that the edema was still present in positive control group and the highly significant increase in head circumference compared to negative control group with P value =<0.001, both LLLT groups (171J/cm2 and 74J/cm2) showed non- significant differences compared to negative control and significant / highly significant lower head circumferences in comparing to positive control group indicating the edema begun to subside in both groups as shown in table (11).Post hoc analysis of day four showed significant increase in head circumference in positive control group compared to negative control group with P value =0.014, other pairs comparison results were non-significantly different compared to each other as shown below in table (12).Day five results almost the same as day before with significant increase in head diameter in positive group comparing to negative group (p= 0.015), all other pairs comparing were non-significantly different (table 13).In day six there was non-significant increase in head diameter of the positive control group in comparing to negative control group (p= 0.059) which indicated that inflammation in positive control group started to subside. All other pairs were non significantly different when compared to each other (table 14).
Table 14: head circumferences comparison in day six between every pairs
1st group |
2nd group |
P value |
-ve Control |
+ve control |
0.059 |
-ve Control |
171J/cm2 |
0.797 |
-ve Control |
74J/cm2 |
0.999 |
+ve control |
171J/cm2 |
0.518 |
+ve control |
74J/cm2 |
0.231 |
171J/cm2 |
74J/cm2 |
0.957 |
Comparison of head circumferences of all pairs in the last day of the experiment revealed non statistically significant differences between all pairs, indicating that the inflammation end in all groups (table 15). Induction of arthritis was made using the most common method used to evaluate the effects of different types of treatment protocols on inflammatory arthritis which is induction of arthritis using carrageenan solution injected directly into TMJ, carrageenan is polysaccharide obtained from sea weed, it have potent pro-inflammatory effect in animal joint when injected into the joint space11, previous studies had proof the carrageenan effectiveness in arthritis induction in TMJ of rats19,20,24,25. Pilot study revealed massive edema into TMJ area and decrease amount of food intake by rats suffering from arthritis comparing to normal rats and apparently that decrease in food consumption caused these rats look thinner, thus we made an attempt to evaluate these clinical findings caused by inducted TMJ arthritis and the effect of treatment protocol on head circumference changes caused by edema and weight changes caused by decrease food consumption due to loss proper function of inflamed TMJ.According to our knowledge there was no similar articles available that used head circumference and/or weight changes as clinical parameters for evaluating treatment protocol in induced arthritis, although several authors were report relations between similar parameters and pan-arthritis or joint arthritis (other than TMJ) in human studies as well as animal experimental studies including studies on rats, Vierboom et al., reported significant relation between weight changes and several diseases including arthritis in observational study in human26, Leech et al., found relation between lower extremities arthritis with weight and growth in human study27, Borbיly et al., mentioned significant weight loss in mouse after induction of experimental autoimmunity arthritis28,in the same way Hasan et al., reported similar weight loss in induced paw arthritis inSprague–Dawley rats using complete Freund’s adjuvant29, identical weight loss secondary to induced arthritis were reported by several authors in Westar rats induced arthritis21,22,30,32, also there were several articles used body weight as parameter to assess TMJ function as secondary outcome depending on the fact that limited mouth opening would interfere with normal feeding such as the study of Angelo et al., and Richmond who did randomized clinical trial on Black Merino sheep temporomandibular joint andMiyamoto et al., who used body weight of mice as valuable index for evaluation TMJ diseases 33,35. As mentioned above no specific head circumference measurement as parameter to evaluate TMJ edema was previously reported, but many authors used similar way to assess edema in arthritic joints by measuring diameters or volume changes, it’s good to mention some examples of these techniques; Uttra et al., used Vernier caliper to measure paw diameter to evaluate paw induced arthritis in rats31, others relied on volume changes in paws to assess induced arthritisusing displacement plethysmometry29,36,37, apparently this method can precisely measure edema progression and regression but unfortunately cannot applied in our study due to possible rat suffocation in water during the procedure hence it was anesthetized, thus our study relied on circumference measurement as parameter to assess edema in area TMJ. Before discussion inflammatory results it’s important to mention An unexpected observation noticed during this experiment in the study group treated with 171J/cm2 which is developing of red lesion of burns in the area of TMJ in 21 of the 30 rats exposed to two or more session of laser radiation(figure 4) noticed in the day after the session, none of these lesions were reported in other groups (P = <0.001), thus it was concluded that 171J/cm2 was in or near the borderline between non-thermal and thermal lasers eradiation in considering to Westar rat skin.Another observation was the slight hair growth noticed in 74J/cm2 LLLT and in rats which didn’t developed burns in 171J/cm2 LLLT group at last day of the experiment, no such growth was observed in other rats, which can be explained by biostimulation of hair follicles by LLLT38,40. The results of this study showed that irradiation of the TMJ area of rats with 940 nm diode laser with 74 J/cm2 lead to faster resolution of the inflammation regarding swelling size and normal weight gain of the rat. This laser dose didn’t cause burning or negative impact to skin overlying the TMJ area.Typically, edema is caused by intensification in vascular permeability, fluid retention, extravasation of protein and other cellular component at the site of inflammation41, LLLT with suitable dosimetry can revert these effects by increasing blood supply, clearing inflammatory agent and downgrading inflammatory response3,42,44.Slowing the process of weight gain is caused by difficulty in eating due to induced arthritis followed by limited mouth opening33. Using the lower laser setting of 74 J/cm2 had led to nearly normal weight gain which was close to the negative control group. This finding further support the results of rat head circumference (edema suppression). This means that the reduction in the head circumference passing the TMJ area has led to normal mouth opening and normal feeding process45. on the other hand, LLLT using 171J/cm2 caused initial good result when edema decreased and body weight was somewhat identical to 74J/cm2 till day four when result begun to change and weight started to decrease reaching similar level of positive control group, these finding can be due to burnings in TMJ area occurred in some of the rats which was an indication that this dose represents the threshold settings. This finding accomplices with Arndt-Schulz law which states that biostimulation falls in a window area and doses over this window will have no or even adverse effect to the biological tissues46.
Table 15: head circumferences comparison in day seven between every pairs
1st group |
2nd group |
P value |
-ve Control |
+ve control |
0.100 |
-ve Control |
171J/cm2 |
0.934 |
-ve Control |
74J/cm2 |
1.000 |
+ve control |
171J/cm2 |
0.445 |
+ve control |
74J/cm2 |
0.253 |
171J/cm2 |
74J/cm2 |
0.983 |
The results of this study demonstrate that LLLT using 74J/cm2 have a very powerful anti-inflammatory effect on inflamed TMJ.
We gratefully acknowledge the all kind of technical supports from the Department of oral diagnosis, College of Dentistry, University of Baghdad, Baghdad, Iraq.
The authors declare that they have no conflict of interests
- Hutchins, B., et al., Calcitonin gene-related peptide and substance P immunoreactivity in rat trigeminal ganglia and brainstem following adjuvant-induced inflammation of the temporomandibular joint. Arch Oral Biol,, 2000; 45(4): 335-45.
- Carvalho, C.M., et al., Evaluation of laser phototherpy in the inflammatory process of the rat’s TMJ induced by carrageenan. Photomed. Laser Surg, 2011; 29(4): 245–254.
- de Freitas Patrםcia M. and S. Alyne, Lasers in Dentistry, Guide for Clinical Practice. 2015: WILEY Blackwell.
- Ingawale, S. and T. Goswami, Temporo-mandibular joint: disorders, treatments, and biomechanics. Ann Biomed. Eng., 2009. 37(5): 976-96.
- Barretto, S.R., et al., Evaluation of anti-nociceptive and anti-inflammatory activity of low-level laser therapy on temporo-mandibular joint inflammation in rodents. J Photochem Photobiol B, 2013; 129: 135-42.
- Glick, m., Burket’s Oral Medicine. 12th edition. Shelton, Connecticut: People’s Medical Publishing House—USA, 2015.
- McNeely, M.L., S. Armijo Olivo, and D.J. Magee, A systematic review of the effectiveness of physical therapy interventions for temporomandibular disorders. Phys. Ther., 2006; 86(5): 710-25.
- de Almeida, P., et al., Low-level laser therapy and sodium diclofenac in acute inflammatory response induced by skeletal muscle trauma: effects in muscle morphology and mRNA gene expression of inflammatory markers. Photochem Photobiol, 2013; 89(2): 501-7.
- Hansra, P., et al., Carrageenan-induced arthritis in the rat. Inflammation, 2000; 24(2): 141-55.
- Vinegar, R., et al., Pathway to carrageenan-induced inflammation in the hind limb of the rat. Fed. Proc., 1987. 46(1): 118-26.
- Peter Szabo, M., et al., Quantitative characterization of a repeated acute joint inflammtion model in rats. Clin. Exp. Pharmacol. Physiol., 2007; 34: 520–526.
- T., K., Photobiological fundamentals of low power laser therapy. IEEE J. Quantum. Electron, 1987; 23: 1703–1718.
- Tune´r, J. and L. and Hode, The Laser Therapy Handbook Grangesberg: Prima Books, 2004.
- Brugnera Junior. A, a.P., A.L.B., Lasers na Odontologia Moderna. Lasers in Modern Dentistry]. 1998, Sa˜o Paulo,: Ed. Pancast.
- Ishimaru, J.I., et al., Effects of a single arthrocentesis and a COX-2 inhibitor on disorders of temporomandibular joints. A preliminary clinical study. Br. J. Oral Maxillofac Surg., 2003; 41(5): 323-8.
- de Castro, I.C., et al., Assessment of different energy delivery settings in laser and LED phototherapies in the inflammatory process of rat’s TMJ induced by carrageenan. Lasers Med. Sci., 2015; 30(8): 2105-13.
- Prianti, A.C., Jr., et al., Low-level laser therapy (LLLT) reduces the COX-2 mRNA expression in both subplantar and total brain tissues in the model of peripheral inflammation induced by administration of carrageenan. Lasers Med. Sci., 2014; 29(4): 1397-403.
- Silva, M.P., et al., Inhibition of carrageenan-induced expression of tissue and plasma prekallikreins mRNA by low level laser therapy in a rat paw edema model. Rev. Bras. Fisioter, 2011; 15(1): 1-7.
- Zanelatto, F.B., et al., Anti-inflammatory effects of propranolol in the temporo-mandibular joint of female rats and its contribution to antinociceptive action. Eur. J. Pain, 2018; 22(3): 572-582.
- de Araujo, J.C.B., et al., Inflammatory pain assessment in the arthritis of the temporomandibular joint in rats: A comparison between two phlogistic agents. J. Pharmacol Toxicol Methods, 2017; 88(1): 100-108.
- Ruckmani, A., et al., Anti-rheumatoid activity of ethanolic extract of Sesamum indicum seed extract in Freund’s complete adjuvant induced arthritis in Wistar albino rats. J. Tradit. Complement Med., 2018; 8(3): 377-386.
- Zheng, T., et al., Metabolomic Analysis of Biochemical Changes in the Serum and Urine of Freund’s Adjuvant-Induced Arthritis in Rats after Treatment with Silkworm Excrement. Molecules, 2018; 23(6).
- Suresh, P., et al., Effect of ethanol extract of Trigonella foenum graecum (Fenugreek) seeds on Freund’s adjuvant-induced arthritis in albino rats. Inflammation, 2012; 35(4): 1314-21.
- Goulart, A.C., et al., Study of the inflammatory process induced by injection of carrageenan or formalin in the rat temporomandibular join. Braz. Oral Res., 2005; 19: 99–105.
- Rivanor, R., et al., A lectin fraction from green seaweed Caulerpa cupressoides inhibits inflammatory nociception in the temporomandibular joint of rats dependent from peripheral mechanisms. Int. J. Biol Macromol, 2018; 115: 331-340.
- Vierboom, Y.C., S.H. Preston, and A. Stokes, Patterns of weight change associated with disease diagnosis in a national sample. PLoS One, 2018; 13(11): e0207795.
- Leech, R.D., et al., Lower extremity osteoarthritis: optimising muscul-oskeletal health is a growing global concern: a narrative review. Br. J. Sports Med., 2018.
- Borbely, E., et al., Complex Role of Capsaicin-Sensitive Afferents in the Collagen Antibody-Induced Autoimmune Arthritis of the Mouse. Sci. Rep., 2018; 8(1): 15916.
- Hasan, U.H., et al., Inhibitory effects of Clematis orientalis aqueous ethanol extract and fractions on inflammatory markers in complete Freund’s adjuvant-induced arthritis in Sprague-Dawley rats. Inflammopharmacology, 2018.
- Tong, Z., et al., Therapeutic effects of Caesalpinia minax Hance on complete Freund’s adjuvant (CFA)-induced arthritis and the anti-inflammatory activity of cassane diterpenes as main active components. J. Ethnopharmacol, 2018; 226: 90-96.
- Uttra, A.M., et al., Ephedra gerardiana aqueous ethanolic extract and fractions attenuate Freund Complete Adjuvant induced arthritis in Sprague Dawley rats by downregulating PGE2, COX2, IL-1beta, IL-6, TNF-alpha, NF-kB and upregulating IL-4 and IL-10. J. Ethnopharmacol, 2018; 224: 482-496.
- Lin B, et al., Inhibitory effects of the root extract of Litsea cubeba (lour.) pers.on adjuvant arthritis in rats. J. Ethnopharmacol, 2013;147: 327–334.
- Angelo, D.F., et al., Preclinical randomized controlled trial of bilateral discectomy versus bilateral discopexy in Black Merino sheep temporomandibular joint: TEMP-OJIMS – Phase 1- histologic, imaging and body weight results. J. Craniomaxillofac Surg., 2018; 46(4): 688-696.
- Miyamoto, H., et al., A sheep model for temporomandibular joint ankylosis. J. Oral Maxillofac Surg., 1999; 57(7): 812-7.
- Richmond, J., Refinement, reduction, and replacement of animal use for regulatory testing: future improvements and implementation within the regulatory framework. ILAR J., 2002; 43: S63eS68.
- Alamgeer Uttra AM and H. UH, Anti-arthritic activity of aqueous-methanolic extract and various fractions of Berberis orthobotrys. Bien ex Aitch. BMC Complement Altern Med., 2017; 55: 17: 371.
- Gomaa A, et al., Enhancement of the anti-inflammatory and anti-arthritic effectsof theophylline by a low dose of a nitric oxide donor or nonspecific nitric oxide synthase inhibitor. British J. Pharmacol, 2009; 158: 1835–1847.
- Faghihi, G., et al., The effectiveness of adding low-level light therapy to minoxidil 5% solution in the treatment of patients with androgenetic alopecia. Indian J. Dermatol Venereol Leprol, 2018; 84(5): 547-553.
- Tin, S.S. and V. Wiwanitkit, Low-level laser therapy for androgenic alopecia. International journal of trichology, 2014; 6(4): 189-189.
- Cho, S.B., et al., Therapeutic efficacy and safety of a 1927-nm fractionated thulium laser on pattern hair loss: an evaluator-blinded, split-scalp study. Lasers Med. Sci., 2018. 33(4): 851-859.
- Bose, M., et al., Suppression of NF-iB p65 nuclear translocation and tumor necrosis factor-a by Pongamia pinnata seed extract in adjuvant-induced arthritis. J. Immunotoxicol, 2014. 11: 222-230.
- Maegawa, Y., et al., Effects of near-infrared low-level laser irradiation on microcirculation. Lasers Surg Med., 2000. 27(5): 427-37.
- K. Mizutani, Y.M., K. Wakae, T. Kobayashi, M. Tobe, K. Taira, T. Harada,, A clinical study on serum prostaglandin E2 with low-level laser therapy. Photomed. Laser Surg., 2004; 22: 537–539.
- Z. Simunovic, Low level laser therapy with trigger points technique: a clinical study on 243 patients. J. Clin. Laser Med. Surg, 1996; 14: 163–167.
- Baeza-Velasco, C., et al., Difficulty eating and significant weight loss in joint hypermobility syndrome/Ehlers-Danlos syndrome, hypermobility type. Eat Weight Disord, 2016. 21(2): p. 175-83.
- Chang, C.M., et al., An optical system via liquid crystal photonic devices for photobiomodulation. Sci. Rep., 2018; 8(1): 4251.
© The Author(s) 2019. Open Access. This article is distributed under the terms of the Creative Commons Attribution 4.0 International License which permits unrestricted use, sharing, distribution, and reproduction in any medium, provided you give appropriate credit to the original author(s) and the source, provide a link to the Creative Commons license, and indicate if changes were made.