


ISSN: 0973-7510
E-ISSN: 2581-690X
Infection with tuberculosis (TB) has been a leading cause of death worldwide. The accurate detection of Mycobacterium tuberculosis (M. tuberculosis) is integral for the prevention and control programs for TB disease. Host-encoded microRNAs (miRNAs) are known to be triggered upon TB infection, raising possibilities of their utility as biomarkers. Here, we investigated the value of miRNAs in pointing active TB (ATB) and predicting the progression from latent TB (LTB) to ATB infection. We then constructed signaling pathways predicted to be involved in TB disease pathobiology. Our analyses identified miR-21-5p, miR-29a-3p and miR-361-5p as being down regulated in ATB and upregulated in LTB compared to healthy subjects with an area under the curve (AUC) of > 0.9, indicating potentially promising biomarker. Pathways related to estrogen signaling, TNF and apoptosis signaling were enriched targets for those miRNAs. This study provides evidence for the significance of miRNA as diagnostic and prognostic markers for ATB and LTB infections in humans. These results could be extrapolated and validated using future large-scale studies.
Pulmonary Tuberculosis, MicroRNAs, Small Non-coding RNAs, Biomarkers
Tuberculosis (TB) is a fatal disease caused by Mycobacterium tuberculosis (M. tuberculosis). It is considered by the World Health Organization (WHO) to be the tenth leading cause of death all over the world and the first leading cause of death from a single infectious agent (outranking HIV/AIDS).1 Currently, there are ~1.3 million deaths from tuberculosis in 2020 with an increased trend compared to 2019 due to concurrent COVID-19 pandemics.1 Nevertheless, the number of people diagnosed with TB witnessed 21% reduction falling from 7.1 million case in 2019 to 5.8 million in 2020, indicating, in part, a diminish in the diagnostic power of the current protocols. In clinical and public health settings, TB infections are classified into active TB (ATB) and latent TB (LTB). Indeed, initial invasion of TB bacilli leads to various scenarios depending on a particular host-pathogen interaction. Some individuals could clear the infection by mounting innate or acquired immune response. In LTB, the persons experience persistent infection, with the bacilli remaining in quiescent state surrounded by immune system arms (macrophages, dendritic cells and T-cells) that confined the infection in a granulomatous lesions.2 In some LTB-infected patients, who suffer chronic diseases or immunosuppression, the infection could progress to symptomatic progressive ATB in a period that might be as short as one week or as long as decades. Individuals can advance or reverse position between ATB and LTB depending on many host and pathogen factors, yet to be identified. The interaction between M. tuberculosis and host immune cells is the key to the effective prevention of infection or an ineffective immune response and bacterial persistence.
The host response to tuberculosis infection is not only limited to the expression changes in mRNA genes3 and proteins4,5 but also to other non-coding RNA components. Indeed, non-coding RNA represent the majority (~ 87) of the transcribed RNA in eukaryotic cells,6 yet they surprisingly have received much less research than protein coding genes with regard to their involvement in shaping the host response to infection. MicroRNAs (miRNAs) are a major class of small non-coding RNAs with (~22 mts. in length) that are not translated into protein, yet they regulate gene expression at post-transcriptional level by binding to the 3’ untranslated region (UTR) of the expressed mRNA genes.7 With that, miRNAs are highly involved in multiple cellular processes, cell cycle control, apoptosis,8 as well as several developmental processes.9 With M. tuberculosis being a major human pathogen, host-encoded miRNAs are known to be induced and reprogrammed during infection with TB.7 They can regulate the function of macrophages, dendritic cells and NK cells.10 T-cell differentiation11 and lung injury and fibrosis.12
The changes in miRNA expression upon TB infection have been extensively reported in literature.13-17 Revealing the nature of perturbation in miRNA expression during infection could provide insights into important miRNA players in various pathophysiological mechanisms of disease. It could also aid in identifying candidate miRNAs that mark the initiation of ATB disease or inform about possible progression from ATB to LTB.
From a diagnostic point of view, there are many available assays for TB, yet each of them comes with its own limitations. For instance, detecting the bacilli in the sputum lacks sensitivity (between 36-43% sensitivity),18 do not suit diagnosing pediatric tuberculosis due to inability to obtain sputum samples,19 and revealed false negative results in latent or subclinical infections.20 Culturing the microbe usually takes long time posing a significant delay in starting antibiotic therapy and is usually negative in LTB.20 Using interferon-gamma release assay (IGRA) and tuberculin skin test (TST) gave positive results in some persons, who eliminate the infection,20 and their positivity is proven in both ATB and LTB infections with no distinction.21 Given the importance of miRNA-driven transcriptional regulation during TB disease and the presence of lacks in the accuracy of current TB diagnostics, the aim of this study was to evaluate the importance of selected miRNA candidates as diagnostic and prognostic markers for TB disease and to unravel signaling pathways that are predicted to be regulated by them. The analyses identified a set of miRNAs that hold strong promise as potent diagnostic biomarker for ATB, and other miRNAs that are indicator of disease progression. The knowledge gained from this study should be considered when seeking out novel diagnostics for TB infection and progression as a part of the efforts geared towards tackling tuberculosis infection in humans.
Ethical statement
The Local Committee of Bioethics of Jouf University, Kingdom of Saudi Arabia approved the study (approval no: 1-01-43) and an Informed ethical consent was obtained from participants prior to sampling.
Selection of candidate miRNAs
The miRNAs analyzed in the current study (Table 1) included only their mature (functional) strand (according to miRbase version 22.22 These were selected using literature search based on their importance, involvement in TB pathogenesis in humans,23,24 and their potential as biomarker discriminating TB varieties in multiple samples.25 We run bioinformatic target prediction analyses, and found that the studied miRNAs have experimentally validated target genes in Bioinformatics tools including DIANA microT,26 miRDB27 and miRTarBase28 databases.
Table (1):
Characteristics of the studied miRNAs
miRNA name |
miRBase ID* |
Sequence |
Length (bp) |
Ref. |
|---|---|---|---|---|
miR-155-5p |
MIMAT0000646 |
UUAAUGCUAAUCGUGAUAGGGGUU |
23 |
[11, 40, 46] |
miR-21-5p |
MIMAT0000076 |
UAGCUUAUCAGACUGAUGUUGA |
21 |
[64-66] |
miR29a-3p |
MIMAT0000086 |
UAGCACCAUCUGAAAUCGGUUA |
21 |
[46, 67, 68] |
miR-361-5p |
MIMAT0000703 |
UUAUCAGAAUCUCCAGGGGUAC |
21 |
[46, 50] |
miR-212-3p |
MIMAT0000269 |
UAACAGUCUCCAGUCACGGCC |
20 |
[69] |
*miRNA IDs are according to miRbase version22
Study site and selection of human subjects
The study was conducted at the Chest Department, Menoufiya University Hospital, Menoufiya province, Egypt, during the period from July 2020 to February 2021. Thirty subjects were included in this study. The subjects were categorized into three main groups, patients with active TB (ATB); n = 10, subjects with latent TB (LTB); n = 10 and healthy controls (HC); n = 10. Persons were considered having ATB if they have at least one of the following criteria:
- Clinical and radiological findings consistent with typical TB disease and positive sputum smears for the M. tuberculosis on at least two separate occasions.
- Identification of M. tuberculosis in sputum, bronchial lavage and pleural fluid or findings from organ systems other than the lung (urine, semen, cerebrospinal fluid, etc.)
- Pathological confirmation in biopsy specimens (lymph node and lung)
To assign individuals to LTB and healthy controls, QuantiFERON-TB Gold (QFT) test (Qiagen, Chadstone, Victoria, Australia, Cat. No 0594-0201) was done on a set of health care personnel, who did not show any symptoms or signs of ATB and had no history of ATB infection. Those who revealed positive results for QuantiFERON-TB gold test were grouped as LTB and those with negative results were considered as healthy control groups.
Blood sample collection
Five milliliters of blood were collected from each participant into EDTA tubes and transported to the Central Laboratory, Faculty of Medicine, Menoufia University, Menoufia province, Egypt. Samples were then centrifuged at 3000 rpm for 10 min and plasma were aliquoted into 2 ml screw-cap tubes and stored at −30°C until further use.
RNA extraction and Reverse transcription
Total RNA was extracted and purified from plasma using miRNAs mini kit (Qiagen, Inc., Valencia, USA) according to the manufacturer’s instructions. The extracted RNAs were evaluated for quality and quantity using Nanodrop (ThermoFisher Scientific) and Bioanalyzer (G2939BA, Agilent) and only samples with RNA integrity number (RIN) number ≥ 9 were used in further steps. To obtain complementary DNA (cDNA), the extracted RNA was reverse transcribed using TaqMan MicroRNA Reverse transcription kit (Cat. No. 4366596, Applied Biosystem) in Veriti thermal cycler, applied biosystem under the following conditions: 16°C for 30 minutes, 42°C for 30 minutes and 85°C for 5 minutes.
Quantitative Real-time PCR (qRT-PCR) and differential expression analysis of microRNA
The cDNA was used as a template for the real-time PCR amplification. Primers for the target miRNAs (Table 1) were readily designed and provided as primer assays from Qiagen. The amplification was conducted using the TaqMan Universal PCR Master Mix II kit (Cat. No. 4326708, Applied Biosystem) in Rotor Gene Q (Qiagen) thermal cycler under the following conditions: Initial denaturation (95°C for 10 minutes), 45 cycles, each entails denaturation (95°C for 15 seconds), annealing (60°C for 60 seconds) and final extension (72 for 1 min.). Primer specificity was determined by serial dilution of the cDNA and assessing the melting curves. The reaction mix (20 µl) was prepared as follow: 10 µl TaqMan Universal PCR Master Mix + 1 µl primer assay + 9 µl template DNA. Each sample was run in 2 technical repeats. The average values of SNORD-68 and RNU-6 genes were used as the reference gene for normalization.29,30 The RT-qPCR produced a single peak in the melting curves and no secondary peaks were observed in the subsequent miRNA dissociation curves.
The fold change values were calculated based on the CT values of the analyzed miRNAs and on that of the SNORD-68 and RNU-6 small non-coding RNAs. The relative expression levels of the candidate miRNAs were determined using the comparative Ct method, also known as 2-delta (Ct) method.30
Biostatistics and Receiver operating characteristic curve (ROC) analyses
Before running statistical analyses, data normality for all miRNAs were evaluated using Shapiro-Wilk test. We used Kruskal-Wallis test, followed by dunn’s multiple comparison and chi-2 tests to compare numerical and categorical variables, respectively. Receiver operating characteristic curve (ROC) was used to assess the diagnostic performance of individual miRNAs. Heatmap supported by clustering dendrogram was created using the package ‘Pheatmap’ in R software.31 To visualize and estimate the clustering pattern of the patients, non-metric multidimensional scaling (nMDS) based on Euclidean distance was generated using VEGAN package in R software.32 To reveal the predicted functionality and network association of the miRNAs, target mRNAs for the studied miRNAs were firstly retrieved from three commonly used miRNA target databases (i.e. mirDIP v.4,33 Target scan v.8,34 and miR-path v.3 within DIANA tool,35 and the shared predicted targets among these tools were then used as inputs in the pathway enrichment analyses. Factors used to define the targets are built-in in each tool and include adj-P values and minimum free energy. Pathway analyses were retrieved using ClueGo in cytoscape software V 3.9.1.36 In cytoscape, we depended on updated versions of both the KEGG pathway,37 and reactome38 databases. Venn diagram was used to identify and visualize common and unique pathways regulated by miRNAs.
Patient demographic characteristics and co-morbidities
As shown in Table 2, the range of ages in the HC groups was 17 (28-45), that of ATB was 31 (24-55) and that of LTB was 25 (26-51). LTB group has the highest average age followed by ATB and HC groups. However, subjects belonging to the 3-groups did not differ significantly in age (P-value > 0.05). There were also no significant differences in gender distribution among the 3-groups (P-value >0.05). The occurrence of diabetes and being smokers was distributed equally among the 3-groups (2 individual per group). Smoking as well as all the co-morbidities did not differ significantly among the analyzed groups.
Table (2):
Demographic and clinical criteria for the study participants
| Features | HC n = 10 | ATB n = 10 | LTB n = 10 | P-value* | |
|---|---|---|---|---|---|
| Gender | Male | 7 | 6 | 8 | 0.6 |
| Female | 3 | 4 | 2 | ||
| Age (median ± SD) | 38 ±5.9 | 37.5 ±8.3 | 40 ±7.8 | 0.8 | |
| Smoking | Smokers | 4 | 4 | 4 | >0.9 |
| Non-smokers | 6 | 6 | 6 | ||
| Comorbidities | Diabetes | 2 | 2 | 2 | >0.9 |
| Hypertension | 1 | 2 | 1 | 0.7 | |
| Pneumonia | 0 | 2 | 0 | 0.1 | |
| Emphysema | 0 | 1 | 0 | 0.3 | |
| Bronchial asthma | 1 | 1 | 2 | 0.7 | |
| No chest diseases | 9 | 6 | 8 | 0.2 | |
*P-value were calculated using chi-2 test (for comparing categorical variables) and one-way ANOVA (for comparing ages among the groups)
Expression of miRNAs in healthy controls and TB subjects (ATB and LTB)
Figure 1 shows expression levels of miRNAs in various groups. Compared to the HC groups, expression of miR-21-5p showed significant downregulation in the ATB group (P-value < 0.0001) while showing non-significant differences in the LTB. On the other hand, its expression in the LTB was significantly higher than that in the ATB group (P-value < 0.0001). miR-29a-3p followed a similar trend: compared to its expression in HC group, it was significantly down expressed in ATB group (P-value <0.0001), but no significant differences were found in the LTB group. However, its expression in the LTB was significantly higher than that in the ATB group (P-value <0.0001). Regarding miR-361-5p, its expression level in ATB (P-value <0.0001) was significantly lower than that in HC. There was non-significant difference in its expression in LTB compared to the HC. In addition, its expression level in LTB was significantly (slightly) higher than that in ATB (P-value = 0.01). The other two miRNAs (miR-155-5p and miR-212-3p) did not show any significant differences between any of the studied groups.
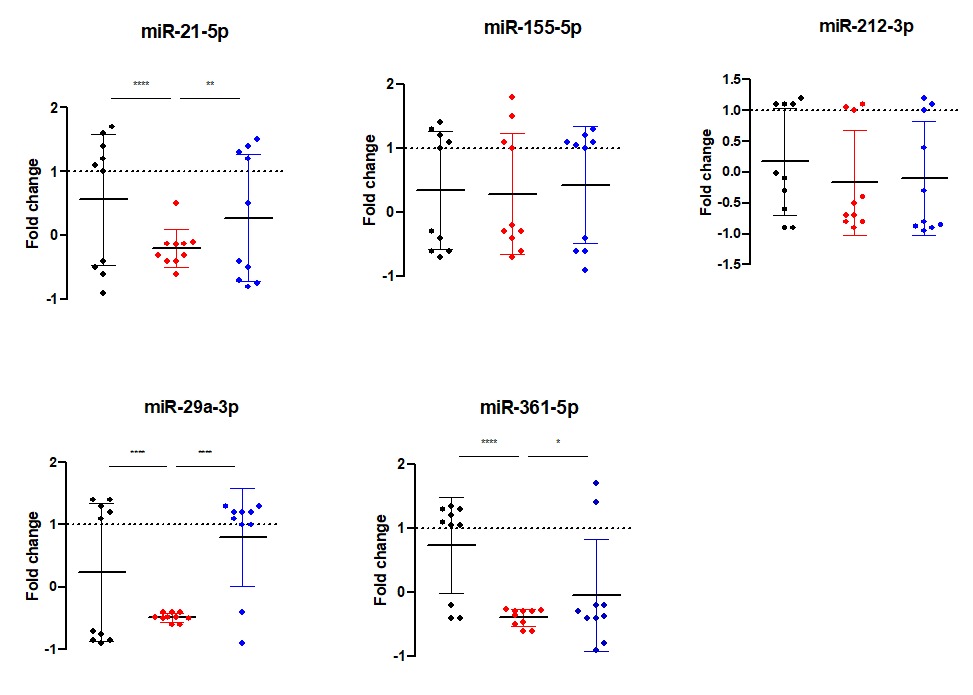
Figure 1. Expression levels of miRNA shown as fold change value in healthy controls (HC), Active TB (ATB) and latent TB (LTB) subjects. Each dot refers to the fold change value of the respective miRNA in one subject. Asterisks denote significant differences in miRNA expression among the groups at a P-value threshold of 0.05. The cutoff levels are: * (P-value < 0.05), ** (P-value < 0.01), *** (P-value < 0.001), **** (P-value < 0.0001)
Hierarchical clustering of HC and TB subjects
Based on similarity and pattern of their expression levels in the studied subjects, miR-361-5p, miR-21-5p and miR29a-3p formed one cluster (upper dendrogram), apart from miR-212-3p and miR-155-5p, each of which formed a separate branch (Figure 2A). Using the expression values of the miRNAs, the participants fall into 2-main clusters: the first cluster (C1) contained all the ATB subjects (n = 10) along with half of the LTB (n =5) subjects and 20% (n =2) of HC. The other cluster (C2) contains 80% (n = 8) of the HC and the other half of the LTB (n = 5) subjects. The results of nMDS analyses (Figure 2B) further clarify and support the heatmap analysis and showed significant separation among groups (P-value < 0.001). There was considerable overlap between HC and LTB groups, slight overlap between ATB and LTB groups, whereas no overlap exists between HC and ATB groups.

Figure 2. Overview of the miRNA expression levels and hierarchical clustering of studied subjects and miRNA. A. Heat map showing the clustering of the individuals (the dendrogram) based on the CT values of the studied miRNAs as shown in the color scale. B. Non-metric multidimensional scaling (nMDS) showing the degree of overlap among the 3-group of individuals (HC, ATB and LTB) shown as different colors with the subject gender represented as different shapes. The distance between pairs of points (individuals) are the calculated Euclidean distance from the nMDs. Fold change-value represents the significance of separation among clusters using permutational multivariate ANOVA (PERMANOVA) test. The stress value of 0.1 indicates reaching a satisfactory solution for the 2-dimension
Biomarker evaluation of miRNAs using ROC analyses
To reveal the biomarker potential of miRNAs, ROC analyses were done for each miRNA when comparing HC versus ATB (Figure 3A), HC versus LTB (Figure 3B) and ATB versus LTB (Figure 3C). When comparing HC versus ATB, miR-361-5p scored the highest AUC equal to 1. Both miR-29a-3p and miR-21-5p revealed an AUC of 0.9 with different cutoff CT values at which sensitivity and specificity reach the maximum. MiR-212-3p and miR-155-5p have lower AUC (0.7, 0.6, respectively). When comparing HC versus LTB, all studied miRNAs have AUC between 0.7-0.5. When comparing ATB and LTB, miR-29a-3p, miR-21-5p and miR-361-5p obtained the highest AUC being 0.9, 0.9 and 0.8, respectively. MiRNAs that are considered important biomarkers are labeled in Figure 4.
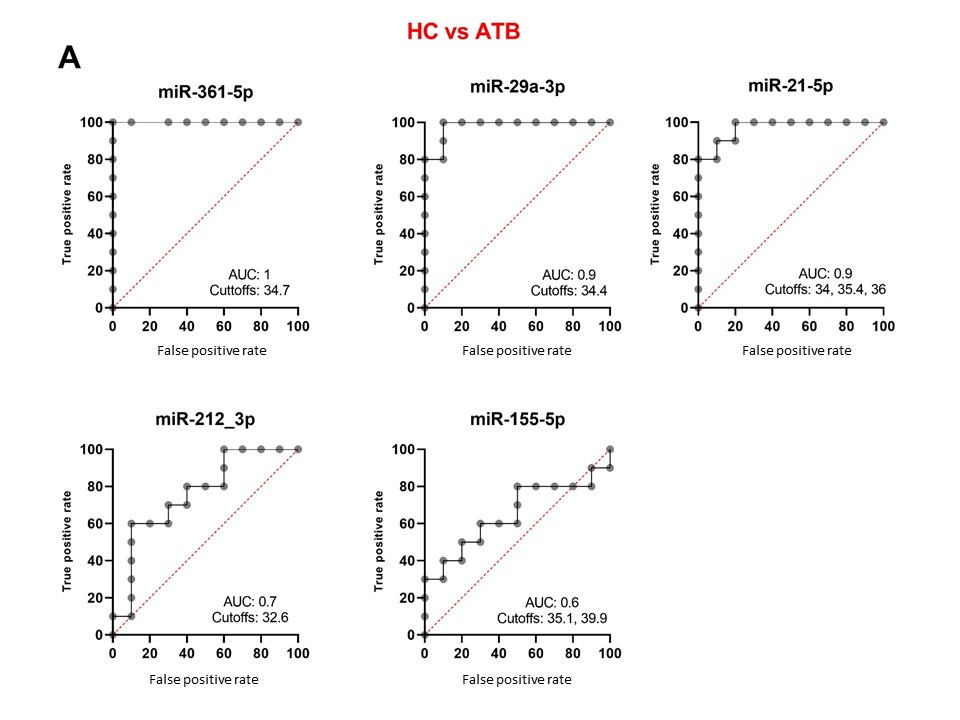
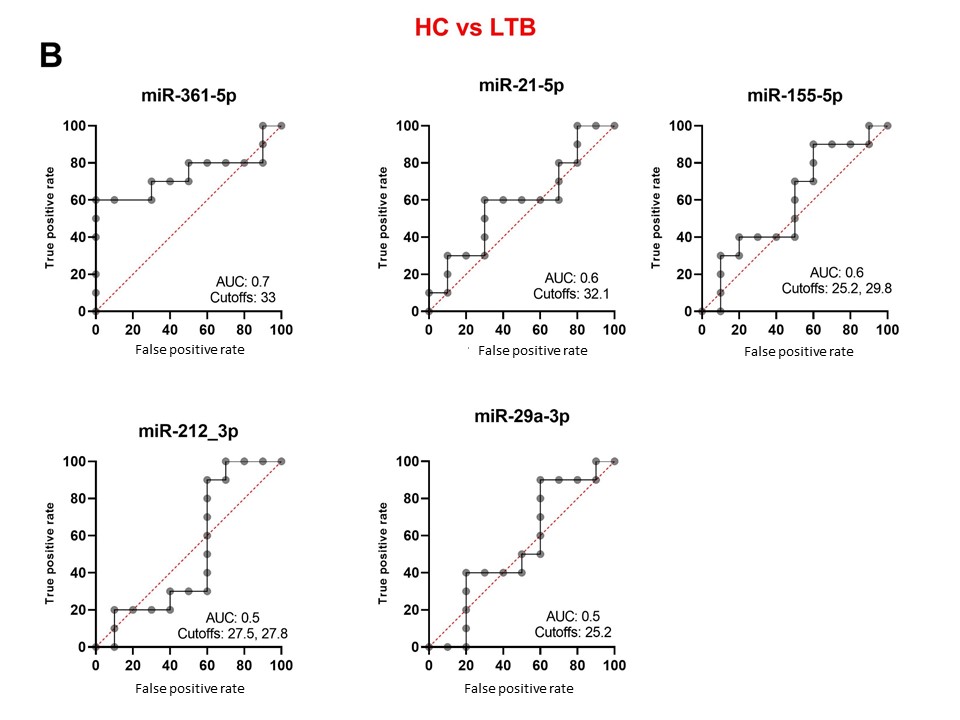
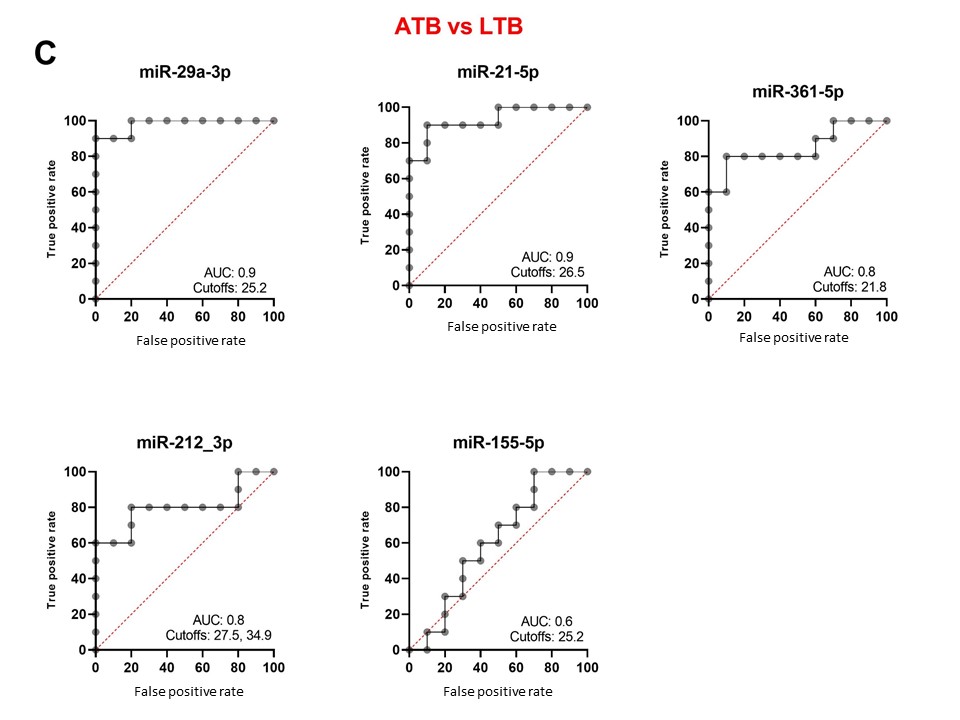
Figure 3. Receiver operating characteristic (ROC) curve analyses of individual miRNAs when comparing HA versus ATB (A), HC versus LTB (B) and ATB versus LTB (C). AUC: area under the curve. Cutoff values refer to the fold change of miRNAs have the highest sensitivity and specificity in discriminating the compared groups

Figure 4. Scatter plot showing the biomarker evaluation of the studied miRNAs. Each dot is one miRNA, X-axis shows the differential expression value (Ratio of means), and Y-axis shows the AUC for each miRNA in different comparison (color codes). The compared groups were identified by the fill color of the dots. The horizontal line was set at 0.9 as the minimum value for the AUC for an excellent biomarker. The vertical line is set at 0, at which no DE of miRNAs is evident
Pathway enrichment analyses of miRNAs targets
The initial mRNA gene prediction analyses Identified 12, 16, 49, 27 and 14 target mRNA genes for has-miR-21-5p, has-miR-155-5p, has-miR-29a-3p, has-miR-212-3p and has-miR-316-5p, respectively (Table S1). These were further used in the pathway enrichment analyses (Figures 5, 6 and Table 3). Among the identified pathways, syndromic intellectual developmental disorder pathway was the top enriched pathway Associated target genes = 13.3% for miR-155-5p and miR-29a-3p. Signaling by ALK(anaplastic lymphoma kinase) in cancer and signaling by ALK fusions and activated point mutants were the 2nd most enriched pathway targeted and were targeted by all studied miRNAs except miR-316-5p, in which L1CAM interactions was the highest enriched pathway. All miRNAs share an enrichment for the ESR-mediated signaling pathway. Some miRNAs target immune-related pathways. For instance, signaling by TGF-beta Receptor Complex and its associated SMAD2, 3, 4 complex were targeted by miR-155-5p and miR-212-3p, TNF signaling pathway is targeted by miR-155-5p, miR-212-3p and miR-21-5p, apoptosis is enriched by miR-212-3p and miR-21-5p, Class I MHC mediated antigen processing & presentation is predicted to be regulated by all miRNAs except for miR-316-5p. For specificity, we focused on the pathways enriched by the 3- miRNAs that are considered important biomarkers (i.e. miR-316-5p, miR-21-5p and miR-29a-3p) (Figure 6). Insulin and ESR-mediated signaling pathways were commonly targeted by these miRNAs. TNF signaling and apoptosis were uniquely targeted by miR-21-5p. Interestingly, miR-29a-3p targets uniquely the highest number of signaling pathways.
Table (3):
Pathways enriched by the studied miRNAs
| miRNA | Name of pathway | % Associated Genes* |
|---|---|---|
| miR-155-5p | Syndromic intellectual developmental disorder | 13.33 |
| Signaling by ALK fusions and activated point mutants | 9.09 | |
| Signaling by ALK in cancer | 9.09 | |
| Transcriptional activity of SMAD2/SMAD3:SMAD4 heterotrimer | 8.7 | |
| NCAM signaling for neurite out-growth | 6.35 | |
| Signaling by TGF-beta Receptor Complex | 4.49 | |
| PPARA activates gene expression | 4.27 | |
| Regulation of lipid metabolism by PPARalpha | 4.2 | |
| TNF signaling pathway | 3.57 | |
| L1CAM interactions | 3.36 | |
| ESR-mediated signaling | 2.69 | |
| Antigen processing: Ubiquitination & Proteasome degradation | 2.59 | |
| Class I MHC mediated antigen processing & presentation | 2.1 | |
| miR-212-3p | Signaling by ALK fusions and activated point mutants | 9.09 |
| Signaling by ALK in cancer | 9.09 | |
| Transcriptional activity of SMAD2/SMAD3:SMAD4 heterotrimer | 8.7 | |
| NCAM signaling for neurite out-growth | 6.35 | |
| Signaling by TGF-beta Receptor Complex | 4.49 | |
| TNF signaling pathway | 3.57 | |
| Neurotrophin signaling pathway | 3.36 | |
| RHOA GTPase cycle | 2.72 | |
| ESR-mediated signaling | 2.69 | |
| Adrenergic signaling in cardiomyocytes | 2.67 | |
| Antigen processing: Ubiquitination & Proteasome degradation | 2.59 | |
| Focal adhesion | 2.49 | |
| Signaling by Nuclear Receptors | 2.34 | |
| Apoptosis | 2.22 | |
| Class I MHC mediated antigen processing & presentation | 2.1 | |
| miR-21-5p | Signaling by ALK fusions and activated point mutants | 9.09 |
| Signaling by ALK in cancer | 9.09 | |
| TNF signaling pathway | 3.57 | |
| Insulin signaling pathway | 2.92 | |
| ESR-mediated signaling | 2.69 | |
| Adrenergic signaling in cardiomyocytes | 2.67 | |
| Antigen processing: Ubiquitination & Proteasome degradation | 2.59 | |
| Apoptosis | 2.22 | |
| Class I MHC mediated antigen processing & presentation | 2.1 | |
| miR-29a-3p | Syndromic intellectual developmental disorder | 13.33 |
| Signaling by ALK fusions and activated point mutants | 9.09 | |
| Signaling by ALK in cancer | 9.09 | |
| NCAM signaling for neurite out-growth | 6.35 | |
| ECM proteoglycans | 5.26 | |
| ECM-receptor interaction | 4.55 | |
| PPARA activates gene expression | 4.27 | |
| Regulation of lipid metabolism by PPARalpha | 4.2 | |
| L1CAM interactions | 3.36 | |
| Insulin signaling pathway | 2.92 | |
| RHOA GTPase cycle | 2.72 | |
| ESR-mediated signaling | 2.69 | |
| Antigen processing: Ubiquitination & Proteasome degradation | 2.59 | |
| Focal adhesion | 2.49 | |
| Signaling by Nuclear Receptors | 2.34 | |
| Class I MHC mediated antigen processing & presentation | 2.1 | |
| miR-316-5p | L1CAM interactions | 3.36 |
| Neurotrophin signaling pathway | 3.36 | |
| Insulin signaling pathway | 2.92 | |
| ESR-mediated signaling | 2.69 | |
| Adrenergic signaling in cardiomyocytes | 2.67 | |
| Signaling by Nuclear Receptors | 2.34 |
*The % of associated genes is number of predicted targets by miRNAs divided by the total number of gene entities in the pathway. The higher the %, the more important the pathway.
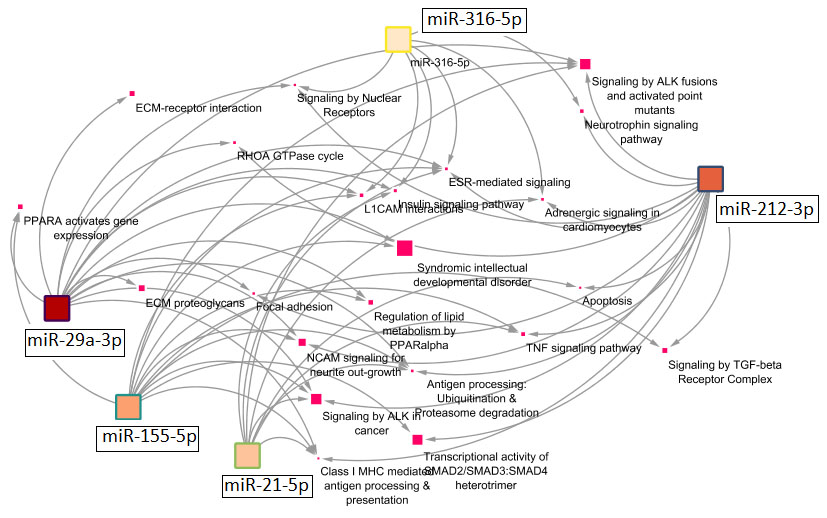
Figure 5. Network diagram showing the pathways significantly enriched by the miRNAs. Squares refer to interaction partners (miRNAs or their associated pathways). The color intensity inside miRNAs squares corresponds to the number of target genes for each miRNA. The bigger the size of pathway squares, the more importance the pathway as being regulated by miRNAs (importance here is the calculated % of associated genes, which is number of predicted targets by miRNAs divided by the total number of gene entities in the pathway)
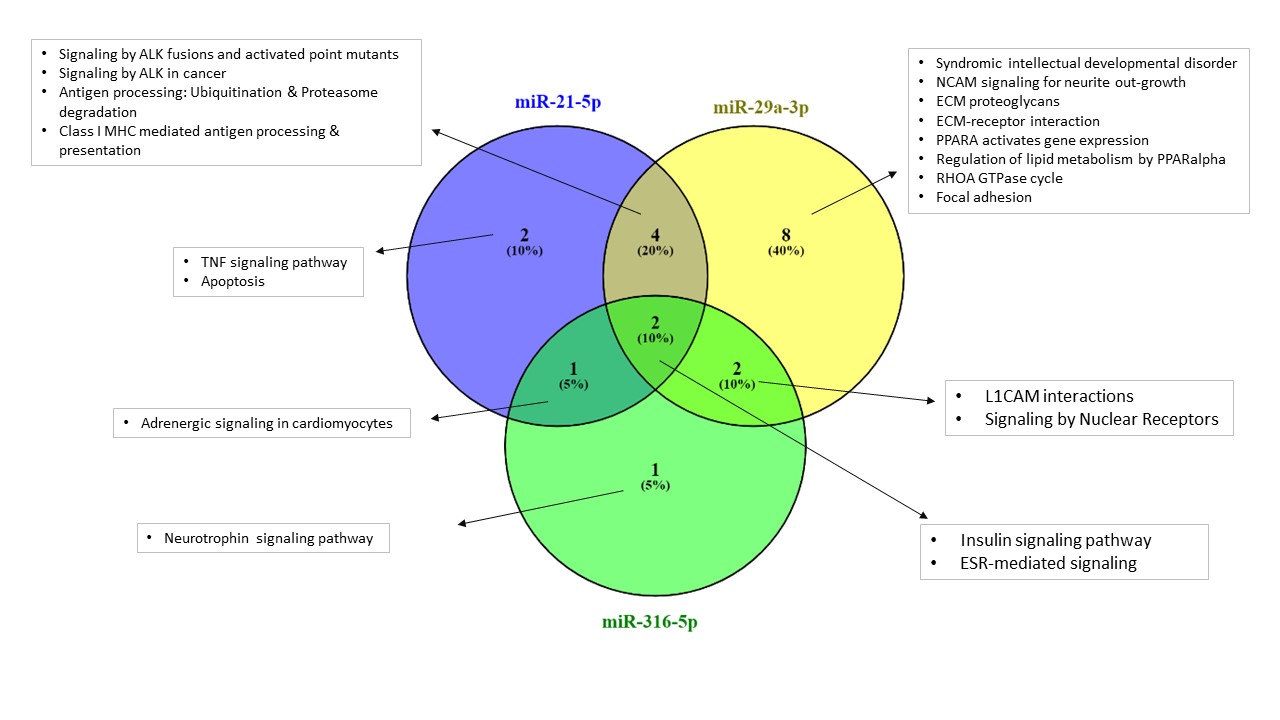
Figure 6. Venn diagram showing common and unique pathways enriched by the important miRNAs (miR-21-5p, miR-29a-3p and miR-316-5p). The names of enriched pathways are indicated in the boxes
Compared to the wealth of research on the implication of miRNAs in TB pathobiology in humans, fewer studies have been done to provide a stepwise analysis on the importance of miRNAs as biomarkers for discriminating human TB varieties (i.e. ATB and LTB). Here we investigated the biomarker potential of a set of blood miRNAs that have been reported previously by us and others to be TB- and immune function-associated. The results suggest the importance of particular miRNAs (e.g. miR-29a-3p, miR21-5p and miR-361-5p) as biomarkers for TB infection in humans.
Differences in miRNA expression pattern among groups
miRNAs are known to be deregulated upon TB infection in humans.7,39 In the current study, we found that 3 miRNAs (miR-21-5p, miR-29a-3p and miR-361-5p) share similar patterns and levels of expression (Figure 1). The expression levels of these miRNAs in LTB subjects did not differ significantly from HC subjects, yet they were reduced in ATB subjects and were all allocated in a single cluster irrespective of the TB category (Figure 2A). Surprisingly, miR-155-5p, which has a well-known involvement in tuberculosis pathobiology,11,40 did not significantly differ among the three groups possibly due to the small sample size and/or within group variability in its expression level (standard deviation ranges from 3.8-6.1). This magnifies the significance of having additional sample size in biomarker research.
Grouping of participants (TB and healthy) based on miRNA expression
The extent of changes miRNA expression in the analyzed groups could shed more lights and thus provide more understanding of how TB (ATB and LTB) and healthy groups are different based on their miRNA response. Generally, our nMDS hierarchical clustering revealed a clear separation between ATB infected groups and HC, whereas LTB group somehow overlapped with HC (Figure 2). In this context, M. tuberculosis infection induces changes in host response in LTB patients that mimic HC individuals. It was expected to notice this using miRNA expression data. Similar findings were revealed in our previous investigation involving the 4-major classes of small non-coding RNAs (snRNAs), including miRNAs in whole blood of TB subjects, where LTB and health controls clustered together a way from ATB subjects.13 Wang et al. found that subjects with ATB were independently clustered from HC and LTB subjects, while the 2-latter subjects overlapped to some extent.41 It is plausible to speculate that the dormant and encapsulated state of M. tuberculosis and the relatively shielded infection site from blood circulation42 in LTB lead to slight and possibly static gene expression changes mimicking a healthy status as reported previously.43 It is worth noting that half of the LTB subjects were clustered slightly close to those in ATB groups (Figure 2A), suggesting that those LTB individuals could be thought as a subgroup of LTB that are in the way to progression to active disease. By analyzing the symptomatology of these subgroups, we found no supporting evidence of their closeness to the ATB groups as shown by clustering analyses (Figure S1). While no other evidence are available to support this, We suggest that this could indicate that miRNAs could be early markers for progressive disease before any symptoms appear. This specific suggestion needs to explore and validated in a large scale studies.
MiRNAs as diagnostic biomarkers for ATB (discriminating HC from ATB)
The current analyses suggest the importance of miR-361-5p, miR-29a-3p and miR-21-5p as biomarkers for ATB disease because they were significantly down regulated in ATB compared to HC and they have high AUC in the ROC analyses (1, 0.9, 0.9, respectively). However, there are evidences in literature that MiR-21 are down-regulated in ATB infection compared to HC, whereas miR-29a was up-regulated44 in whole blood and CD4+T cells of children affected by pulmonary TB. In agreement with our results, miR-29a-3p was down-regulated in plasma of South African subjects with ATB compared to matched controls.45 On contrary, the same miRNA was overexpressed in plasma of ATB compared to both HC and LTB groups.46 The downregulation of miR-21-5p and miR-29a-3p in ATB has not yet been understood, but previous research has stated that known up regulation of the master regulator c-myc in T-cells, and possibly in blood of ATB patients47 is presumably responsible for the suppression of these two miRNAs.48,49
In opposition to our results, serum miR-29 was elevated in serum of Egyptian subjects with ATB disease.39 This study has revealed also that the expression level of serum miR-361-5p did not change between ATB and HC. On the other side, serum miR-361-5p were up-regulated in ATB subjects using TaqMan Low-Density Array (TLDA).50 As expected, controversial results are usually obtained from in-vivo studies owing to using different platforms, patient criteria and sample types. It is worth noting that miRNA expression levels are usually incomparable in different samples (e.g. serum, plasma and whole blood) from the same individuals.51 Previous comparative research and our literature search have identified false over expressions of serum miRNAs because coagulation process tends to releases some cellular miRNAs into serum.52,53 This highlights the importance of screening different samples from the same individual for increased resolution in diagnostic settings and also signifies the synchronization among biomarker selection protocols as it affects the biomarker detection.
miRNAs as biomarkers discriminating ATB from LTB
The miRNAs that are distinct between ATB and LTB could be used as markers for both disease progression (from LTB to ATB) or latency after having Active disease. Our analyses highlight the importance of miR-29a-3p as a potential biomarker for progression from LTB to ATB given their significant downregulation in ATB compared to LTB and their high significant AUC. The downregulation of miR-29a-3p during ATB and its upregulation during LTB refer to a controlled meaningful underlying mechanism. This is supported by the results of Ma et al.54 who have described that this miRNA suppresses IFNγ and TNFα, hence suppressing the immune response to intracellular pathogens including M. tuberculosis, which would be expected to occur in LTB infection. It has been also found that miR-29a-3p joined miR-194 to target components in the Wnt signalling pathway that seems to be a player in TB pathogenesis.55
While miR-21-5p showed an expression trend like that of miR-29a-3p, we think it is of little importance as a prognostic marker due to the high within LTB group variability in its expression level (SD = 3.4). The question of what triggers the reprogramming of host miRNAs during LTB is controversial. This is because miRNAs induction could be host- or pathogen-driven,23 making the interpretation difficult, especially in the absence of experimental validation.
Involvement of miRNAs in signalling pathways
During TB infection, miRNAs are deregulated and play various roles in the pathogenesis of the disease by regulating host genes, which are themselves components of various pathways.7 Determining the pathways targeted by miRNAs should enable better and precise understanding of miRNA involvement in TB pathogenesis, and thus could allow more accurate function-based identification of biomarkers or advising mechanism-based therapy selection. In our analyses, we found that ESR pathway were enriched by the 3-miRNAs identified as important biomarkers (i.e. miR-21-5p, miR-29-3p and miR-361-5p). Recent studies have suggested the involvement of estrogen in pathogenesis of TB.56 Expression of oestrogens receptor (ER) in host cells could modulate various innate and adaptive immune response as well as immune cell development.57 This suggests a link between miRNA expression and oestrogens and immune status during TB infection. Besides, various immune-related pathways such as TNF-α and apoptosis pathways were identified as targets for the studied miRNAs (Figure 5 and Table 3). The mechanism by which TNF-α is contributing to the control of TB bacilli is well established.58-60 With regard to apoptosis, miR-21 was known to inhibit proapoptotic proteins like Bax and Bak and thus promoting macrophage survival, a favourable environment for M. tuberculosis.61 Indeed, previous research have identified a link between TNF-α activation and initiation of apoptosis process in tuberculosis infection.62 These data added to the extensive research done on the association of TB with immune system.
We acknowledge that the small sample size of subjects in this study are among the study limitations. The study is limited also by the unavailability of complete clinical data on patients, which would otherwise link the expression pattern and biomarker potential of miRNAs to patient clinical features and comorbidities. Despite these limitations, we do believe that the study main strength is that it is among the first ones to be done on Egyptian subjects spanning both disease category, ATB and LTB. Results of the current study could be extrapolated and validated using future large-scale studies. TB infection occurs in many developing and poor community, and given that the immune response to TB infection are ethnicity/race dependent,13,63 this study could feed important information into comparative research where TB response are compared across communities.
Additional file: Table S1 and Figure S1.
ACKNOWLEDGMENTS
The authors would like to thank Prof. Samy S Eldahdouh (Professor of Chest, Faculty of Medicine, Menoufia University, Egypt), for his support in collecting samples and patient’s metadata and X-ray diagnosis of cases.
CONFLICT OF INTEREST
The authors declare that there is no conflict of interest.
AUTHORS’ CONTRIBUTION
All authors listed have made a substantial, direct and intellectual contribution to the work, and approved it for publication.
FUNDING
The authors extend their appreciation to the Deanship of Scientific Research at Jouf University for funding this work through research grant No. DSR2020-04-2568.
DATA AVAILABILITY
All datasets generated or analyzed during this study are included in the manuscript and/or in the supplementary files.
ETHICS STATEMENT
This study was approved by the Local Committee of Bioethics of Jouf University, Kingdom of Saudi Arabia, with approval no: 1-01-43.
INFORMED CONSENT
Written informed consent was obtained from the participants before enrolling in the study.
- Organization, W.H., Global tuberculosis report 2021-2020.
- Pagan AJ, Ramakrishnan L. Immunity and Immunopathology in the Tuberculous Granuloma. Cold Spring Harb Perspect Med. 2014;5(9):a018499.
Crossref - Natarajan S, Ranganathan M. Transcriptional Profiling and Deriving a Seven-Gene Signature That Discriminates Active and Latent Tuberculosis: An Integrative Bioinformatics Approach. Genes. 2022;13(4):616.
Crossref - Cao SH, Chen YQ, Sun Y, et al. Screening of Serum Biomarkers for Distinguishing between Latent and Active Tuberculosis Using Proteome Microarray. Biomed Environ Sci. 2018;31(7):515-526.
Crossref - Teklu T, Wondale B, Taye B, et al. Differences in plasma proteomes for active tuberculosis, latent tuberculosis and non-tuberculosis mycobacterial lung disease patients with and without ESAT-6/CFP10 stimulation. Proteome Sci. 2020;18(1):10.
Crossref - Mudge JM, Harrow J. Creating reference gene annotation for the mouse C57BL6/J genome assembly. Mamm Genome. 2015;26(9-10):366-378.
Crossref - Behrouzi A, Alimohammadi M, Nafari AH, et al. The role of host miRNAs on Mycobacterium tuberculosis. ExRNA. 2019;1(1):40.
Crossref - Xu P, Wu Q, Lu D, et al. A systematic study of critical miRNAs on cells proliferation and apoptosis by the shortest path. BMC Bioinformatics. 2020;21(1):396.
Crossref - Ivey KN, Srivastava D. microRNAs as Developmental Regulators. Cold Spring Harb Perspect Biol. 2015;7(7):a008144.
Crossref - Bezman NA, Cedars E, Steiner DF, Blelloch R, Hesslein DGT, Lanier LL. Distinct Requirements of MicroRNAs in NK Cell Activation, Survival, and Function. J Immunol. 2010;185(7):3835-3846.
Crossref - Rothchild AC, Sissons JR, Shafiani S, et al. MiR-155-regulated molecular network orchestrates cell fate in the innate and adaptive immune response to Mycobacterium tuberculosis. Proc Natl Acad Sci U S A. 2016;113(41):E6172-e6181.
Crossref - Xie T, Liang J, Guo R, Liu N, Noble PW, Jiang D. Comprehensive microRNA analysis in bleomycin-induced pulmonary fibrosis identifies multiple sites of molecular regulation. Physiol Genomics. 2011;43(9):479-487.
Crossref - de Araujo LS, Ribeiro-Alves M, Leal-Calvo T, et al. Reprogramming of Small Noncoding RNA Populations in Peripheral Blood Reveals Host Biomarkers for Latent and Active Mycobacterium tuberculosis Infection. mBio. 2019:10(6):e01037.
Crossref - Cao D, Wang J, Ji Z, et al. Profiling the mRNA and miRNA in Peripheral Blood Mononuclear Cells in Subjects with Active Tuberculosis. Infect Drug Resist. 2020;13:4223-4234.
Crossref - Kaushik AC, Wu Q, Lin L, et al. Exosomal ncRNAs profiling of mycobacterial infection identified miRNA-185-5p as a novel biomarker for tuberculosis. Brief Bioinform. 2021:22(6):bbab210.
Crossref - Kathirvel M, Saranya S, Mahadevan S. Expression levels of candidate circulating microRNAs in pediatric tuberculosis. Pathog Glob Health. 2020;114(5):262-270.
Crossref - Gao K, Li R, Fu Y. Dysregulated circRNAs in plasma from active tuberculosis patients. J Cell Mol Med. 2018;22(9):4076-4084.
Crossref - Reid MJ, Shah NS. Approaches to tuberculosis screening and diagnosis in people with HIV in resource-limited settings. Lancet Infect Dis. 2009;9(3):173-184.
Crossref - MacGregor-Fairlie M, Wilkinson S, Besra GS, Oppenheimer PG. Tuberculosis diagnostics: overcoming ancient challenges with modern solutions. Emerg Topics Life Sci. 2020;4(4):423-436.
Crossref - Pai M, Behr MA, Dowdy D, et al. Tuberculosis. Nature Reviews Disease Primers. 2016;2(1):16076.
Crossref - Pai M, Zwerling A, Menzies D. Systematic Review: T-Cell-based Assays for the Diagnosis of Latent Tuberculosis Infection: An Update. Ann Intern Med. 2008;149(3):177-184.
Crossref - Kozomara A, Birgaoanu M. Griffiths-Jones S. miRBase: from microRNA sequences to function. Nucleic Acids Research. 2018;47(D1):D155-D162.
Crossref - Sinigaglia A, Peta E, Riccetti S, Venkateswaran S, Manganelli R, Barzon L. Tuberculosis-Associated MicroRNAs: From Pathogenesis to Disease Biomarkers. Cells. 2020;9(10):2160.
Crossref - Wang S, He L, Wu J, Zhou Z, Gao Y, Chen J, Zhang W. Transcriptional Profiling of Human Peripheral Blood Mononuclear Cells Identifies Diagnostic Biomarkers That Distinguish Active and Latent Tuberculosis. Front Immunol. 2019; 10: 1–11.
- Pattnaik B, Patnaik N, Mittal S, et al. Micro RNAs as potential biomarkers in tuberculosis: A systematic review. Noncoding RNA Res. 2022;7(1):16-26.
Crossref - Paraskevopoulou MD, Georgakilas G, Kostoulas N, et al. DIANA-microT web server v5.0: service integration into miRNA functional analysis workflows. Nucleic Acids Res. 2013;41(Web Server Issue):W169-73.
Crossref - Wong N, Wang X. miRDB: an online resource for microRNA target prediction and functional annotations. Nucleic Acids Res. 2015;43:D146-52.
Crossref - Chou CH, Chang NW, Shrestha S, et al. miRTarBase 2016: updates to the experimentally validated miRNA-target interactions database. Nucleic Acids Res. 2016;44(D1):D239-47.
Crossref - Bignotti E, Calza S, Tassi RA, et al. Identification of stably expressed reference small non-coding RNAs for microRNA quantification in high-grade serous ovarian carcinoma tissues. J Cell Mol Med. 2016;20(12):2341-2348.
Crossref - Korma W, Mihret A, Tarekegn A, et al. Identification of Circulating miR-22-3p and miR-93-5p as Stable Endogenous Control in Tuberculosis Study. Diagnostics. 2020;10(11):868.
Crossref - Kolde R, Kolde MR. Package ‘pheatmap’. R package,2015; 1(7):790.
- Jari Oksanen FGB, Friendly M, Kindt R, Legendre P, McGlinn D, Minchin PR, Wagner, H. Vegan: Community Ecology Package. 2018; R package version, 2(6).
- Tokar T, Pastrello C, Rossos AEM , et al. mirDIP 4.1-integrative database of human microRNA target predictions. Nucleic Acids Res. 2017;46(D1):D360-D370.
Crossref - Agarwal V, Bell GW, Nam JW, Bartel DP. Predicting effective microRNA target sites in mammalian mRNAs. eLife. 2015;4:e05005.
Crossref - Vlachos IS, Zagganas K, Paraskevopoulou MD, et al. DIANA-miRPath v3.0: deciphering microRNA function with experimental support. Nucleic Acids Research. 2015;43(W1):W460-W466.
Crossref - Shannon P, Markiel A, Ozier O, et al. Cytoscape: a software environment for integrated models of biomolecular interaction networks. Genome Res. 2003;13(11):2498-2504.
Crossref - Moriya Y, Itoh M, Okuda S, Yoshizawa AC, Kanehisa M. KAAS: an automatic genome annotation and pathway reconstruction server. Nucleic Acids Res. 2007;35(Web Server Issue):W182-5.
Crossref - Gillespie M, Jassal B, Stephan R, et al. The reactome pathway knowledgebase 2022. Nucleic Acids Res. 2021;50(D1):D687-D692.
Crossref - Draz N, el Haddy SAR, Elsayed MS, Korra EEA, el Magd MMA. Serum microRNA-29 a and microRNA-361-5 p as Potential Diagnostic Biomarkers for Active Pulmonary Tuberculosis. Egyptian Journal of Medical Microbiology, 2015;23(4).
- Huang J, Jiao J, Xu, et al. MiR-155 is upregulated in patients with active tuberculosis and inhibits apoptosis of monocytes by targeting FOXO3. Mol Med Rep. 2015;12(5):7102-7108.
Crossref - Wang C, Yang S, Sun G, et al. Comparative miRNA expression profiles in individuals with latent and active tuberculosis. PLoS One. 2011;6(10):e25832.
Crossref - Drain PK, Bajema KL, Dowdy D, et al. Incipient and Subclinical Tuberculosis: a Clinical Review of Early Stages and Progression of Infection. Clin Microbiol Rev. 2018;31(4):e00021-18.
Crossref - Ahmad S. Pathogenesis, immunology, and diagnosis of latent Mycobacterium tuberculosis infection. Clin Dev Immunol. 2011;814943.
Crossref - Barry SE, Ellis M, Yang YR, et al. Identification of a plasma microRNA profile in untreated pulmonary tuberculosis patients that is modulated by anti-mycobacterial therapy. J Infect. 2018;77(4):341-348.
Crossref - Honeyborne I, Lipman MC, Eckold C, et al. Effective anti-tuberculosis therapy correlates with plasma small RNA. Eur Respir J. 2015;45(6):1741-1744.
Crossref - Ndzi EN, Nkenfou CN, Mekue LM , et al. MicroRNA hsa-miR-29a-3p is a plasma biomarker for the differential diagnosis and monitoring of tuberculosis. Tuberculosis (Edinb). 2019;114:69-76.
Crossref - Jacobsen M, Repsilber D, Kleinsteuber K, et al. Suppressor of cytokine signaling-3 is affected in T-cells from tuberculosisTB patients. Clin Microbiol Infect. 2011;17(9):1323-1331.
Crossref - Mott JL, Kurita S, Cazanave SC, Bronk SF, Werneburg NW, Fernandez-Zapico ME et al. Transcriptional suppression of mir-29b-1/mir-29a promoter by c-Myc, hedgehog, and NF-kappaB. J Cell Biochem. 2010;110(5):1155-1164.
Crossref - Buechner J, Henriksen JR, Haug BH, Tomte E, Flaegstad T, Einvik C. Inhibition of mir-21, which is up-regulated during MYCN knockdown-mediated differentiation, does not prevent differentiation of neuroblastoma cells. Differentiation. 2011;81(1):25-34.
Crossref - Qi Y, Cui L, Ge Y, et al. Altered serum microRNAs as biomarkers for the early diagnosis of pulmonary tuberculosis infection. BMC Infect Dis. 2012;12:384.
Crossref - Wang K, Yuan Y, Cho JH, McClarty S, Baxter D, Galas DJ. Comparing the MicroRNA spectrum between serum and plasma. PLoS One. 2012;7(7):e41561.
Crossref - Samir M, Pessler F. Small Non-coding RNAs Associated with Viral Infectious Diseases of Veterinary Importance: Potential Clinical Applications. Front Vet Sci. 2016;3:22.
Crossref - McDonald JS, Milosevic D, Reddi HV, Grebe SK, Algeciras-Schimnich A. Analysis of circulating microRNA: preanalytical and analytical challenges. Clin Chem. 2011;57(6):833-840.
Crossref - Ma F, Xu S, Liu X, et al. The microRNA miR-29 controls innate and adaptive immune responses to intracellular bacterial infection by targeting interferon-g. Nat Immunol. 2011;12(9):861-869.
Crossref - Krutzfeldt J, Rosch N, Hausser J, Manoharan M, Zavolan M, Stoffel M. MicroRNA-194 is a target of transcription factor 1 (Tcf1, HNF1α) in adult liver and controls expression of frizzled-6. Hepatology. 2012;55(1):98-107.
Crossref - Gan Y, Hu Q, Li A, Gu L, Guo S. Estradiol inhibits autophagy of Mycobacterium tuberculosis infected 16HBE cells and controls the proliferation of intracellular Mycobacterium tuberculosis. Mol Med Rep. 2022;25(6).
Crossref - Kovats S. Estrogen receptors regulate innate immune cells and signaling pathways. Cell Immunol. 2015;294(2):63-69.
Crossref - Lin PL, Plessner HL, Voitenok NN, Flynn JL. Tumor necrosis factor and tuberculosis. J Investig Dermatol Symp Proc. 2007;12(1):22-25.
Crossref - Harris J, Keane J. How tumour necrosis factor blockers interfere with tuberculosis immunity. Clin Exp Immunol. 2010;161(1):1-9.
Crossref - Gardam MA, Keystone EC, Menzies R, et al. Anti-tumour necrosis factor agents and tuberculosis risk: mechanisms of action and clinical management. Lancet Infect Dis. 2003;3(3):148-155.
Crossref - Wang Q, Liu S, Tang Y, Liu Q, Yao Y. MPT64 Protein from Mycobacterium tuberculosis Inhibits Apoptosis of Macrophages through NF-kB-miRNA21-Bcl-2 Pathway. PLOS ONE. 2014;9(7):e100949.
Crossref - Agarwal RG, Sharma P, Nyati KK. microRNAs in Mycobacterial Infection: Modulation of Host Immune Response and Apoptotic Pathways. Immune Netw. 2019;19(5):e30.
Crossref - Nahid P, Jarlsberg LG, Kato-Maeda M, et al. Interplay of strain and race/ethnicity in the innate immune response to M. tuberculosis. PLOS ONE. 2018;13(5):e0195392.
Crossref - Zhao Z, Hao J, Li X, Chen Y, Qi X. MiR-21-5p regulates mycobacterial survival and inflammatory responses by targeting Bcl-2 and TLR4 in Mycobacterium tuberculosis-infected macrophages. FEBS Lett. 2019;593(12):1326-1335.
Crossref - Kleinsteuber K, Heesch K, Schattling S, et al. Decreased expression of miR-21, miR-26a, miR-29a, and miR-142-3p in CD4+ T cells and peripheral blood from tuberculosis patients. PLoS One. 2013;8(4):e61609.
Crossref - Yareta J, Galarza M, Capristano S, et al. Differential expression of circulating micro-RNAs in patients with active and latent tuberculosis. Rev Peru Med Exp Salud Publica. 2020;37(1):51-56.
Crossref - Fu Y, Yi Z, Wu X, Li J, Xu F. Circulating microRNAs in patients with active pulmonary tuberculosis. J Clin Microbiol. 2011;49(12):4246-4251.
Crossref - Latorre I, Leidinger P, Backes C, et al. A novel whole-blood miRNA signature for a rapid diagnosis of pulmonary tuberculosis. Eur Respir J. 2015;45(4):1173-1176.
Crossref - Xu Z, Zhou A, Ni J, et al. Differential expression of miRNAs and their relation to active tuberculosis. Tuberculosis (Edinb), 2015;95(4):395-403.
Crossref
© The Author(s) 2024. Open Access. This article is distributed under the terms of the Creative Commons Attribution 4.0 International License which permits unrestricted use, sharing, distribution, and reproduction in any medium, provided you give appropriate credit to the original author(s) and the source, provide a link to the Creative Commons license, and indicate if changes were made.