


ISSN: 0973-7510
E-ISSN: 2581-690X
Aflatoxins are naturally occurring mycotoxins that are virtually impossible to eradicate from food and animal feed, and therefore contribute to the widespread contamination of maize products. These toxins are highly dangerous fungal substances that cause acute and chronic toxicity in humans and livestock. In the present study, 32 samples of different maize products were collected from different locations in Tamil Nadu, India, during 2021-2022 to assess aflatoxin contamination. Only two samples were free from aflatoxin contamination, whereas the other 30 maize samples were contaminated with different types of aflatoxins. In addition, maize seeds were collected from 15 locations covering 10 districts of Tamil Nadu, India, to study the mycoflora diversity. The results revealed the six main fungal genera, namely Aspergillus, Fusarium, Penicillium, Rhizopus, Alternaria, and Macrophomina, associated with maize seeds. Out of the 1152 mycoflora isolated from maize seeds, the genus Aspergillus contributed the most (82%), followed by Fusarium spp. (9%) and others (9%). Within the genus Aspergillus, A. niger, A. flavus, A. fumigatus, A. tamarii, and A. oryzae were recorded. Species composition studies revealed that A. niger, A. flavus and A. tamarii were present at all locations. Alpha diversity analysis of maize seed mycoflora and the genus Aspergillus using different indices revealed that abundance, dominance, and species richness were high at very few locations. Beta diversity analysis also revealed that there was no significant difference in the mycoflora between locations i.e. mycoflora distribution was even across all locations. Furthermore, the toxigenic potential of 24 Aspergillus isolates from different locations was assessed. The results revealed that the isolates Asp 16, Asp 17, Asp 20, and Asp 23 produced all four aflatoxins types, namely aflatoxin B1 (AFB1), aflatoxin B2 (AFB2), aflatoxin G1 (AFG1), and aflatoxin G2 (AFG2). Among the isolates, a maximum AFB1 of 10250.78 ppb/g of agar plug was recorded for the Asp 23 isolate, followed by Asp 20 (4246.584 ppb). Most isolates produced one or two aflatoxin types, and some non-toxigenic Aspergillus isolates were also recorded.
Aflatoxin, Alpha and Beta Diversity, Aspergillus, Maize, Seeds
Maize (Zea mays L.) is an important cereal crop that is versatile in its adaptability to diverse agroclimatic conditions. Because it has the highest potential for genetic production among cereals, it is cultivated in approximately 160 different countries with a high variation in soil, temperature, biodiversity, and management practices. This versatile crop is in demand not only for its use in human and animal consumption, but also in food processing, poultry, dairy, and ethanol industries, thereby making it a rapidly expanding cash crop.
Maize productivity and quality are influenced by several biotic and abiotic variables. The most significant post-harvest issue is the contamination of maize kernels with mycotoxigenic fungi and their derivatives. According to the United Nations Food and Agriculture Organization (FAO), mycotoxins are found in 25% of harvested crops. Various molds generate harmful secondary metabolites, known as mycotoxins. The genera Aspergillus, Fusarium, and Penicillium are the primary producers of mycotoxins such as aflatoxin, ochratoxin, fumonisin, deoxynivalenol, T-2 toxin, and zearalenone.1 Aflatoxins (AFs) derived from furanocoumarin are the most detrimental mycotoxins that contaminate maize-based feed and products and present substantial health hazards to both humans and animals because of their capacity to initiate extremely pathogenic cellular and physiological mechanisms.2,3 Several species of Aspergillus produce aflatoxins; however, A. parasiticus, A. flavus, A. nomius, and A. pseudotamarii are considered to be the major producers of aflatoxin.4,5 Aflatoxin B1 (AFB1), aflatoxin B2 (AFB2), aflatoxin G1 (AFG1), and aflatoxin G2 (AFG2) constitute the four main aflatoxin variants. The predominant aflatoxin found in contaminated corn is AFB1.6
Food safety and security depend on three essential factors: food availability, safe food access, and the utilization of food for nutritional, cultural, and quality purposes. The method approved by the Association of Approved Analytical Chemists (AOAC) was used to identify aflatoxins in food and feed samples. Significant losses can be avoided with early detection.7 Alongside the ELISA (enzyme-linked immuno-sorbent assay), chromatographic methods for example TLC (Thin Layer Chromatography), HPLC (High Performance Liquid Chromatography), and LCMS (Liquid Chromatography Mass Spectrometry) are among the most commonly used procedures.8-10
Maize seeds harbor various ecto-endophytic bacteria, actinomycetes, and fungi. The isolated ectophytic mycoflora include Diplodia, Aspergillus, Penicillium, Fusarium verticillioides, Gibberella zeae, F. proliferatum, F. glutinans, Botryosphaeria, Macrophomina phaseolina, Rhizoctonia, Nigrospora, Cladosporium, Trichoderma, and Rhizopus.11 Mycoflora infection in maize seeds results in decreased germination as well as rejection due to numerous abnormalities.12 Further, poor storage structure can lead to infection of the entire seed stock by storage fungi. Sometimes, fungi growing on maize seeds can kill them, emit a bad odour/taste, and render the seeds inedible owing to the release of mycotoxins and changes in their chemical composition.13
The study of fungal diversity is crucial for evaluating ecosystems. Diversity metrics, such as species richness, evenness, population dynamics, and mycoflora dominance have been evaluated. Fungal species richness, indicative of niche diversity under limiting similarity that facilitates species cohabitation, is extensively used for habitat comparison.14 Fungal variety is affected by multiple factors, including temporal changes, climatic conditions, biological communities, topographical features, natural disturbances, anthropogenic disruptions, and pollution.15 Consequently, there is a growing need to predict features of fungal diversity and their spatiotemporal variations in both wild and controlled ecosystems. Alpha diversity refers to biodiversity within a specific community, whereas beta diversity assesses the variation in biodiversity between different locations. Examining species composition assists researchers in understanding species interactions and ecological functionality.16 Beta diversity reveals the distinctiveness of community composition across various landscapes.
Previous studies on maize have mainly focused on the rhizosphere microbiome, particularly the bacterial community. However, little attention has been paid to the structure and distribution of the fungal communities associated with maize grains and the presence of mycotoxins. Understanding the composition and distribution of toxigenic fungi can provide basic information for the prevention of mycotoxin contamination, ultimately ensuring food safety in India and worldwide. Hence, the main aim of the present study was to evaluate aflatoxin concentrations in maize grains/products from various locations, the diversity of maize seed mycoflora, and the toxigenic potential of Aspergillus species from different locations in Tamil Nadu, India.
Sample collection
Maize grains and maize-based products, such as grains, poultry feed, flour, corn flakes, and sweet and baby corn kernels, were collected from major districts of Tamil Nadu, India (Table 1). Samples were obtained from several stores and markets within a certain district, and composite samples were used to determine aflatoxin contamination. Maize grains, feed, and corn flakes were ground into a fine powder using a manual mill for analytical purposes. All obtained samples were preserved in sterile polythene bags, accurately labeled, and maintained at 4 °C until subsequent analyses. Similarly, seed samples were collected from the key maize-growing districts of Tamil Nadu, including Virudhunagar, Tuticorin, Madurai, Dharmapuri, Salem, Dindigul, Erode, Tirupur, Perambalur, and Coimbatore during 2021 to evaluate the mycoflora associated with the maize seeds. Fifteen seed samples were collected from the farmer’s field for the evaluation of seed surface mycoflora. For one location, a 1 kg seed sample was collected from five different farmers’ fields, and 500 g of the composite sample was then taken for further analysis. Seed samples were stored in sterile polythene bags and labeled appropriately.
Table (1):
Different maize products collected from various districts of Tamil Nadu
| No. | District | Place of collection | Sample type | Sample code |
|---|---|---|---|---|
| 1 | Coimbatore | Perur | Corn flour | MP 1 |
| 2 | Thondamuthur | Poultry feed | MP 2 | |
| 3 | Kenathukadavu | Corn flour | MP 3 | |
| 4 | Kuniyamuthur | Corn flour | MP 4 | |
| 5 | Madurai | Vadipatti | Corn flour | MP 5 |
| 6 | Thirupparankundram | Poultry feed | MP 6 | |
| 7 | Alanganallur | Corn flour | MP 7 | |
| 8 | Usilampatti | Corn flour | MP 8 | |
| 9 | Thirumangalam | Corn flour | MP 9 | |
| 10 | Tiruppur | Dharapuram | Corn flour | MP 10 |
| 11 | Avinashi | Corn flour | MP 11 | |
| 12 | Chennai | T-Nagar | Corn flour | MP 12 |
| 13 | Perambur | Corn flour | MP 13 | |
| 14 | Adyar | Corn flour | MP 14 | |
| 15 | Egmore | Corn flour | MP 15 | |
| 16 | Thirunelveli | Ambasamudram | Poultry feed | MP 16 |
| 17 | Kadayanallur | Corn flour | MP 17 | |
| 18 | Sankaran kovil | Corn flour | MP 18 | |
| 19 | Krishnagiri | Hosur | Corn flour | MP 19 |
| 20 | Kaveripattinam | Poultry feed | MP 20 | |
| 21 | Uttangarai | Corn flour | MP 21 | |
| 22 | Kancheepuram | Sriperumpudur | Corn flour | MP 22 |
| 23 | Kancheepuram | Corn flour | MP 23 | |
| 24 | Trichy | Manapparai | Corn flour | MP 24 |
| 25 | Thuraiyur | Corn flour | MP 25 | |
| 26 | Vellore | Thirupattur | Poultry feed | MP 26 |
| 27 | Anaicut | Corn flour | MP 27 | |
| 28 | Virudhunagar | Rajapalayam | Corn flour | MP 28 |
| 29 | Arupukottai | Corn flour | MP 29 | |
| 30 | Watrap | Poultry feed | MP 30 | |
| 31 | Srivilliputhur | Corn flour | MP 31 | |
| 32 | Sivakasi | Corn flour | MP 32 |
Determination of aflatoxin contamination using RP-HPLC-FLD
Toxin extraction and column clean-up
The finely ground sample (25 g) and 2.5 g of sodium chloride (NaCl) were placed in a 100 ml conical flask, and 50 ml of 80% methanol was added. The material was then mixed using a high-speed blender or maintained on an orbital shaker for 30 min at 150 rpm. The material was subsequently filtered through Whatman No. 4 filter paper. A 2 ml aliquot was extracted from the filtered sample and diluted with 14 ml of phosphate-buffered saline (PBS). The filtrate, combined with PBS, was allowed to traverse an immuno-affinity column (AFLARHONE, R-Biopharm, USA) at a flow rate of 2 ml/min. Subsequently, the column was cleaned using 20 ml of PBS. Then, 1.5 ml of methanol and 1.5 ml of distilled water were passed through the column to elute the toxin, which was collected in an amber glass vial. The eluted toxin (50 µl) was subsequently subjected to HPLC. Aflatoxin detection was accomplished by Reverse-Phase High-Performance Liquid Chromatography (RP-HPLC-FLD) on an Agilent 1200 HPLC system (Agilent Technologies, USA) equipped with an autosampler and a fluorescence detector.
HPLC method validation
Linearity and sensitivity
A total aflatoxin standard was acquired at a concentration of 5 µg/ml (2 µg each for AFB1 and AFG1, 0.5 µg each for AFB2 and AFG2) and reconstituted in 10 ml of HPLC-grade acetonitrile. A 50% methanol solution was used to prepare working stocks at concentrations of 1, 5, 10, 15, 20, and 25 ng/ml. A multipoint calibration curve obtained by injecting concentrations of 1, 5, 10, 15, 20, and 25 ng/kg was used to assess the concentration-response linearity. Agilent Open Lab CDS (EZ Chrome Edition) software version A.04.08 (Agilent Technologies, USA) was used to acquire and process aflatoxin signals. For each toxin, LOD and LOQ were determined using signal-to-noise ratios of 3:1 and 10:1, respectively.
Recovery analysis of aflatoxin
Recovery analysis was performed for AFB1 and AFB2 to validate the procedure for extracting toxins from the sample. Briefly, 5 g of a healthy sample was spiked with different concentrations (2, 5, 10, and 20 ppb for AFB1 and 0.5, 1.25, 2.5, and 5 ppb for AFB2) of the total aflatoxin standard. Toxin extraction was performed using the immuno-affinity column as described above.17 Three replicates were maintained for each concentration, and the mean recovery percentage was calculated.
Assessment of mycoflora in maize seeds
The standard blotter technique was used to evaluate mycoflora on maize seed surfaces.18 Under a stereo zoom microscope, incubated seeds were visually evaluated to examine the growth pattern of mycoflora.19 One representative colony from each fungal genus in each seed sample was cultivated in potato dextrose agar (PDA) media and identified based on “habit characters”.
Computation for diversity indices
The method suggested by Tadych et al.20 was used to calculate the relative densities (RD) of fungal species and genera. Alpha diversity can be determined using calculations of the Simpson diversity index (D),21 Shannon–Wiener diversity index22 and species evenness index.23 The values obtained for each index were ranked in the following steps. This study used Fernando’s biodiversity scale to score the indices (Table 2). Beta diversity refers to the fluctuation in species diversity between two regions. This was used for a comprehensive comparison of species diversity. b-diversity was calculated using the formula provided by Fontana et al.24
Table (2):
Edwino Fernando’s ranking of Biodiversity Indices
Relative values |
Shannon (H’) Index |
Evenness (E) |
|---|---|---|
Very high |
3.5 and above |
0.75 – 1.00 |
High |
3.0 – 3.49 |
0.50 – 0.74 |
Moderate |
2.5 – 2.99 |
0.25 – 0.49 |
Low |
2.0 – 2.49 |
0.15 – 0.24 |
Very low |
1.9 and below |
0.05 – 0.14 |
Isolation of aflatoxigenic fungi and morphological characterization
To isolate aflatoxigenic fungi from maize seed samples collected from different locations, Pitt and Hocking’s25 method was used. Maize seed samples were crushed into a fine powder using a hand mill, and 1 g of the powdered sample was serially diluted in 10 ml of sterile distilled water until 10-4 and 10-5 dilutions were achieved. An aliquot (1 ml) was then plated in a sterile Petri plate containing Rose Bengal Chloramphenicol Agar medium.26 The majority of Aspergillus sp. produces single spore colonies, which were then randomly selected and individually cultured on a PDA medium by single hypha transfer.27 The plates were incubated at 30 °C for 7 days. After the incubation period, macroscopic characteristics such as colony morphology, colour, and sclerotia formation were observed. For microscopic observation, slides were prepared and the fungal structures were stained using lactophenol cotton blue stain. Different Aspergillus species were identified based on the presence of conidiophores, vesicles, phialides, metulae, and conidia.
Molecular confirmation of Aspergillus isolates
Molecular confirmation of Aspergillus isolates was performed using internal transcribed spacer (ITS) 18S rRNA sequencing. DNA extraction was performed from the fungal mycelial mat using the CTAB method described by Doyle28 and Allen et al.29 The polymerase chain reaction (PCR) was conducted with 18S rDNA universal primers ITS 1 (TCCGTAGCTGAACCTGCCG) and ITS 4 (TCCTCCGCTTATTGATATGC) to verify the isolates.30 The PCR procedure comprised 35 cycles, initiated with a denaturation phase at 94 °C for 5 min, followed by 60 s denaturation at 94 °C, annealing at 65 °C, 60 s extension at 72 °C, and a final extension of 5 min at 72 °C. Agarose gel electrophoresis (1.2%) was performed to observe the amplified products using a gel documentation unit (Alpha Imager 2000). Sanger dideoxy sequencing was used to sequence the amplified PCR products.
Toxigenic potential of Aspergillus isolated from maize kernels
The HPLC-FLD method was used to assess the aflatoxigenic capacity of the Aspergillus isolates. Five agar plugs were collected from a seven-day-old culture in a weighed microfuge tube. HPLC grade chloroform (1 ml) was added, vortexed, and centrifuged at 10,000 rpm for 15 min for extraction. The supernatants were transferred to three new microfuge tubes. The supernatant was dried in a vacuum concentrator. Then, 50% methanol (1 ml) was used to dissolve and store the air-dried residues in an amber glass vial at 4 °C until HPLC analysis.
Statistical analysis
All data were analyzed using descriptive statistics in the SPSS Statistics package (version 21.0; SPSS Inc. Chicago, IL, USA). Alpha diversity indices Shannon, Simpson, taxa, individual, Chao 1, beta diversity indices, and principal component analysis (PCA) were calculated using the R statistics using package “vegan”, design of experiments by package “DOE”, heatmap by heatmap.3
Sensitivity, linearity, and recovery analysis
HPLC analysis of aflatoxins was validated using a reference standard for mixed aflatoxins. In the present study, multipoint calibration curves for AFB1, AFB2, AFG1, and AFG2 were created by injecting six different concentrations of mixed standards. AFB1 and AFG1 multipoint calibration curves were linear from 1 ppb to 25 ppb, whereas AFB2 and AFG2 multipoint calibration curves had linearity ranging from 0.25 ppb to 6.25 ppb (Figure 1a, 1b, 1c and 1d). Linear regression analysis was used to evaluate the linearity between the instrument response and concentration (Table 3). The regression correlation coefficients above 0.99 for all four aflatoxin types (AFB1 = 0.998, AFB2 = 0.999, AFG1 = 0.996, and AFG2 = 0.996) showed good linearity. AFB1, AFG1, AFB2, and AFG2 exhibited limits of detection (LOD) of 0.04, 0.029, 0.057, and 0.030 ppb and limits of quantification (LOQ) of 0.12, 0.086, 0.17, and 0.091 ppb, respectively.
Table (3):
Sensitivity and linearity of aflatoxin B1, B2, G1 and G2 in HPLC analysis
Type of aflatoxin |
Calibration curve |
R2 |
LOD (ppb) |
LOQ (ppb) |
|---|---|---|---|---|
B1 |
y = 949052x + 129243 |
0.9982 |
0.04 |
0.12 |
B2 |
y = 2E+06x – 55706 |
0.9996 |
0.029 |
0.086 |
G1 |
y = 888602x – 456896 |
0.9966 |
0.057 |
0.17 |
G2 |
y = 1E+06x – 187226 |
0.9964 |
0.030 |
0.091 |
LOD – Limit of Detection, LOQ – Limit of Quantification
Each concentration was injected thrice
Linearity was performed using linear regression analysis
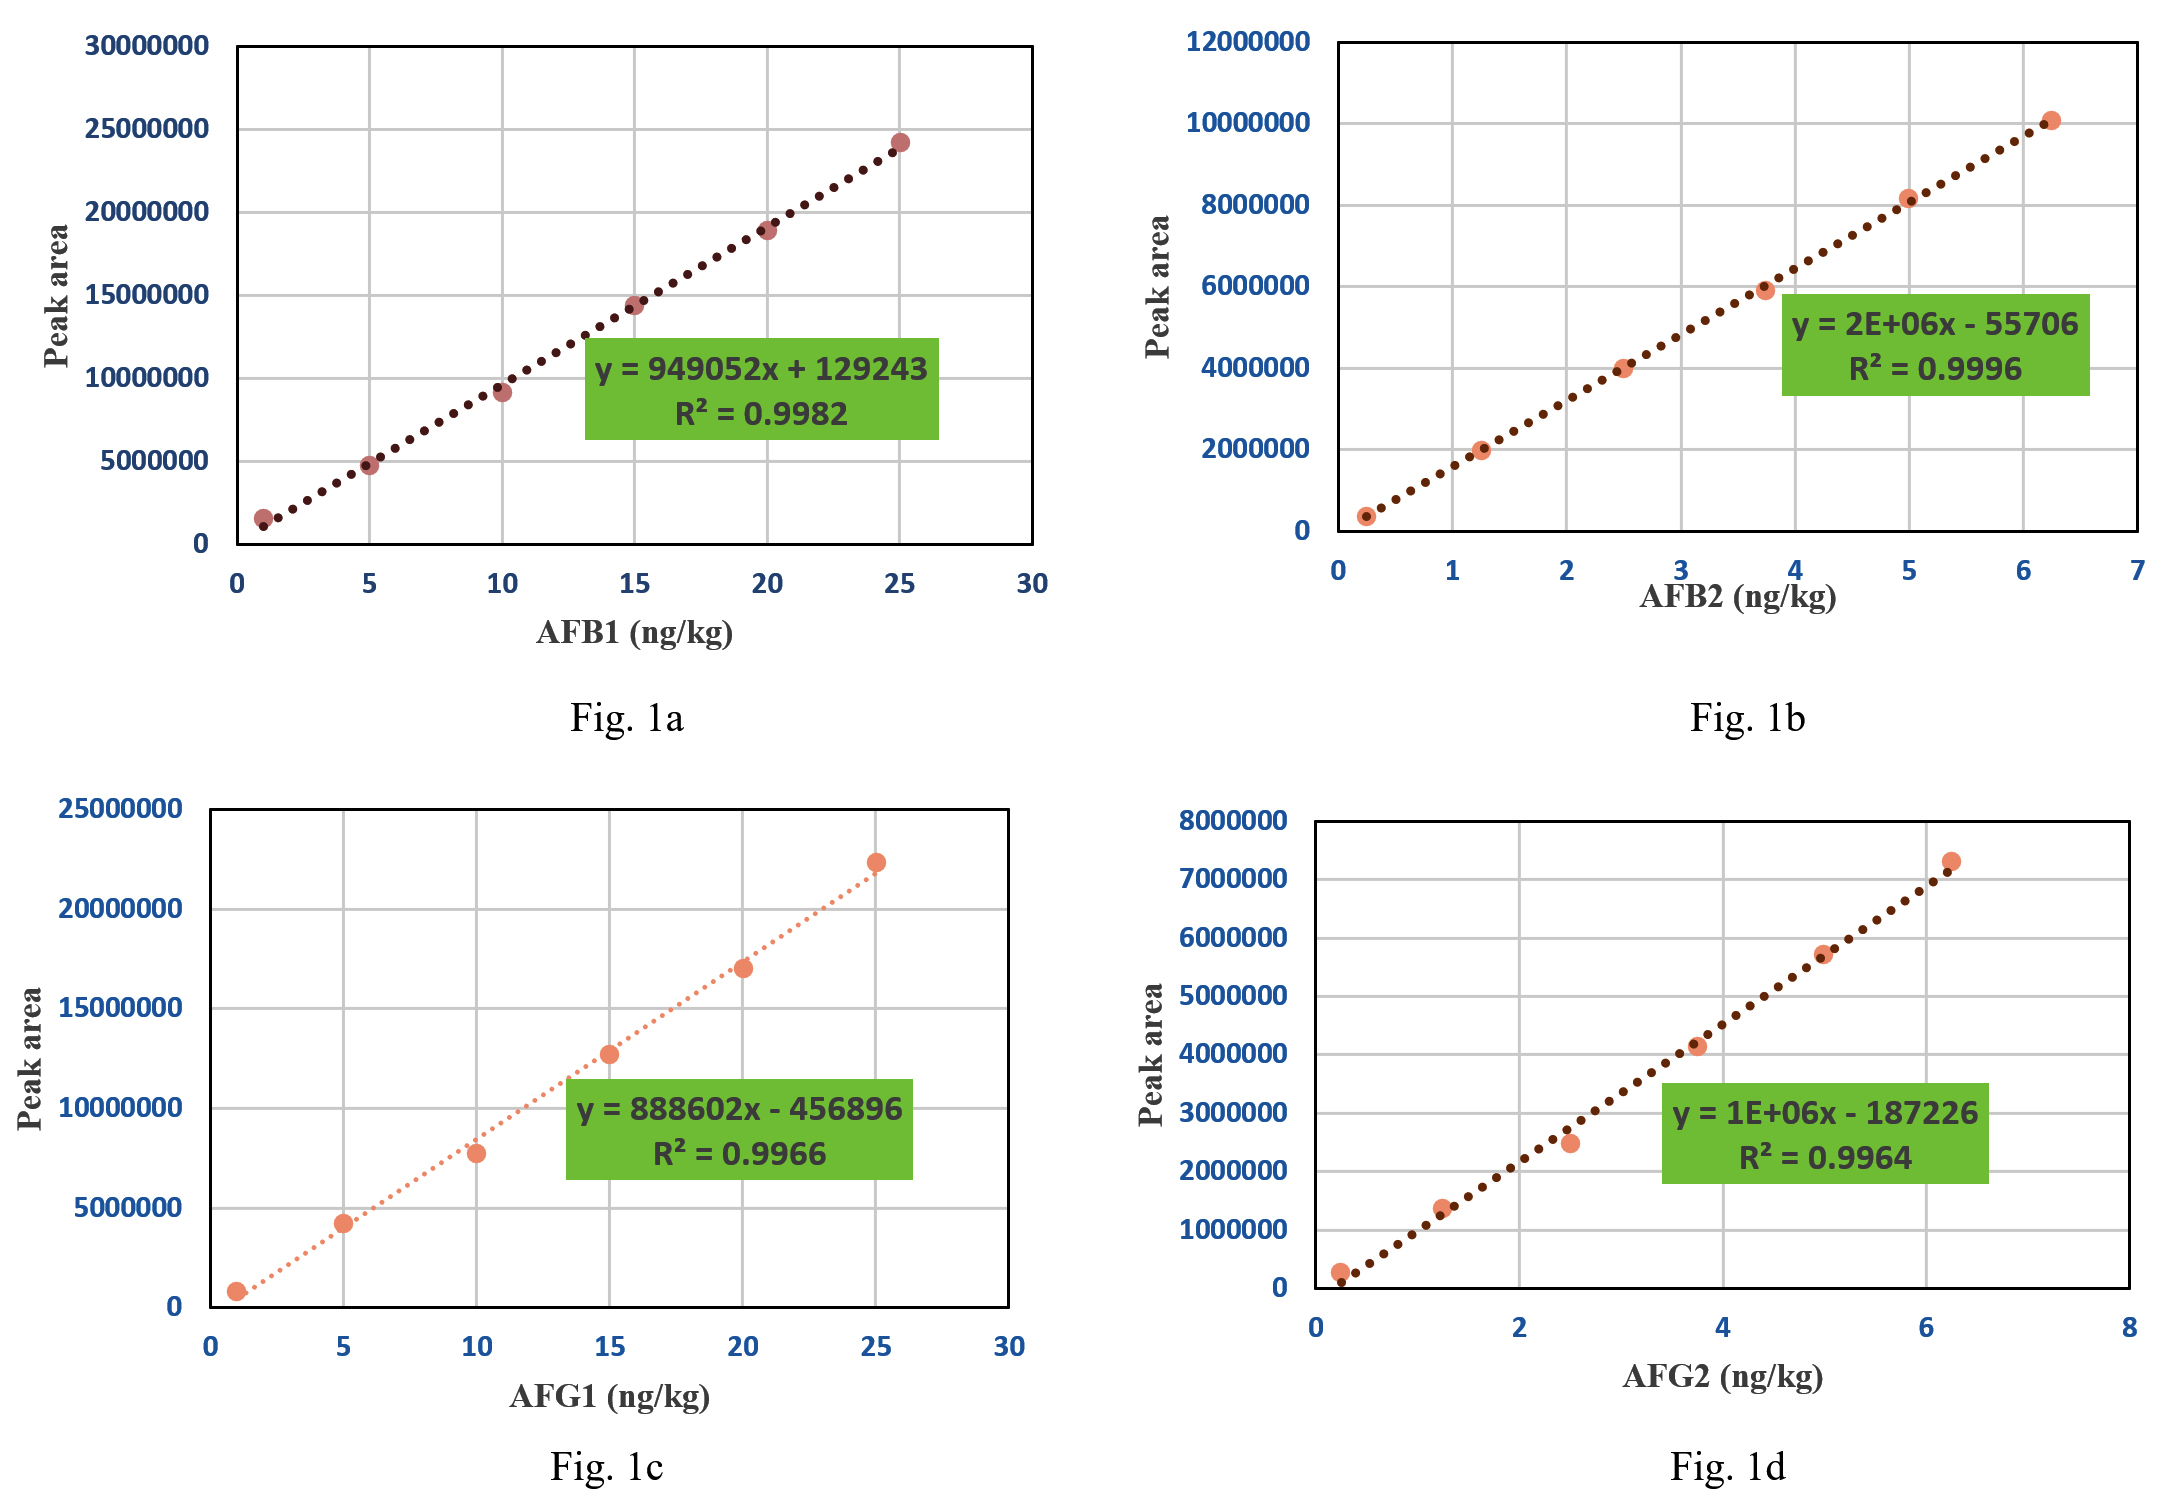
Figure 1. Multipoint calibration curve for AFB1 (1a), AFB2 (1b), AFG1 (1c) and AFG2 (1d)
The mean recoveries of AFB1 for spiking amounts of 2, 5, 10, and 20 ppb were 1.07, 4.55, 8.82 and 18.91 ng/kg with per cent recoveries of 53.50, 91.0, 88.2, and 94.55%, respectively, whereas the mean recoveries of AFB2 for spiking amounts of 0.5, 1.25, 2.5, and 5 ppb were 0.21, 0.93, 2.07 and 4.40 ng/kg and the per cent recovery were 42.7%, 74.4%, 82.67% and 87.93%, respectively (Table 4).
Table (4):
Recovery analysis of aflatoxin B1 and B2 in maize products by HPLC analysis
| Particulars | Recovery (ng/kg) | |||||||
|---|---|---|---|---|---|---|---|---|
| AFB1 | AFB2 | |||||||
| Spiking amount (ng/kg or ppb) | ||||||||
| 2 | 5 | 10 | 20 | 0.5 | 1.25 | 2.5 | 5 | |
| Sample1 | 1.05 | 4.46 | 8.2 | 17.96 | 0.21 | 0.91 | 1.92 | 4.18 |
| Sample2 | 1.06 | 4.69 | 9 | 19.1 | 0.21 | 0.96 | 2.11 | 4.44 |
| Sample3 | 1.1 | 4.5 | 9.26 | 19.67 | 0.22 | 0.92 | 2.17 | 4.57 |
| Mean recovery | 1.07 | 4.55 | 8.82 | 18.91 | 0.21 | 0.93 | 2.07 | 4.40 |
| Std dev | 0.02 | 0.10 | 0.45 | 0.71 | 0.00 | 0.02 | 0.11 | 0.16 |
| Recovery % | 53.50 | 91.00 | 88.20 | 94.55 | 42.67 | 74.40 | 82.67 | 87.93 |
| Mean recovery | 81.81 % | 71.92 % | ||||||
Natural occurrence of aflatoxin contamination in maize products
In total, 32 maize-based product samples were collected from several major cities and towns to evaluate aflatoxin contamination using HPLC. Among the 32 samples tested, 30 (93.75%) were contaminated with aflatoxins, ranging from 0.296 to 13.595 ppb, and only two samples (6.25%) were free from aflatoxin contamination (Table 5). However, all samples were below the Indian regulatory limits (< 15 ppb), whereas 10 samples (31.25%) were above the European regulatory levels (> 4 ppb) (Figure 2). Furthermore, the majority of the samples (73.78%) contained both AFB1 and AFB2, and six samples (18.75%) of maize products contained only AFB1.
Table (5):
Determination of aflatoxin contamination in different maize products by HPLC analysis
No. |
Sample code |
Amount of aflatoxin (ppb) |
Type of aflatoxin |
|---|---|---|---|
1 |
MP 1 |
1.922 |
B1&B2 |
2 |
MP 2 |
8.896 |
B1&B2 |
3 |
MP 3 |
1.749 |
B1 |
4 |
MP 4 |
0.580 |
B1&B2 |
5 |
MP 5 |
4.590 |
B1&B2 |
6 |
MP 6 |
13.595 |
B1&B2 |
7 |
MP 7 |
4.151 |
B1&B2 |
8 |
MP 8 |
6.083 |
B1&B2 |
9 |
MP 9 |
4.999 |
B1&B2 |
10 |
MP 10 |
0.580 |
B1 |
11 |
MP 11 |
1.615 |
B1&B2 |
12 |
MP 12 |
0.849 |
B1&B2 |
13 |
MP 13 |
0.808 |
B1 |
14 |
MP 14 |
1.200 |
B1&B2 |
15 |
MP 15 |
0.868 |
B1 |
16 |
MP 16 |
6.451 |
B1&B2 |
17 |
MP 17 |
– | |
18 |
MP 18 |
1.398 |
B1&B2 |
19 |
MP 19 |
1.252 |
B1 |
20 |
MP 20 |
9.932 |
B1&B2 |
21 |
MP 21 |
0.689 |
B1&B2 |
22 |
MP 22 |
1.492 |
B1&B2 |
23 |
MP 23 |
1.660 |
B1&B2 |
24 |
MP 24 |
1.173 |
B1&B2 |
25 |
MP 25 |
0.689 |
B1&B2 |
26 |
MP 26 |
9.191 |
B1&B2 |
27 |
MP 27 |
1.810 |
B1&B2 |
28 |
MP 28 |
5.731 |
B1&B2 |
29 |
MP 29 |
– | |
30 |
MP 30 |
2.584 |
B1 |
31 |
MP 31 |
0.466 |
B1 |
32 |
MP 32 |
0.838 |
B1&B2 |
<LOD – less than the Limit of detection
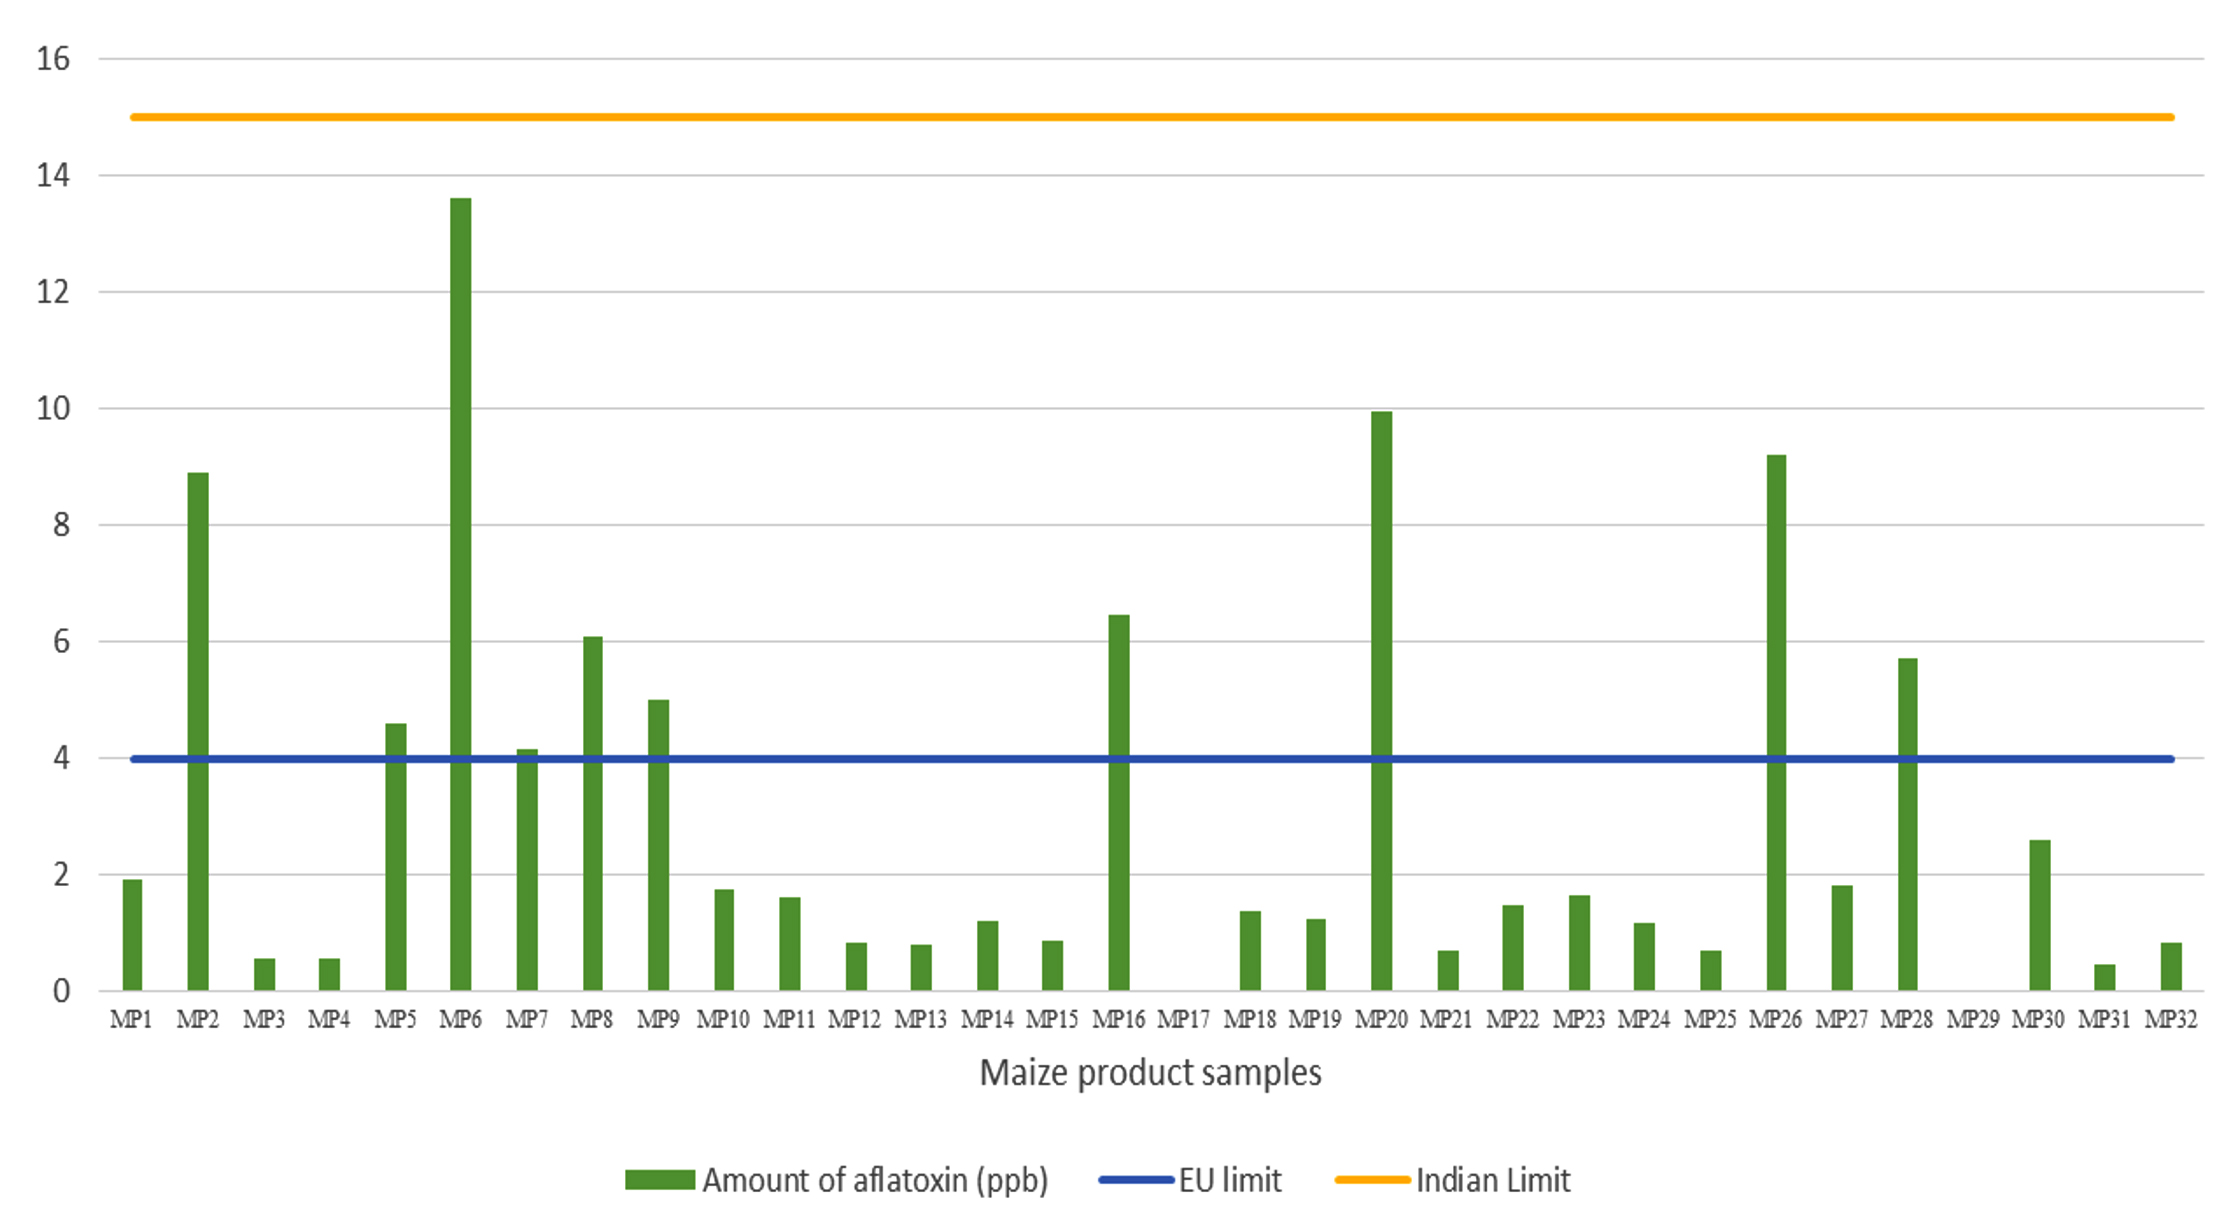
Figure 2. Natural occurrence of aflatoxin contamination in maize products
Mycoflora diversity on maize seeds
Mycoflora diversity on maize seeds collected from different regions of Tamil Nadu was assessed. The mycoflora populations of individual maize seeds were recorded. The microflora diversity in individual seeds varied from zero or no diversity to high diversity (Figure 3).
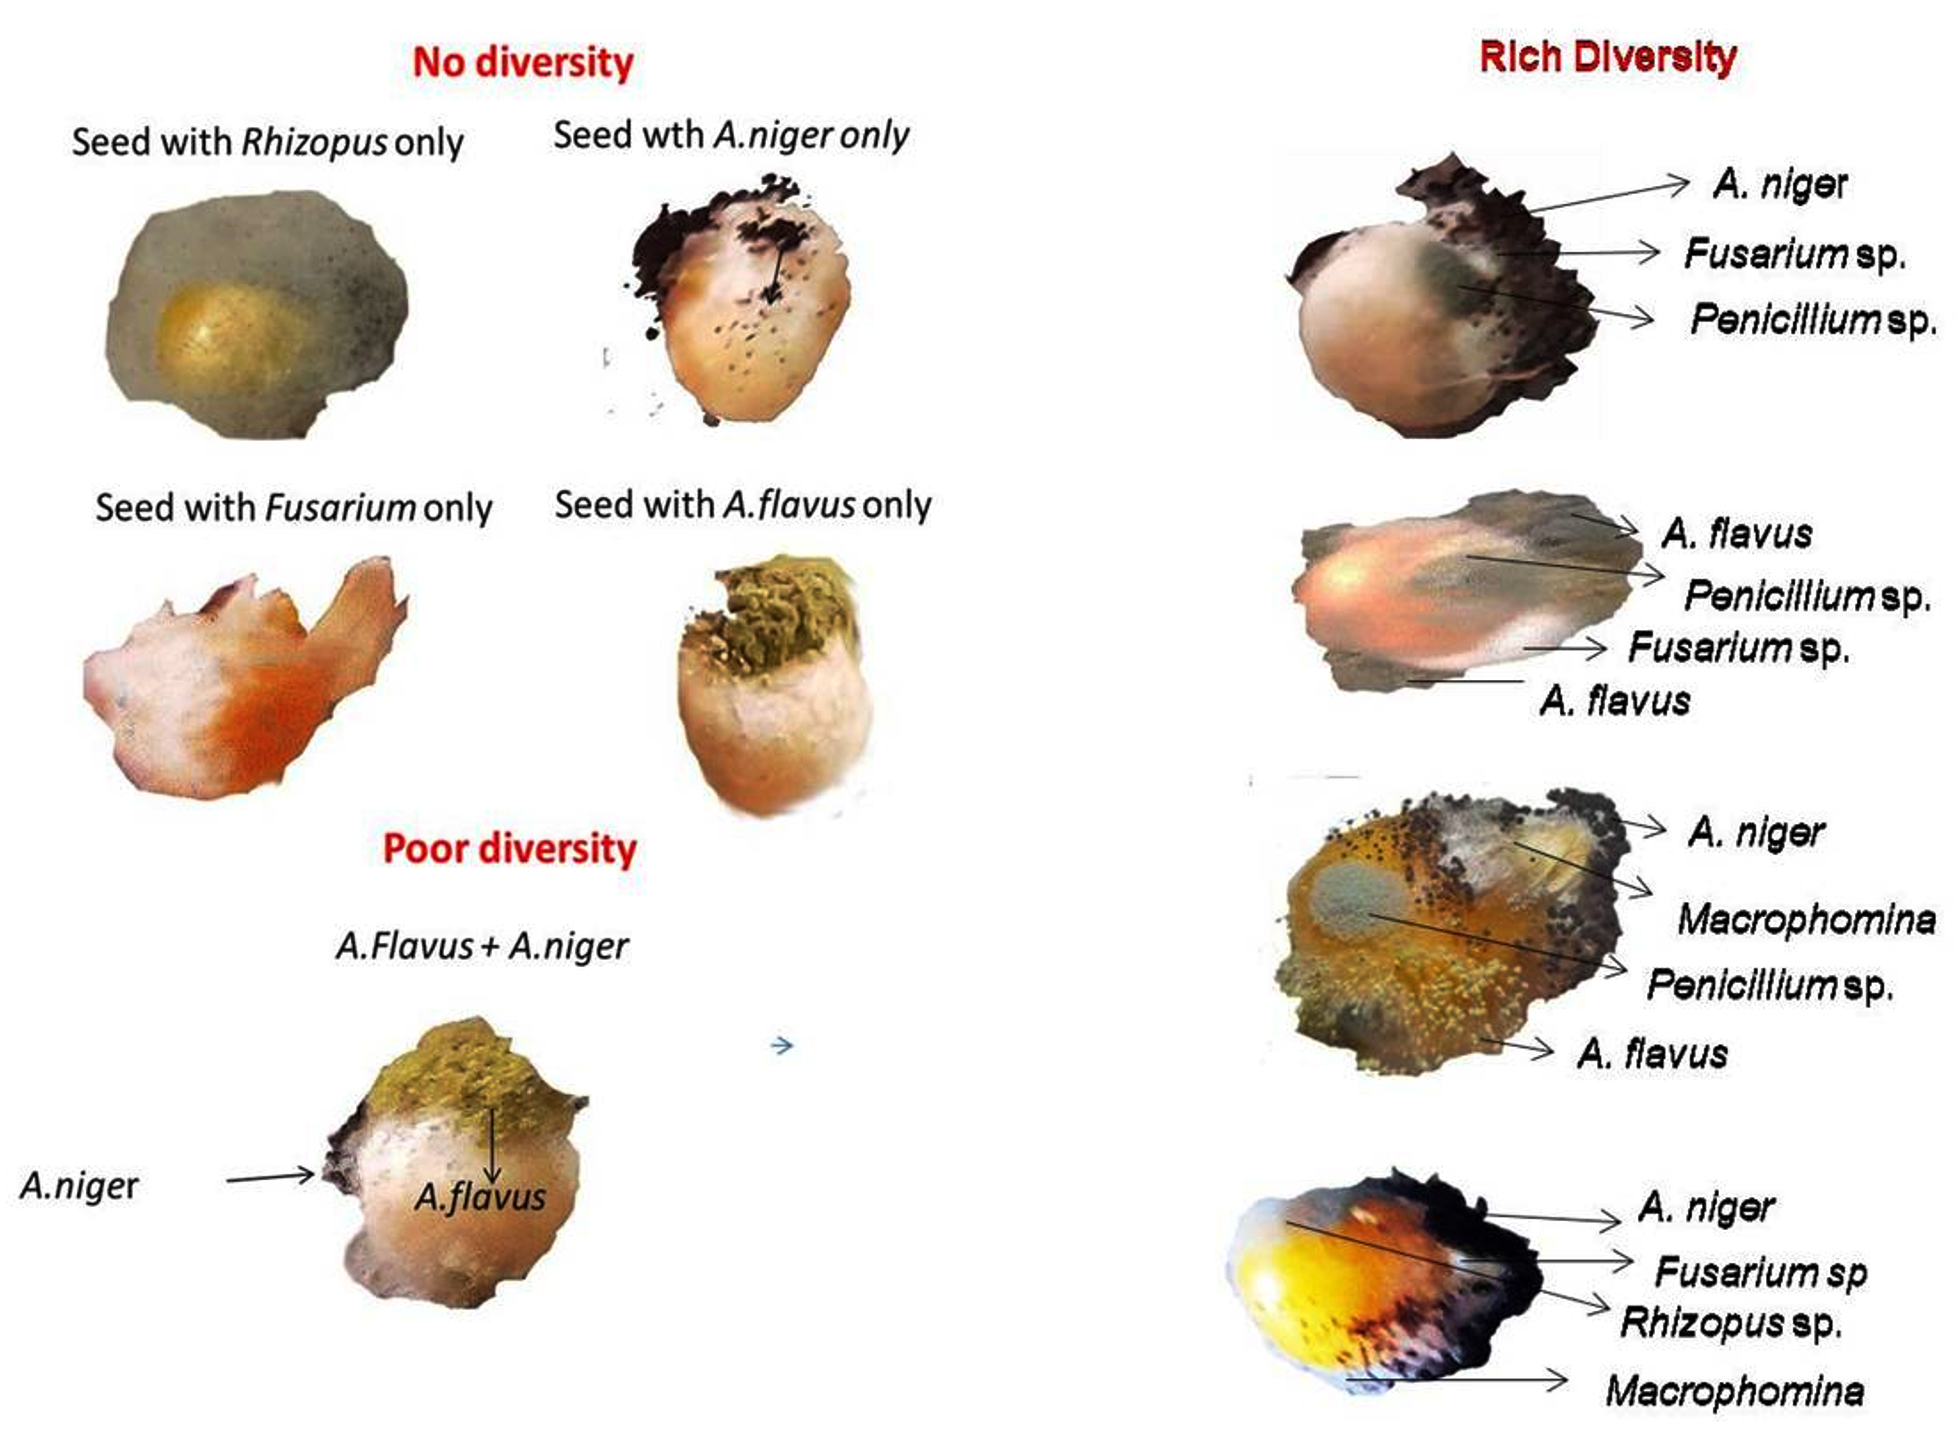
Figure 3. Mycoflora diversity on maize seeds collected from different locations
Proportion of fungal species in the mycoflora of maize seeds
A total of 1152 mycoflora isolates encompassing 10 distinct species were identified, of which five belonged to the genus Aspergillus, accounting for 82% of the total mycoflora population (A. niger 29%, A. flavus 25%, A. fumigatus 17%, A. tamarii 10%, and A. oryzae 1%). The dominant mycoflora belonged to the genus Aspergillus followed by Fusarium spp. (9%). Other fungal genera included Penicillium spp. (5%), Rhizopus spp. (2%), Alternaria spp. (1%), and Macrophomina (1%) (Figure 4).
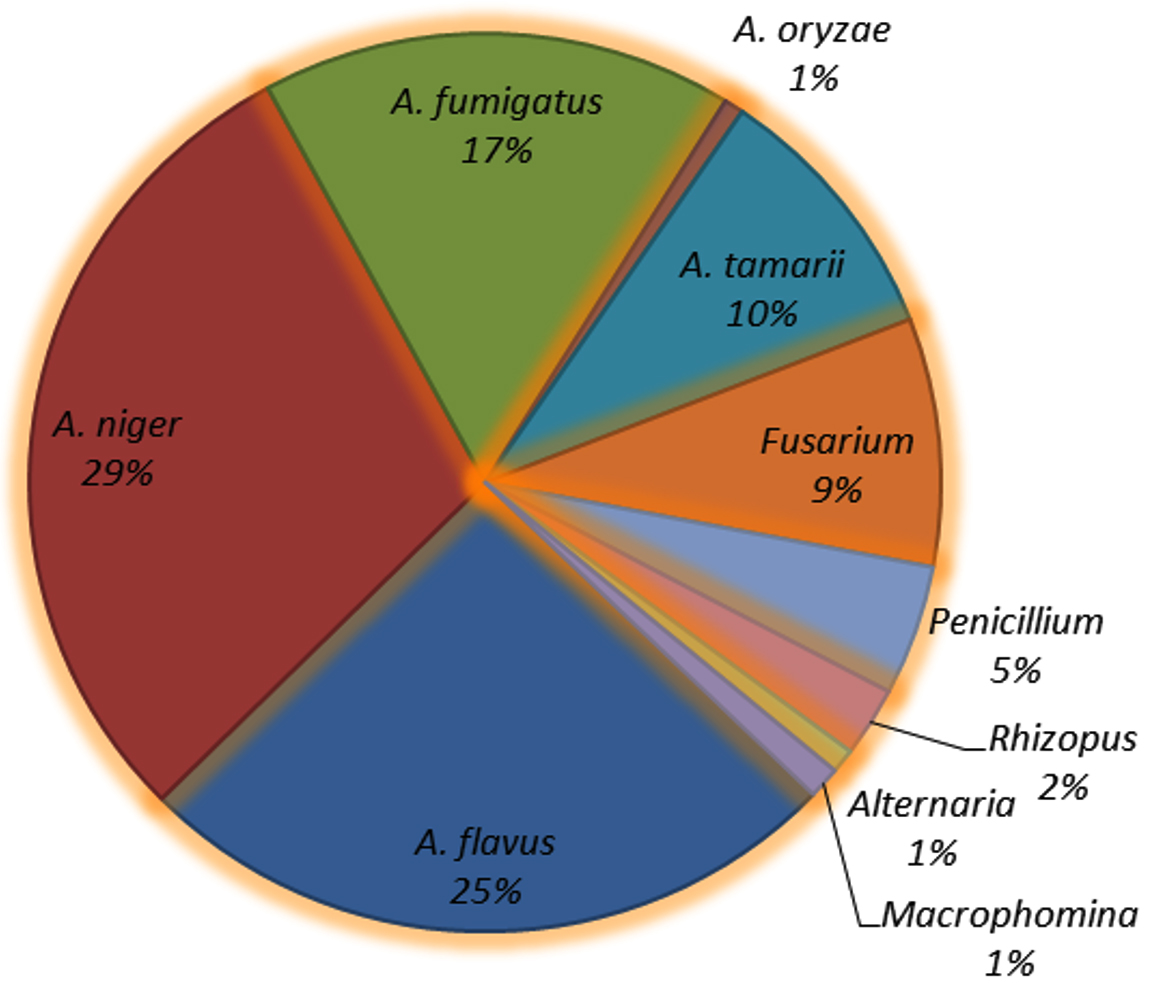
Figure 4. Percent mycoflora population on maize seeds
Fungal species composition at different locations
Two Aspergillus species, namely A. niger and A. flavus, were identified at all the localities, whereas A. oryzae was observed in only four regions. Fusarium spp. were detected in each region, excluding Virudhunagar. Penicillium spp. were detected in five regions, Macrophomina and Rhizopus spp. in three regions each, and Alternaria spp. in two regions. Tuticorin had the most species of mycoflora (118), followed by Dharmapuri (110), and other sites with 44 to 102 species (Figure 5).
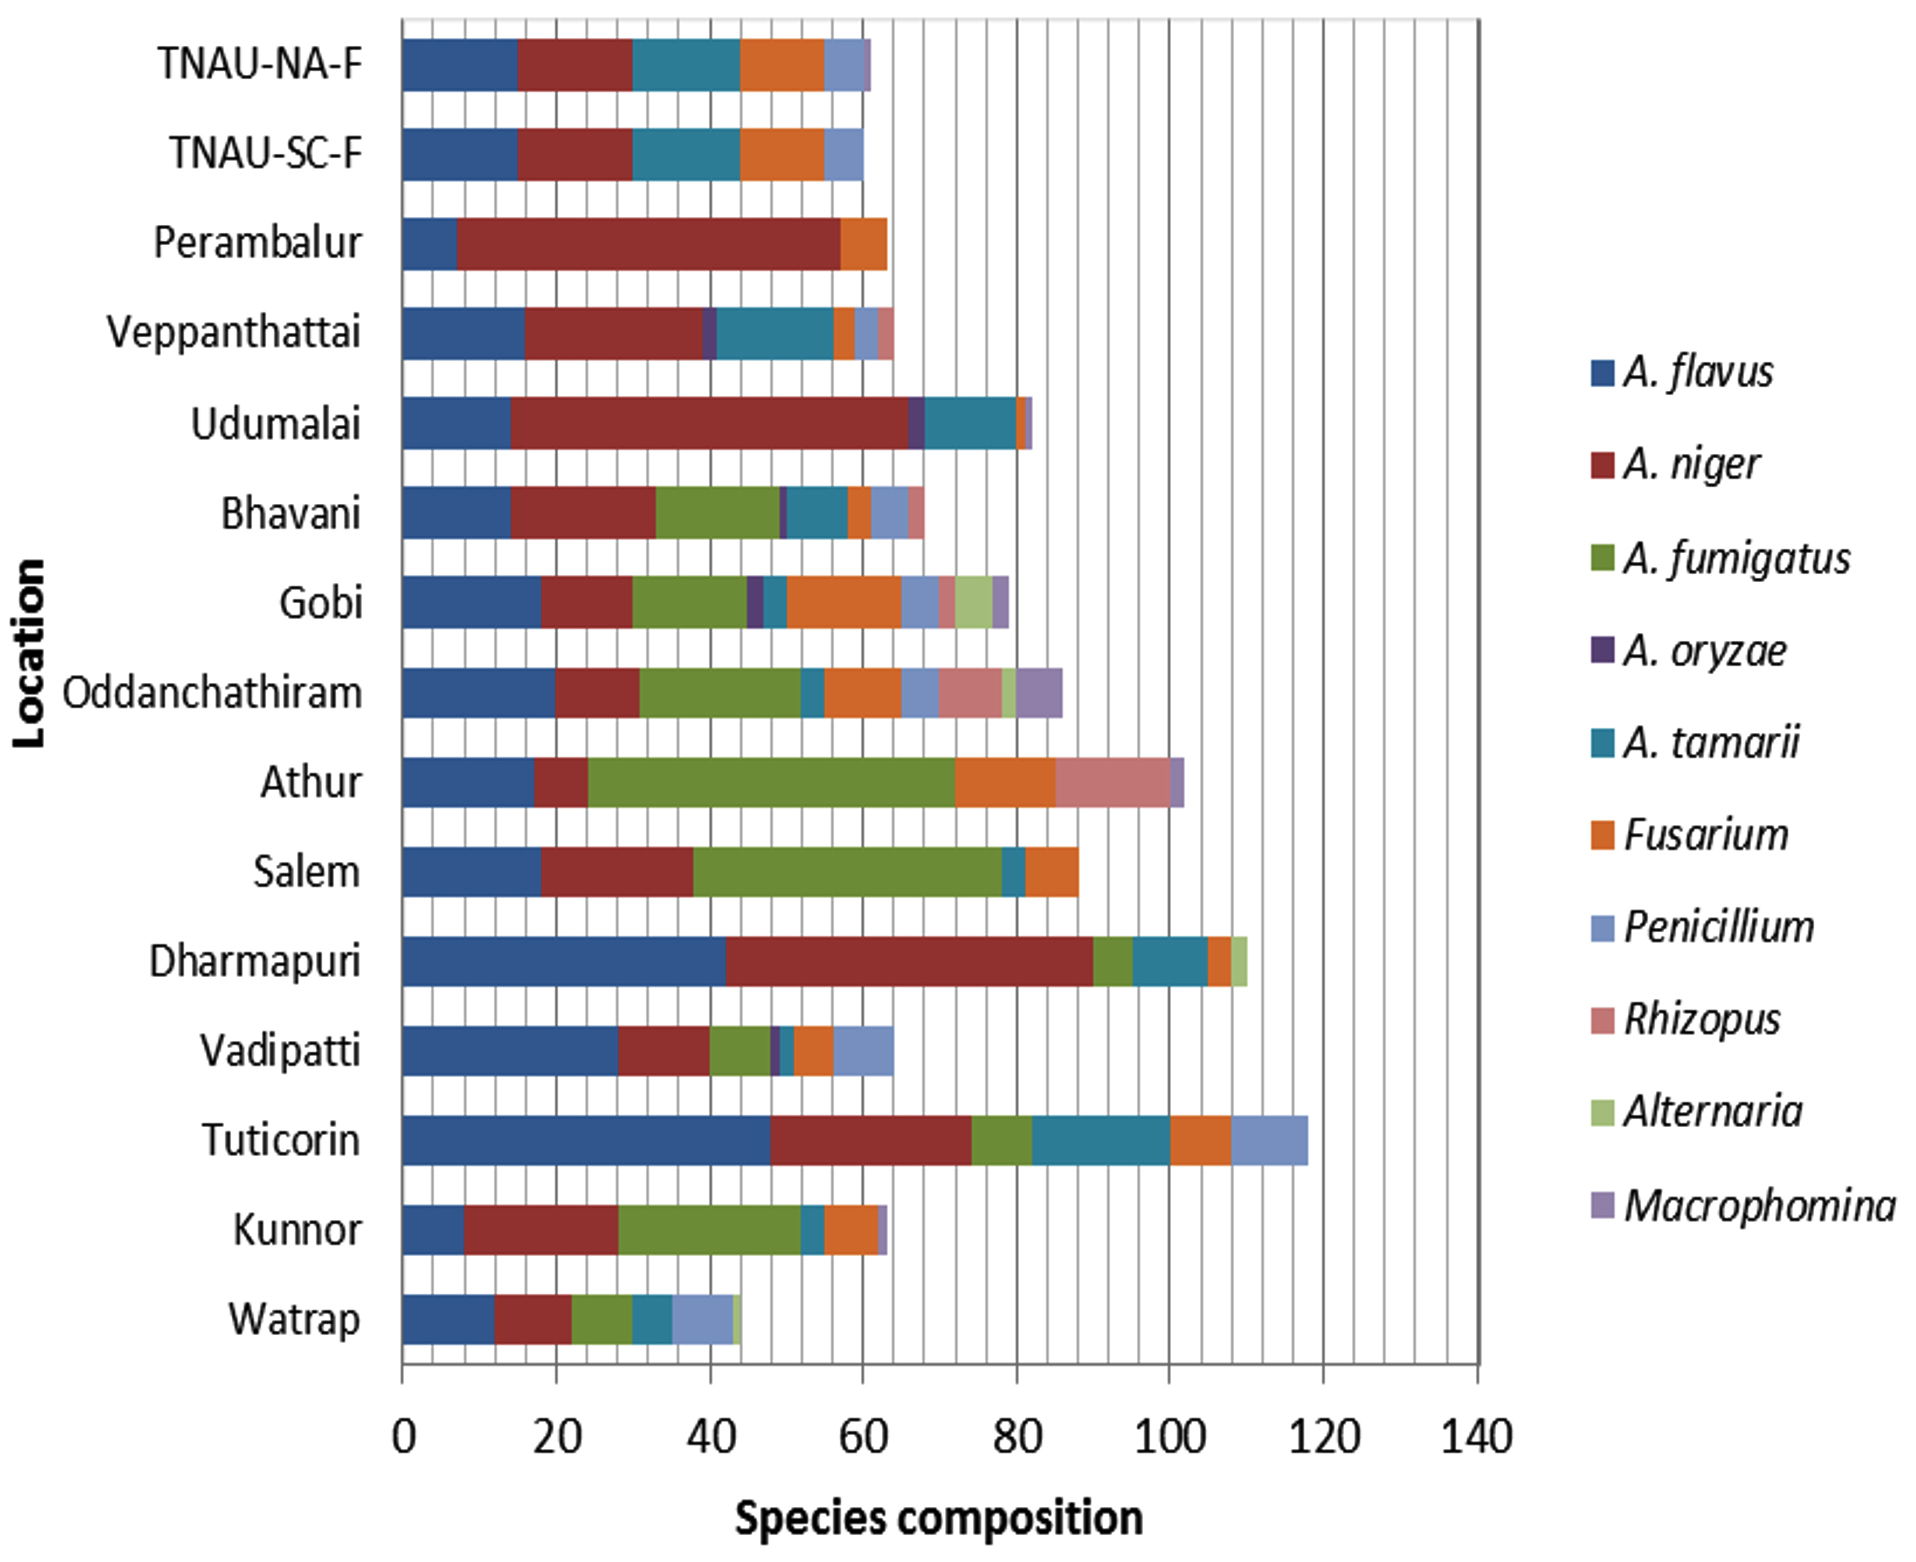
Figure 5. Fungal species composition of mycoflora in maize seeds at different locations
Alpha diversity analysis of maize seed mycoflora
The Shannon–Weiner index (H’) and Simpson’s index are widely used to characterize alpha diversity. The Shannon–Weiner index (H’) clarifies the impact of abundance. The Shannon index was < 1.9 in every location, except for Gobi (1.95) and Ottanchathiram (1.927), based on Fernando’s Ranking of Biodiversity Indices, indicating extremely low diversity of mycoflora (Table 6). Because the Shannon diversity index (H) is influenced by abundance, mycoflora abundance was absent in all locations. The Simpson diversity index was used to determine a measure of diversity that considers the number of taxa and their abundance, with more species observed and their abundances considered.
Table (6):
Alpha-diversity analysis of maize seed mycoflora recorded in different locations
| District | Virudhunagar | Tuticorin | Madurai | Dharmapuri | Salem | Dindigul | Erode | Tiruppur | Perambalur | Coimbatore | |||||
|---|---|---|---|---|---|---|---|---|---|---|---|---|---|---|---|
| Location | Watrap | Kunnor | Tuticorin | Vadipatti | Dharmapuri | Salem | Athur | Ottanchathiram | Gobi | Bhavani | Udumalai | Veppanthattai | Perambalur | TNAU-SC-F | TNAU-NA-F |
| Taxa_S | 6 | 6 | 6 | 7 | 6 | 5 | 6 | 9 | 10 | 8 | 6 | 7 | 3 | 5 | 6 |
| Individuals | 44 | 63 | 118 | 64 | 110 | 88 | 102 | 86 | 79 | 68 | 82 | 64 | 63 | 60 | 61 |
| Dominance_D | 0.187 | 0.265 | 0.247 | 0.254 | 0.342 | 0.300 | 0.285 | 0.152 | 0.148 | 0.186 | 0.447 | 0.241 | 0.646 | 0.207 | 0.200 |
| Simpson_1-D | 0.813 | 0.735 | 0.753 | 0.747 | 0.658 | 0.700 | 0.715 | 0.848 | 0.852 | 0.814 | 0.553 | 0.759 | 0.354 | 0.793 | 0.800 |
| Shannon_H | 1.587 | 1.409 | 1.539 | 1.521 | 1.236 | 1.314 | 1.434 | 1.927 | 1.950 | 1.718 | 1.039 | 1.511 | 0.636 | 1.517 | 1.568 |
| Evenness_e^H/S | 0.815 | 0.682 | 0.777 | 0.654 | 0.574 | 0.744 | 0.699 | 0.763 | 0.703 | 0.697 | 0.471 | 0.647 | 0.629 | 0.912 | 0.800 |
| Equitability_J | 0.886 | 0.787 | 0.859 | 0.782 | 0.690 | 0.816 | 0.801 | 0.877 | 0.847 | 0.826 | 0.580 | 0.777 | 0.579 | 0.943 | 0.875 |
| Fisher_alpha | 1.877 | 1.631 | 1.336 | 2.003 | 1.363 | 1.149 | 1.393 | 2.532 | 3.032 | 2.355 | 1.490 | 2.003 | 0.656 | 1.297 | 1.650 |
| Berger-Parker | 0.273 | 0.381 | 0.407 | 0.438 | 0.436 | 0.455 | 0.471 | 0.244 | 0.228 | 0.279 | 0.634 | 0.359 | 0.794 | 0.250 | 0.246 |
| Chao-1 | 6 | 6 | 6 | 7 | 6 | 5 | 6 | 9 | 10 | 8 | 6.5 | 7 | 3 | 5 | 6 |
TNAU-SC-F: TNAU – Seed Centre- Farm, TNAU–NA-F: TNAU-New Area- Farm
Taxa S – number of species recorded = species richness
Individuals – total number of mycoflora observed
Chao 1 is the expected species richness
The highest Simpson index of 0.852 was recorded in Gobi, followed by Ottanchathiram (0.848), Bhavani (0.814), and Watrap (0.813%), representing the highest dominance of mycoflora, as the Simpson index is influenced by dominance.
Species richness, defined as the number of species or operational taxonomic units (OTUs) in a given area, is a fundamental metric of alpha diversity. Gobi exhibited the greatest species richness with ten species, followed by Ottanchathiram with nine species, and Bhavani with eight species. Salem and TNAU Seed Centre Farm had the lowest species richness, with five recorded number of species.
Rare species are a group of mycoflora that are uncommon, scarce, and have small populations. According to the step graph, the rare species were Alternaria, Macrophomina, Rhizopus, and A. oryzae (Figure 6).
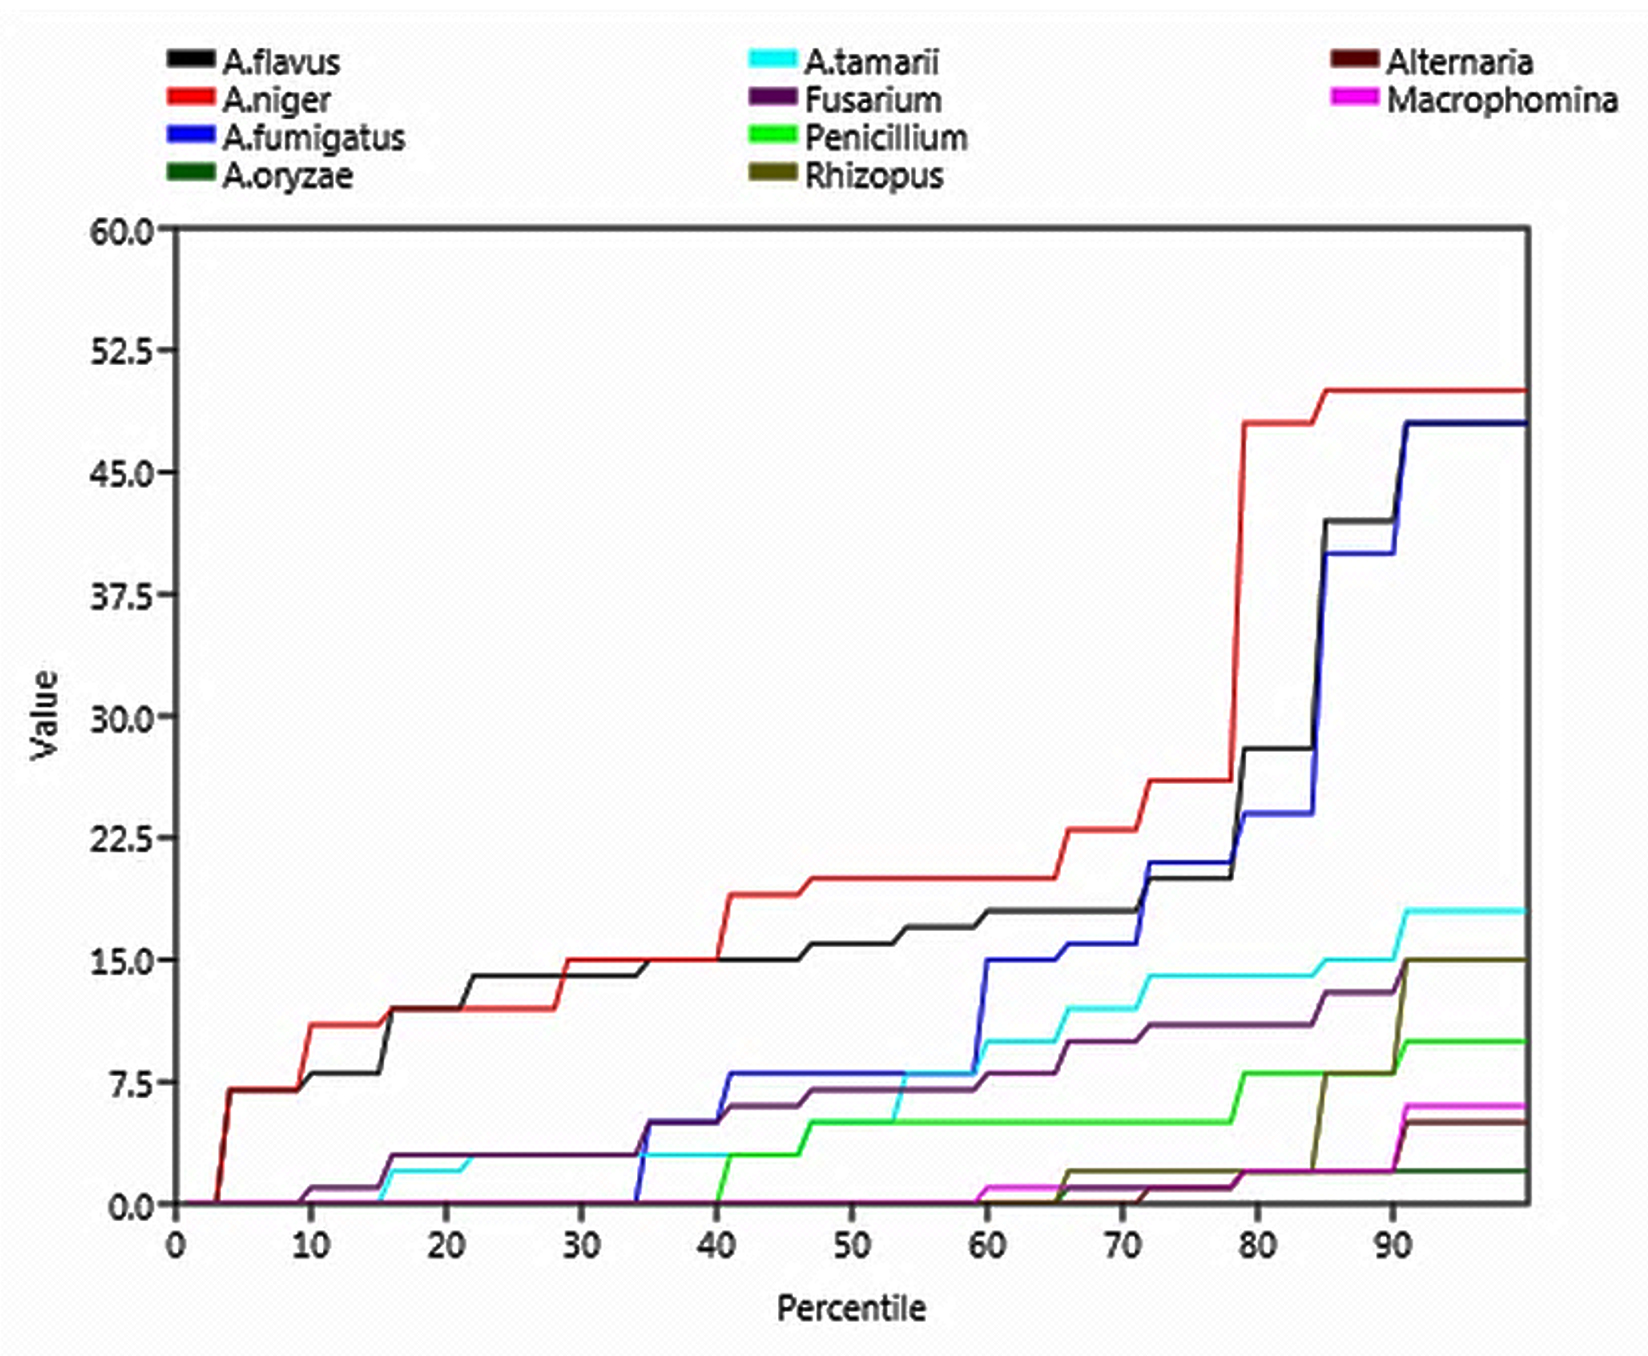
Figure 6. Step graph showing species richness and rareness of mycoflora
The evenness index lies between 0 and 1.0 and reflects the degree of equal abundance among different taxa within the community. In our study, all locations and species had even distributions, as indicated by the evenness values > 0.5. The mycoflora showed equal distribution at all locations.
Beta diversity analysis of maize seed mycoflora between locations using the Bray-Curtis method
Beta diversity refers to the differences in species composition between samples. It measures the variation in the overall taxonomic composition between two samples. Bray-Curtis similarity measures the degree of species composition similarity between two sites, ranging from 0 (no species shared) to 1 (identical composition). TNAU New Area Farm had a similarity index of 99% with TNAU Seed Centre Farm; they had a Bray-Curtis similarity of 1 (100%), that is, they had similar mycoflora composition with the same abundance (Table 7 and 8). Gobi had a similarity index of 82.42% with Ottanchathiram, and Salem with Dindigul had a similarity index of 82.12%; these locations share species, which means that they have similar mycoflora with exactly the same abundance. A very low similarity index of 24.24% was observed between Perambalur and Athur, followed by 25% between Udumalai and Athur, because they do not share mycoflora. Pairwise comparisons of the similarities between other locations ranged from 25% to 88%.
Table (7):
Beta-diversity analysis of maize seed mycoflora by Bray-Curtis method
| District | Virudhunagar | Tuticorin | Madurai | Dharmapuri | Salem | Dindigul | Erode | Tiruppur | Perambalur | Coimbatore | |||||
|---|---|---|---|---|---|---|---|---|---|---|---|---|---|---|---|
| Locations | Watrap | Kunnor | Tuticorin | Vadipatti | Dharmapuri | Salem | Athur | Ottanchathiram | Gobi | Bhavani | Udumalai | Veppanthattai | Perambalur | TNAU– SC-F | TNAU-NA-F |
| Watrap | * | 54.2056 | 53.0864 | 74.0741 | 42.8571 | 50 | 36.9863 | 60 | 63.4146 | 71.4286 | 42.8571 | 55.5556 | 31.7757 | 61.5385 | 60.9524 |
| Kunnor | * | * | 50.8287 | 55.1181 | 45.0867 | 82.1192 | 56.9697 | 68.4564 | 64.7887 | 74.8092 | 45.5172 | 53.5433 | 52.381 | 53.6585 | 54.8387 |
| Tuticorin | * | * | * | 69.2308 | 75.4386 | 54.3689 | 36.3636 | 53.9216 | 54.8223 | 61.2903 | 53 | 65.9341 | 43.0939 | 64.0449 | 63.6871 |
| Vadipatti | * | * | * | * | 57.4713 | 59.2105 | 44.5783 | 68 | 71.3287 | 68.1818 | 41.0959 | 57.8125 | 37.7953 | 62.9032 | 62.4 |
| Dharmapuri | * | * | * | * | * | 49.4949 | 30.1887 | 44.898 | 45.5026 | 55.0562 | 76.0417 | 59.7701 | 67.052 | 50.5882 | 50.2924 |
| Salem | * | * | * | * | * | * | 74.7368 | 68.9655 | 65.8683 | 70.5128 | 44.7059 | 55.2632 | 43.7086 | 54.0541 | 53.6913 |
| Athur | * | * | * | * | * | * | * | 69.1489 | 61.8785 | 49.4118 | 25 | 33.7349 | 24.2424 | 40.7407 | 41.7178 |
| Ottanchathiram | * | * | * | * | * | * | * | * | 82.4242 | 70.1299 | 35.7143 | 50.6667 | 32.2148 | 60.274 | 61.2245 |
| Gobi | * | * | * | * | * | * | * | * | * | 74.8299 | 40.9938 | 57.3427 | 35.2113 | 66.187 | 67.1429 |
| Bavani | * | * | * | * | * | * | * | * | * | * | 57.3333 | 75.7576 | 44.2748 | 70.3125 | 69.7674 |
| Udumalai | * | * | * | * | * | * | * | * | * | * | * | 71.2329 | 80 | 59.1549 | 60.1399 |
| Veppanthattai | * | * | * | * | * | * | * | * | * | * | * | * | 51.9685 | 80.6452 | 80 |
| Perambalur | * | * | * | * | * | * | * | * | * | * | * | * | * | 45.5285 | 45.1613 |
| TNAU-SC-F | * | * | * | * | * | * | * | * | * | * | * | * | * | * | 99.1736 |
| TNAU–NA-F | * | * | * | * | * | * | * | * | * | * | * | * | * | * | * |
TNAU – SC- F: TNAU – Seed Centre – Farm, TNAU – NAF: TNAU-New Area- Farm
Table (8):
Beta-diversity- similarity and distance matrices of mycoflora between locations
Step |
Similarity% |
Location Joined 1 |
Location Joined 2 |
|---|---|---|---|
1 |
99.1736 |
TNAU-SC-F |
TNAU-NA-F |
2 |
82.4242 |
Ottanchathiram |
Gobi |
3 |
82.1192 |
Kunnor |
Salem |
4 |
80.6452 |
Veppanthattai |
TNAU-SC-F |
5 |
80.0000 |
Udumalai |
Perambalur |
6 |
76.0417 |
Dharmapuri |
Udumalai |
7 |
75.7576 |
Bhavani |
Veppanthattai |
8 |
75.4386 |
Tuticorin |
Dharmapuri |
9 |
74.8299 |
Ottanchathiram |
Bhavani |
10 |
74.8092 |
Kunnor |
Ottanchathiram |
11 |
74.7368 |
Kunnor |
Athur |
12 |
74.0741 |
Watrap |
Vadipatti |
13 |
71.4286 |
Watrap |
Kunnor |
14 |
71.2329 |
Watrap |
Tuticorin |
Joined 1 is (Location 1) compared with Joined 2 (Location 2) and their similarity and distant indices. This is the summary of the Table 7
Diversity of the genus Aspergillus spp.
Genus Aspergillus composition in different locations
Five Aspergillus spp. were recorded: A. niger, A. fumigatus, A. tamarii, A. flavus, and A. oryzae. Among these, A. niger contributed the most (36%), followed by A. flavus (31%), A. fumigatus (20%), and A. tamarii (12%), whereas A. oryzae contributed the least (1%) (Figure 7). All five Aspergillus species were recorded in Gobi, Bhavani, and Vadipatti. Only two species, namely A. flavus and A. niger, were recorded in Perambalur. The highest number of Aspergillus isolates of 105 was recorded in Dharmapuri, followed by Tuticorin (100), and the lowest number of 35 isolates was recorded in Virudhunagar. Aspergillus oryzae was observed only at four locations, namely Vadipatti, Gobi, Bhavani, and Udumalai (Figure 8).
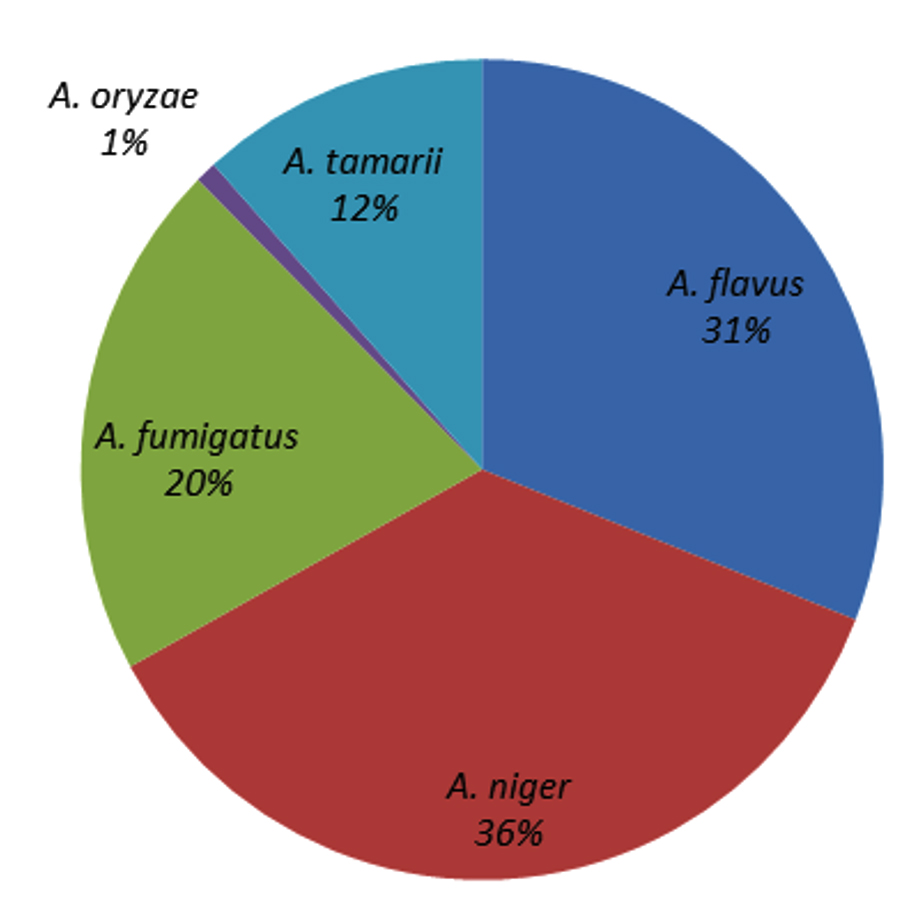
Figure 7. Species composition of genus Aspergillus in maize seeds
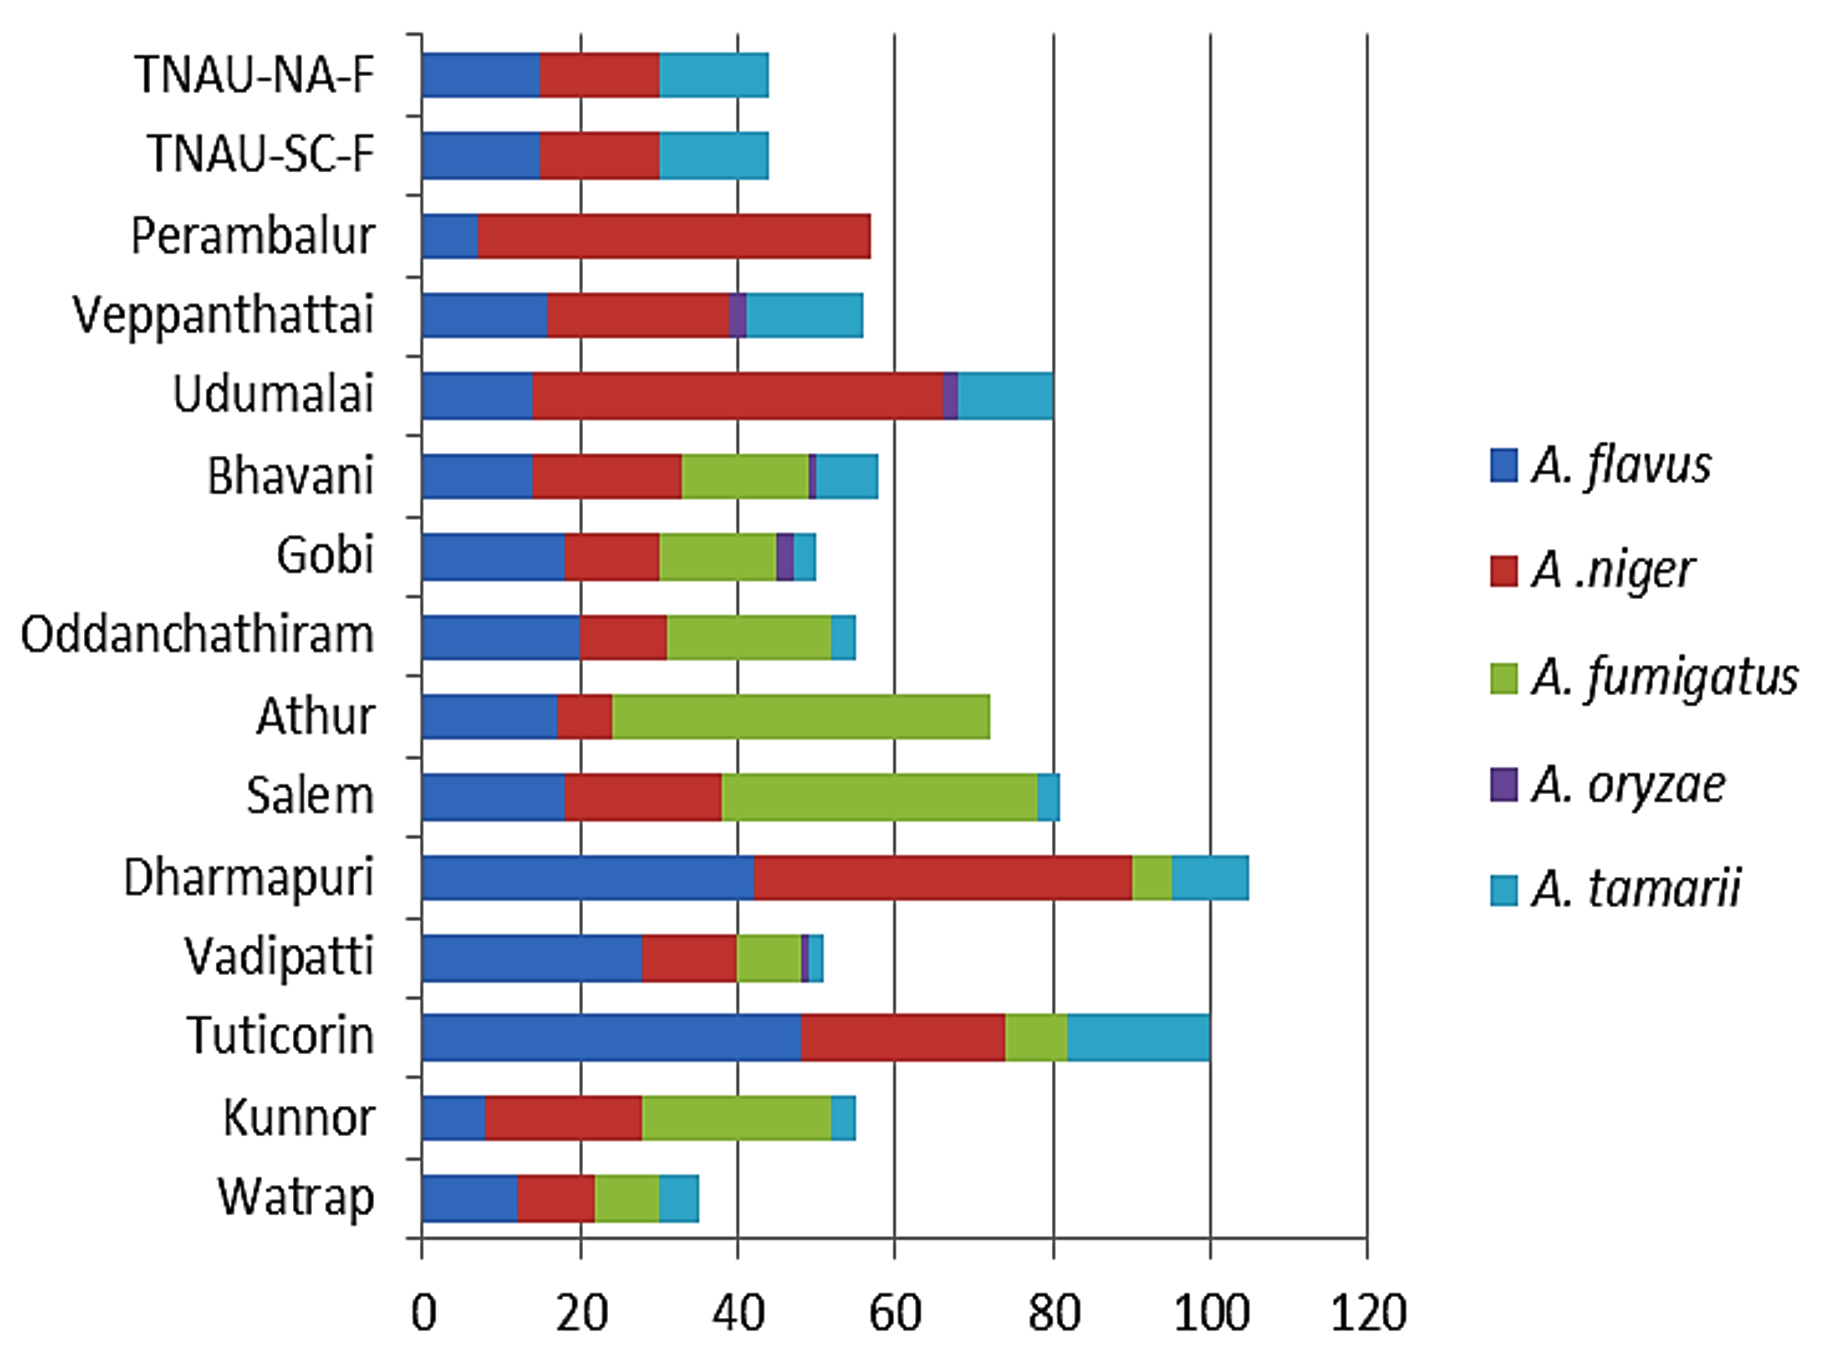
Figure 8. Species composition of genus Aspergillus at different locations
Alpha diversity indices of Aspergillus spp.
Based on Fernando’s ranking, all sites had a Shannon index < 1.9, indicating no significant presence of Aspergillus, owing to the influence of this index on abundance.
The Simpson index 1/D ranged from 0.2155 to 0.739. A maximum of 0.739 was recorded in Bhavani, followed by Watrap (0.728), representing a high dominance of Aspergillus spp. Perambalur had a minimum Simpson index 1/D of 0.2155, meaning no dominance of mycoflora. Chao 1 is an estimate that quantifies abundance and denotes species richness. The highest abundance of five species was recorded in Gobi, Bhavani, and Vadipatti (Table 9).
Table (9):
Alpha diversity analysis of Aspergillus spp. at different locations
Watrap |
Kunnor |
Tuticorin |
Vadipatti |
Dharmapuri |
Salem |
Athur |
Ottanchathiram |
Gobi |
Bhavani |
Udumalai |
Veppanthattai |
Perambalur |
TNAU-SC-F |
TNAU-NA-F |
|
|---|---|---|---|---|---|---|---|---|---|---|---|---|---|---|---|
Taxa_S |
4 |
4 |
4 |
5 |
4 |
4 |
3 |
4 |
5 |
5 |
4 |
4 |
2 |
3 |
3 |
Individuals |
35 |
55 |
100 |
51 |
105 |
81 |
72 |
55 |
50 |
58 |
80 |
56 |
57 |
44 |
44 |
Dominance_D |
0.2718 |
0.3468 |
0.3368 |
0.3833 |
0.3803 |
0.3556 |
0.5096 |
0.321 |
0.2824 |
0.261 |
0.4763 |
0.3233 |
0.7845 |
0.3337 |
0.3337 |
Simpson_1-D |
0.7282 |
0.6532 |
0.6632 |
0.6167 |
0.6197 |
0.6444 |
0.4904 |
0.679 |
0.7176 |
0.739 |
0.5237 |
0.6767 |
0.2155 |
0.6663 |
0.6663 |
Shannon_H |
1.34 |
1.169 |
1.213 |
1.164 |
1.093 |
1.15 |
0.8377 |
1.216 |
1.369 |
1.407 |
0.9618 |
1.195 |
0.3725 |
1.098 |
1.098 |
Evenness_e^H/S |
0.955 |
0.8045 |
0.8411 |
0.6408 |
0.746 |
0.7896 |
0.7704 |
0.8434 |
0.7863 |
0.8169 |
0.6541 |
0.8261 |
0.7257 |
0.9995 |
0.9995 |
Equitability_J |
0.9668 |
0.8431 |
0.8752 |
0.7234 |
0.7886 |
0.8296 |
0.7625 |
0.8772 |
0.8506 |
0.8743 |
0.6938 |
0.8622 |
0.5374 |
0.9995 |
0.9995 |
Fisher_alpha |
1.164 |
0.9917 |
0.8342 |
1.373 |
0.8238 |
0.8831 |
0.6324 |
0.9917 |
1.383 |
1.312 |
0.8861 |
0.986 |
0.4034 |
0.7286 |
0.7286 |
Berger-Parker |
0.3429 |
0.4364 |
0.48 |
0.549 |
0.4571 |
0.4938 |
0.6667 |
0.3818 |
0.36 |
0.3276 |
0.65 |
0.4107 |
0.8772 |
0.3409 |
0.3409 |
Chao-1 |
4 |
4 |
4 |
5 |
4 |
4 |
3 |
4 |
5 |
5 |
4 |
4 |
2 |
3 |
3 |
TNAU – SC- F: TNAU – Seed Centre – Farm, TNAU – NAF: TNAU-New Area- Farm
Taxa S – Number of species recorded = species richness
Individuals – Total number of mycoflora observed
Chao 1 is the expected species richness
The highest evenness of Aspergillus (0.995) was recorded at the TNAU Seed Centre Farm, TNAU New Area Farm, and Watrap. At other locations, it ranged from 0.6408 to 0.8434, meaning that Aspergillus spp. were evenly distributed in all tested locations. Aspergillus oryzae is a rare species, recorded in only 5 out of the 15 locations tested (Vadipatti, Gobi, Bhavani, Udumalai, and Veppanthattai).
Beta diversity analysis of genus Aspergillus between locations using the Bray–Curtis method
A complete similarity of Aspergillus species (100%) was recorded between the TNAU Seed Centre Farm and TNAU New Area Farm, followed by Ottanchathiram and Gobi (89.52%). The similarity of Aspergillus spp. between Veppanthattai and TNAU Farm was 88%, whereas 83% similarity was observed between Ottanchathiram and Bhavani, and Udumalai and Perambalur. A minimum similarity of 21.7% was observed between the Perambalur and Athur (Tables 10 and 11).
Table (10):
Beta-diversity analysis of genus Aspergillus spp. by Bray-Curtis method
Locations |
Watrap |
Kunnor |
Tuticorin |
Vadipatti |
Dharmapuri |
Salem |
Athur |
Ottanchathiram |
Gobi |
Bhavani |
Udumalai |
Veppanthattai |
Perambalur |
TNAU-SC-F |
TNAU-NA-F |
|---|---|---|---|---|---|---|---|---|---|---|---|---|---|---|---|
Watrap |
* |
64.4444 |
51.8519 |
74.4186 |
45.7143 |
56.8966 |
50.4673 |
73.3333 |
77.6471 |
75.2688 |
46.9565 |
59.3407 |
36.9565 |
68.3544 |
68.3544 |
Kunnor |
* |
* |
50.3226 |
56.6038 |
45 |
80.8824 |
61.4173 |
78.1818 |
72.381 |
81.4159 |
45.9259 |
55.8559 |
48.2143 |
52.5253 |
52.5253 |
Tuticorin |
* |
* |
* |
66.2252 |
80.9756 |
54.1436 |
37.2093 |
54.1936 |
54.6667 |
62.0253 |
57.7778 |
69.2308 |
42.0382 |
61.1111 |
61.1111 |
Vadipatti |
* |
* |
* |
* |
60.2564 |
60.6061 |
52.0325 |
77.3585 |
81.1881 |
67.8899 |
44.2748 |
57.9439 |
35.1852 |
61.0526 |
61.0526 |
Dharmapuri |
* |
* |
* |
* |
* |
49.4624 |
32.7684 |
48.75 |
49.0323 |
56.4417 |
77.8378 |
60.8696 |
67.9012 |
53.6913 |
53.6913 |
Salem |
* |
* |
* |
* |
* |
* |
83.6601 |
77.9412 |
73.2824 |
74.8201 |
45.9627 |
56.9343 |
39.1304 |
52.8 |
52.8 |
Athur |
* |
* |
* |
* |
* |
* |
* |
70.8661 |
63.9344 |
56.9231 |
27.6316 |
35.9375 |
21.7054 |
37.931 |
37.931 |
Ottanchathiram |
* |
* |
* |
* |
* |
* |
* |
* |
89.5238 |
77.8761 |
41.4815 |
54.0541 |
32.1429 |
58.5859 |
58.5859 |
Gobi |
* |
* |
* |
* |
* |
* |
* |
* |
* |
83.3333 |
47.6923 |
62.2642 |
35.514 |
63.8298 |
63.8298 |
Bhavani |
* |
* |
* |
* |
* |
* |
* |
* |
* |
* |
60.8696 |
73.6842 |
45.2174 |
72.549 |
72.549 |
Udumalai |
* |
* |
* |
* |
* |
* |
* |
* |
* |
* |
* |
75 |
83.2117 |
66.129 |
66.129 |
Veppanthattai |
* |
* |
* |
* |
* |
* |
* |
* |
* |
* |
* |
* |
53.0973 |
88 |
88 |
Perambalur |
* |
* |
* |
* |
* |
* |
* |
* |
* |
* |
* |
* |
* |
43.5644 |
43.5644 |
TNAU-SC-F |
* |
* |
* |
* |
* |
* |
* |
* |
* |
* |
* |
* |
* |
* |
100 |
TNAU-NA-F |
* |
* |
* |
* |
* |
* |
* |
* |
* |
* |
* |
* |
* |
* |
* |
Similarity indices in per cent
TNAU-SC-F: TNAU – Seed Centre – Farm, TNAU–NA-F: TNAU-New Area- Farm
Table (11):
Beta-diversity-similarity and distance matrices of Aspergillus spp. between locations
Step |
Clusters |
Similarity % |
Joined 1 |
Joined 2 |
|---|---|---|---|---|
1 |
14 |
100 |
TNAU-SC-F |
TNAU-NA-F |
2 |
13 |
89.5238 |
Ottanchatram |
Gobi |
3 |
12 |
88.0000 |
Veppanthattai |
TNAU-SC-F |
4 |
11 |
83.6601 |
Salem |
Athur |
5 |
10 |
83.3333 |
Ottanchathiram |
Bhavani |
6 |
9 |
83.2117 |
Udumalai |
Perambalur |
7 |
8 |
81.4159 |
Kunnor |
Ottanchathiram |
8 |
7 |
81.1881 |
Kunnor |
Vadipatti |
9 |
6 |
80.9756 |
Tuticorin |
Dharmapuri |
10 |
5 |
80.8824 |
Kunnor |
Salem |
11 |
4 |
77.8378 |
Tuticorin |
Udumalai |
12 |
3 |
77.6471 |
Watrap |
Kunnor |
13 |
2 |
75.0000 |
Tuticorin |
Veppanthattai |
14 |
1 |
73.6842 |
Watrap |
Tuticorin |
Joined 1 is (Location 1) compared with Joined 2 (Location 2) and their similarity and distant indices. This is the summary of the Table 10
Isolation, morphological, and molecular characterization of Aspergillus spp.
Twenty-four different Aspergillus spp. were isolated from maize seed samples collected from various regions of Tamil Nadu. The fungal isolates were identified based on their cultural and morphological features. Additionally, 18S rDNA gene sequence analysis was conducted using ITS 1 and ITS 4 primers to identify Aspergillus isolates, and a homology search was performed using the NCBI nucleotide database via BLAST. All fungal isolate DNA was amplified with an amplicon range of 550-600 bp (Figure 9). Among them, 17 isolates were identified as A. flavus, four as A. parasiticus, and three as A. oryzae.
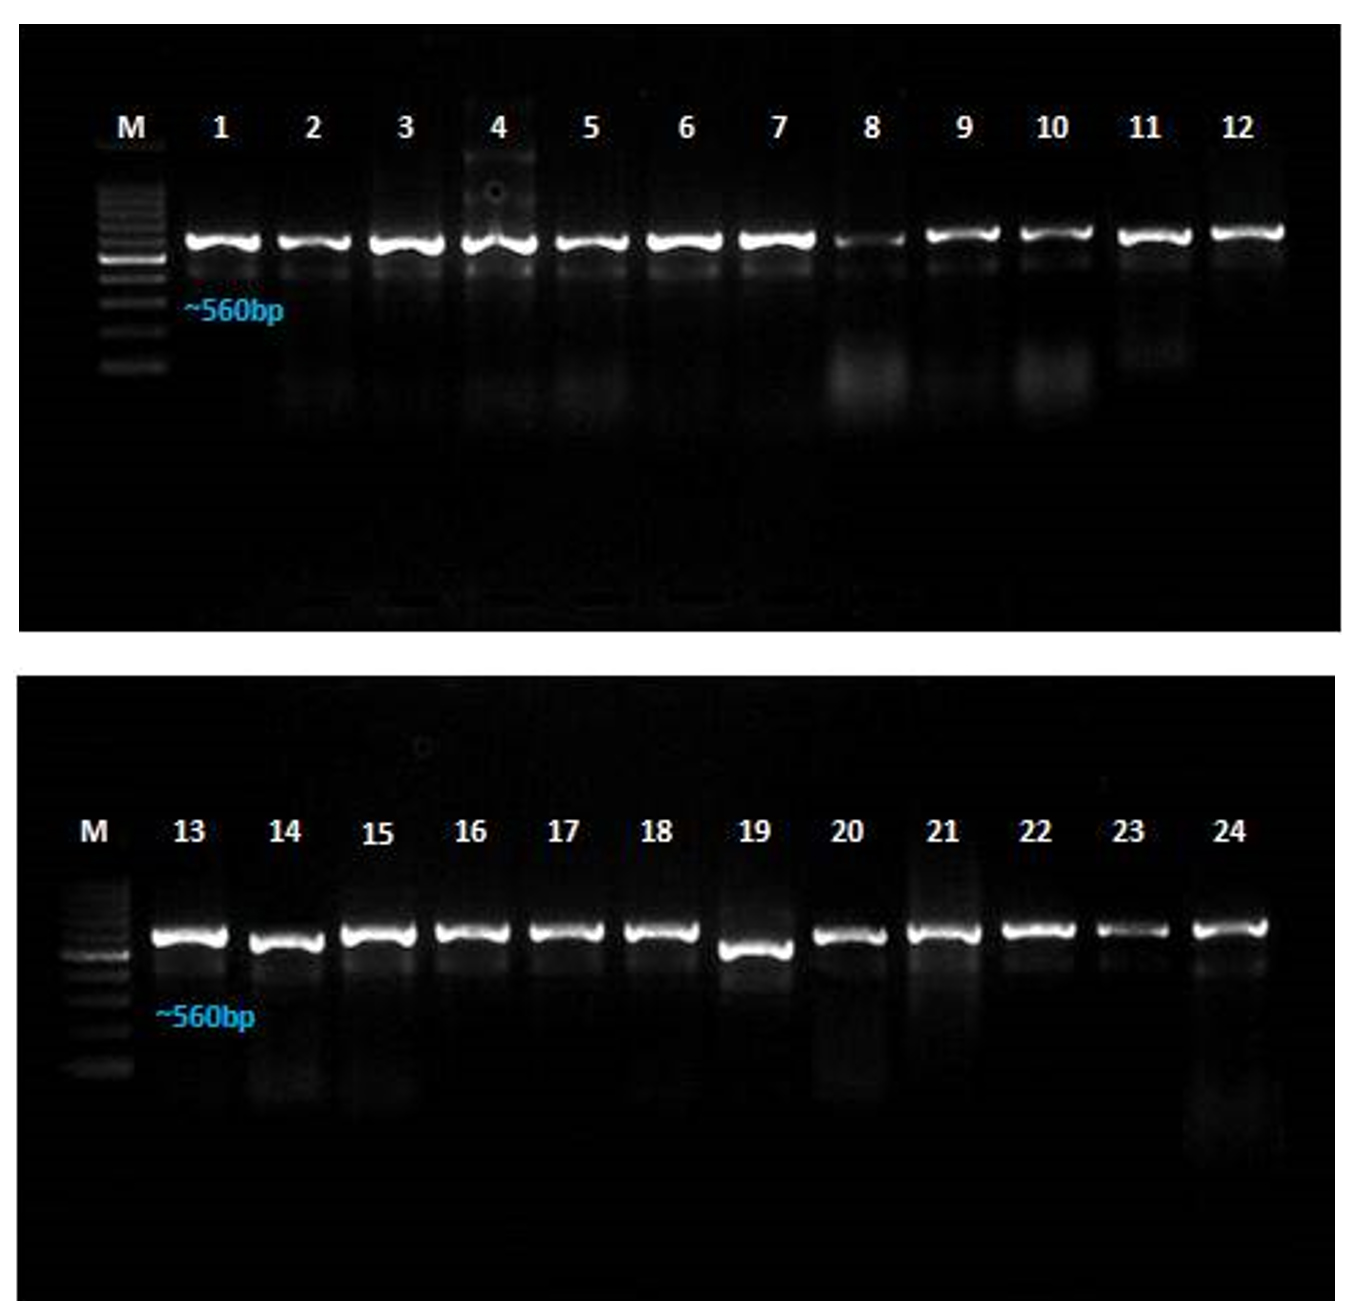
Figure 9. Molecular characterization of Aspergillus spp. isolated from maize
Toxigenic potential of Aspergillus isolates
The toxigenic capacity of Aspergillus isolates was evaluated using HPLC. Among the 24 Aspergillus isolates, Asp 16, Asp 17, Asp 20, and Asp 23 produced all four forms of AFG1, AFB1, AFB2, and AFG2 (Table 12; Figure 10 and 11). Isolates Asp 1, Asp 2, Asp 4, Asp 5, Asp 14, Asp 15, Asp 19, Asp 21, and Asp 24 produced only AFB1 and AFB2. None of the aflatoxin types were detected in isolate Asp 18. The highest amount of AFB1 (10250.78 ppb/g of agar plug) was recorded in isolate Asp 23 followed by Asp 20 (4246.584 ppb/g of agar plug). The AFB1 toxin levels ranged from 0.0 to 10,250.78 ppb, whereas the AFB2 levels ranged from 0.0 to 617.94 ppb. Asp 2, Asp 3, Asp 5, Asp 6, Asp 7, Asp 9, Asp 10, Asp 11, Asp 13, Asp 18, and Asp 22 were identified as nontoxigenic Aspergillus isolates.
Table (12):
The toxigenic potential of different Aspergillus (Asp 23) isolated from maize seeds
| No. | Location | Isolate | Aflatoxin (ppb/g of agar plug) | |||
|---|---|---|---|---|---|---|
| B1 | B2 | G1 | G2 | |||
| 1 | Vadipatti | Asp 1 | 1497.190 | 50.789 | 0 | 0 |
| 2 | Vadipatti | Asp 2 | 4.097 | 0.688 | 0 | 0 |
| 3 | Kunnor | Asp 3 | 13.563 | 0 | 0 | 0 |
| 4 | Kunnor | Asp 4 | 2059.392 | 135.858 | 0 | 0 |
| 5 | Tuticorin | Asp 5 | 1.636 | 0.307 | 0 | 0 |
| 6 | Tuticorin | Asp 6 | 3.432 | 0 | 0 | 0 |
| 7 | Dharmapuri | Asp 7 | 0.094 | 0 | 0 | 0 |
| 8 | Dharmapuri | Asp 8 | 6.189 | 0 | 0 | 0 |
| 9 | Bhavani | Asp 9 | 0.119 | 0 | 0 | 0 |
| 10 | Bhavani | Asp 10 | 0.217 | 0 | 0 | 0 |
| 11 | Veppanthattai | Asp 11 | 0.300 | 0 | 0 | 0 |
| 12 | Gobi | Asp 12 | 14.365 | 0 | 0 | 0 |
| 13 | Gobi | Asp 13 | 0.221 | 0 | 0 | 0 |
| 14 | Ottanchathiram | Asp 14 | 2288.611 | 84.088 | 0 | 0 |
| 15 | Watrap | Asp 15 | 102.041 | 5.824 | 0 | 0 |
| 16 | Watrap | Asp 16 | 1887.62 | 30.37 | 13.52 | 39.49 |
| 17 | Udumalai | Asp 17 | 861.35 | 483.11 | 68.14 | 109.8 |
| 18 | Udumalai | Asp 18 | 0 | 0 | 0 | 0 |
| 19 | Coimbatore | Asp 19 | 2065.08 | 617.94 | 0 | 0 |
| 20 | Coimbatore | Asp 20 | 4246.584 | 33.203 | 6.768 | 35.207 |
| 21 | Athur | Asp 21 | 66.157 | 4.056 | 0 | 0 |
| 22 | Salem | Asp 22 | 0.882 | 0 | 0 | 0 |
| 23 | Salem | Asp 23 | 10250.78 | 88.750 | 22.462 | 91.867 |
| 24 | Perambalur | Asp 24 | 515.404 | 2.661 | 0 | 0 |
Values are mean of three replications
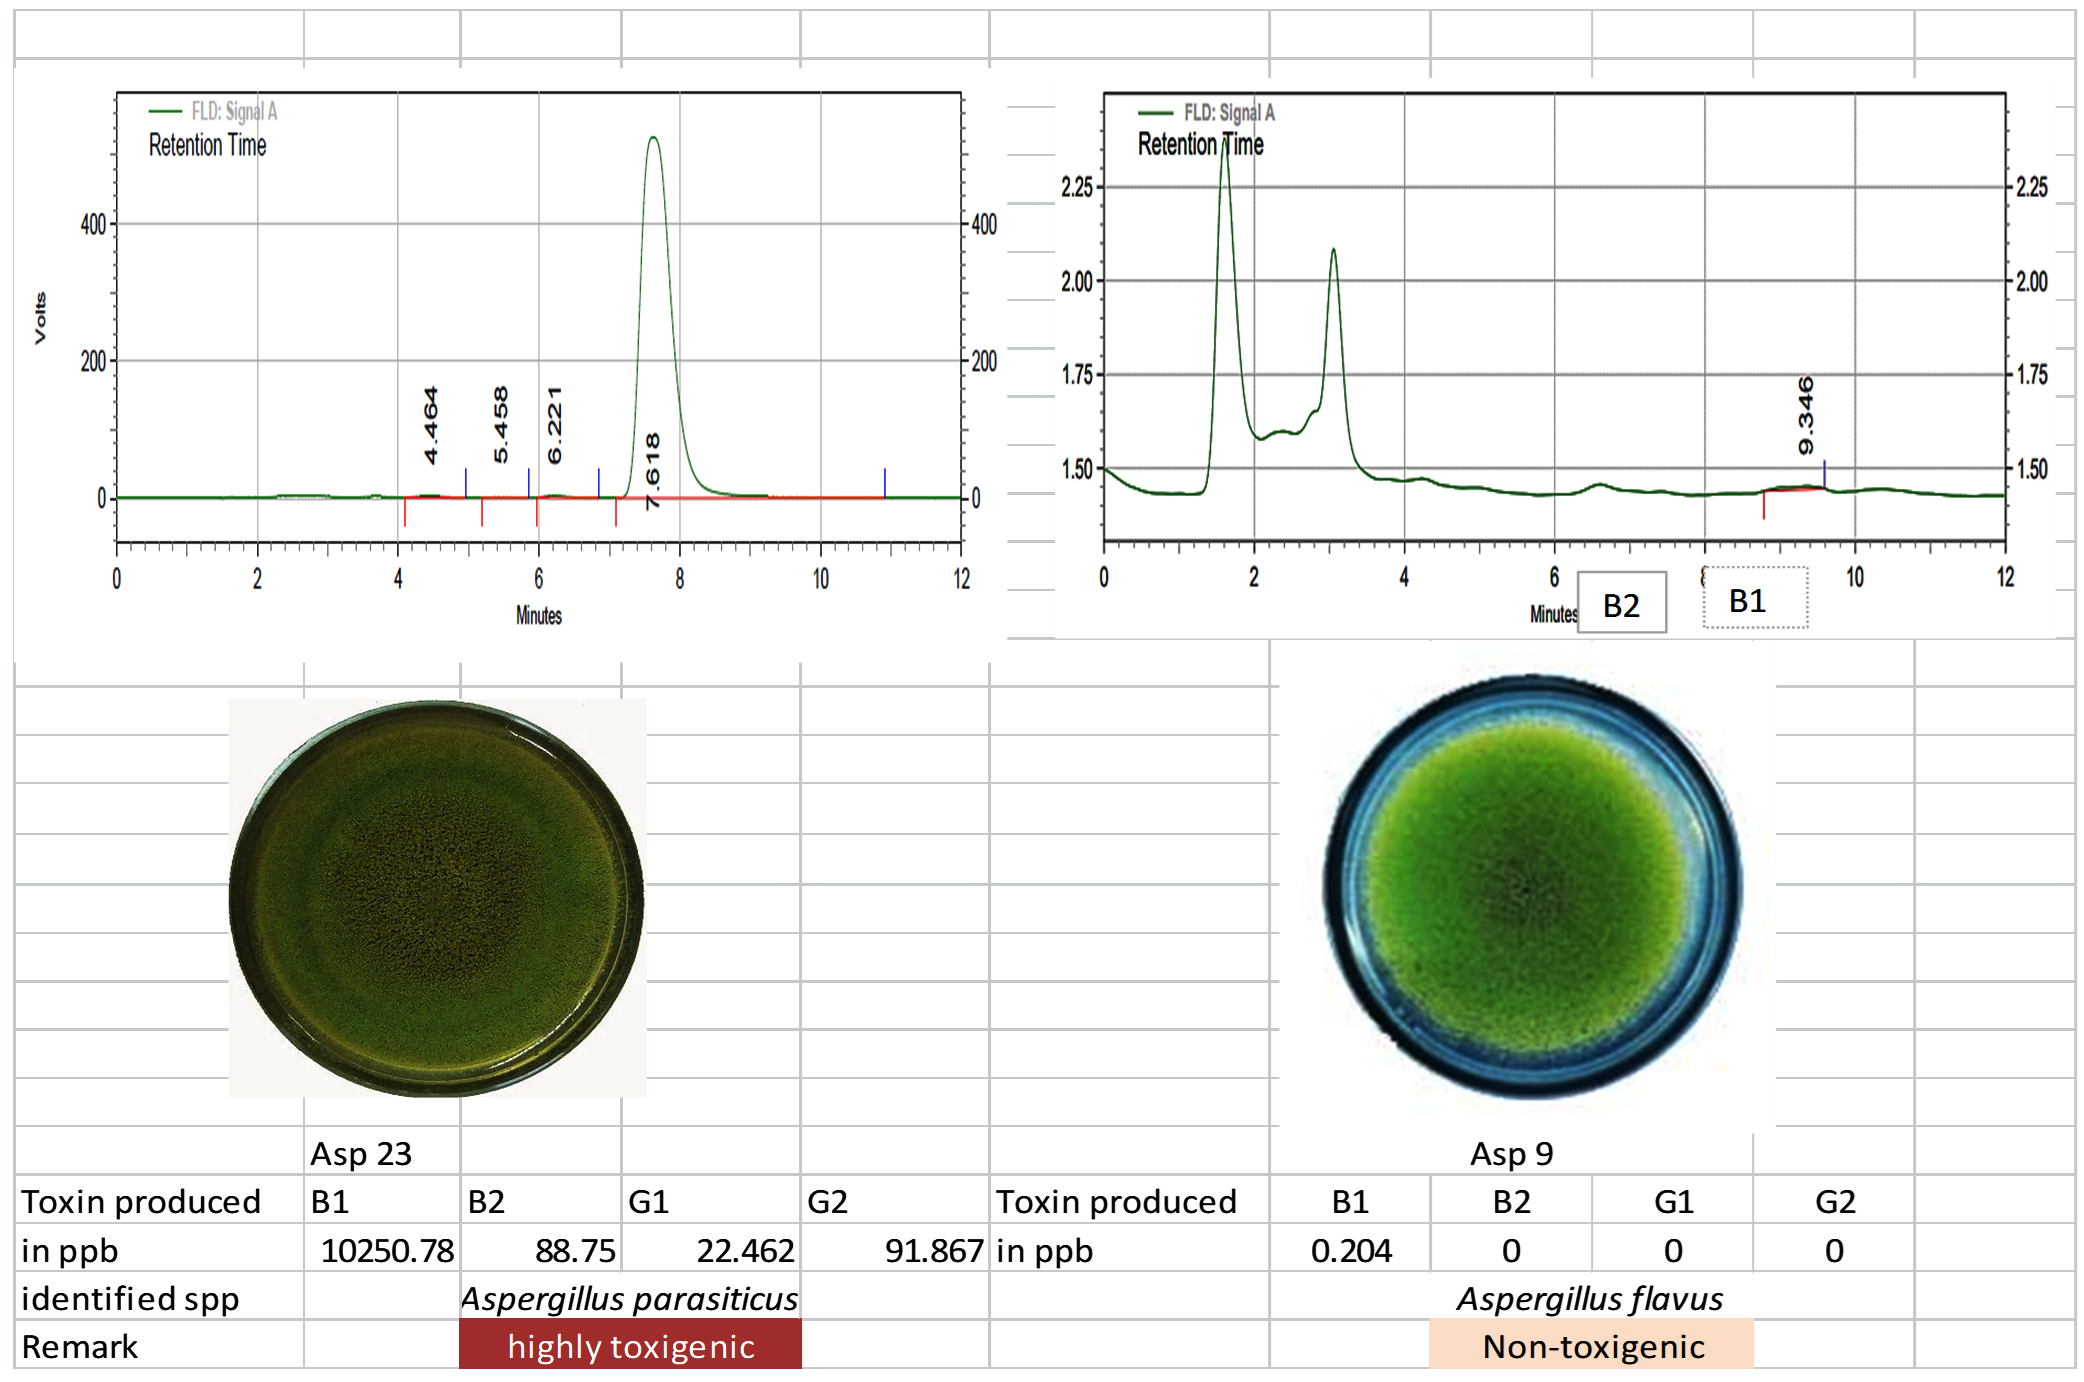
Figure 10. Toxigenic Aspergillus (Asp 23) and non-toxigenic Aspergillus (Asp9) Culture and its HPLC chromatogram
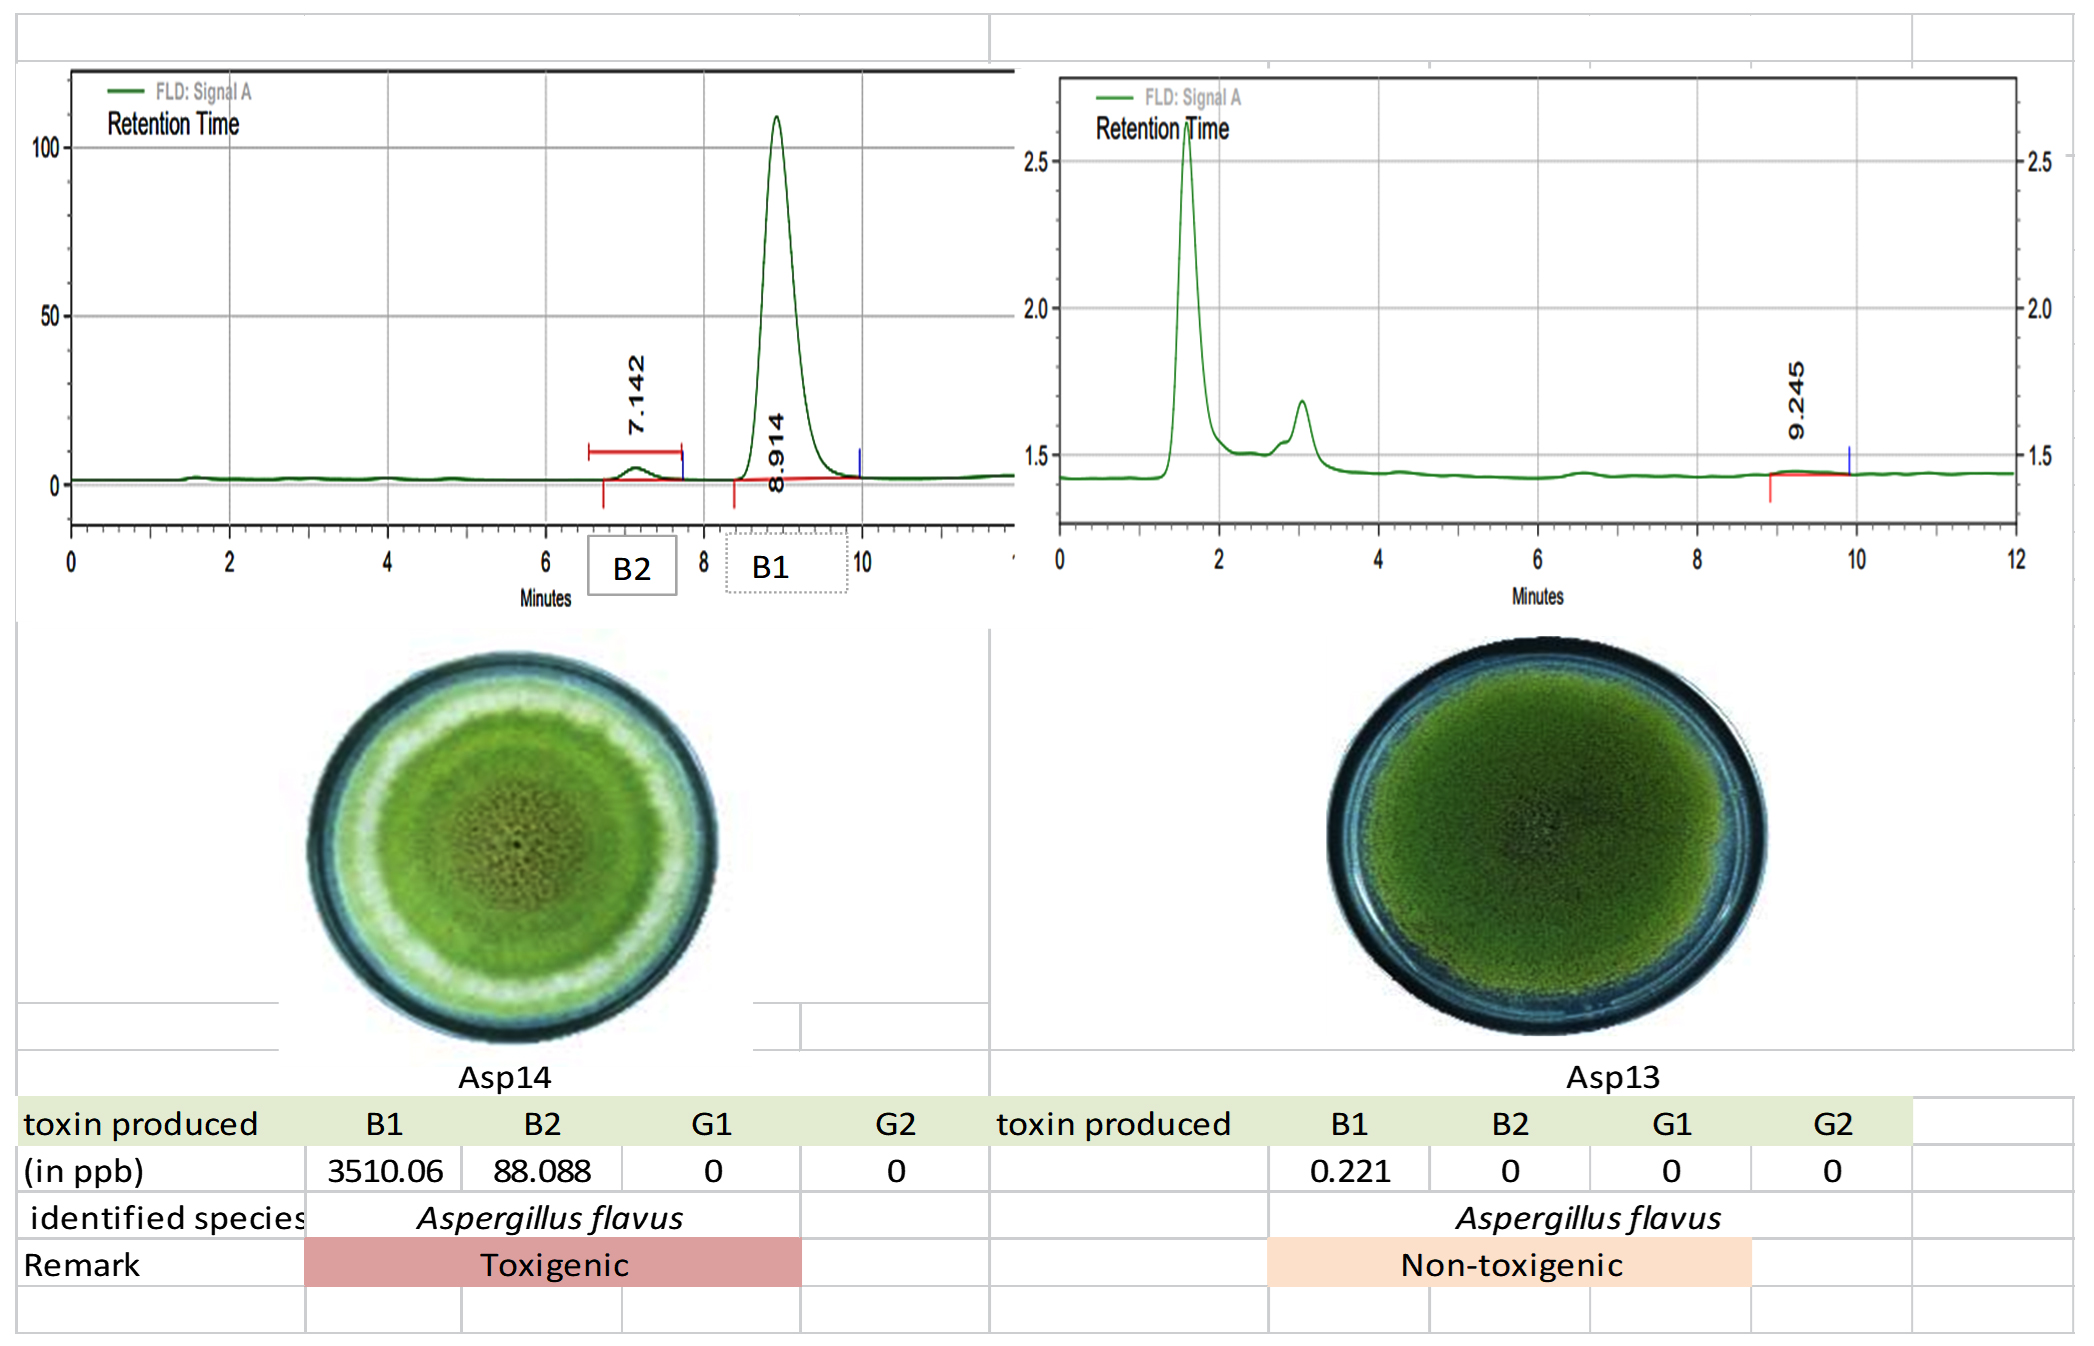
Figure 11. Toxigenic Aspergillus (Asp 14) and non-toxigenic Aspergillus (Asp 13) culture and its HPLC chromatogram
Four clusters were identified based on the heatmap. Asp 23 and Asp 20 formed a separate cluster that produced the highest quantity of AFB1. The third cluster comprised low-toxigenic or non-toxigenic isolates such as Asp 24, Asp 3, Asp 12, Asp 11, Asp 10, Asp 13, Asp 18, Asp 7, Asp 9, Asp 6, Asp 22, Asp 8, Asp 2, Asp 6, Asp 16, and Asp 21. The fourth cluster comprises Asp 19, Asp 14, Asp 4, Asp 16, Asp 1, and Asp 17 which produced all four types of aflatoxins or high levels of AFB1 and AFB2 (Figure 12).
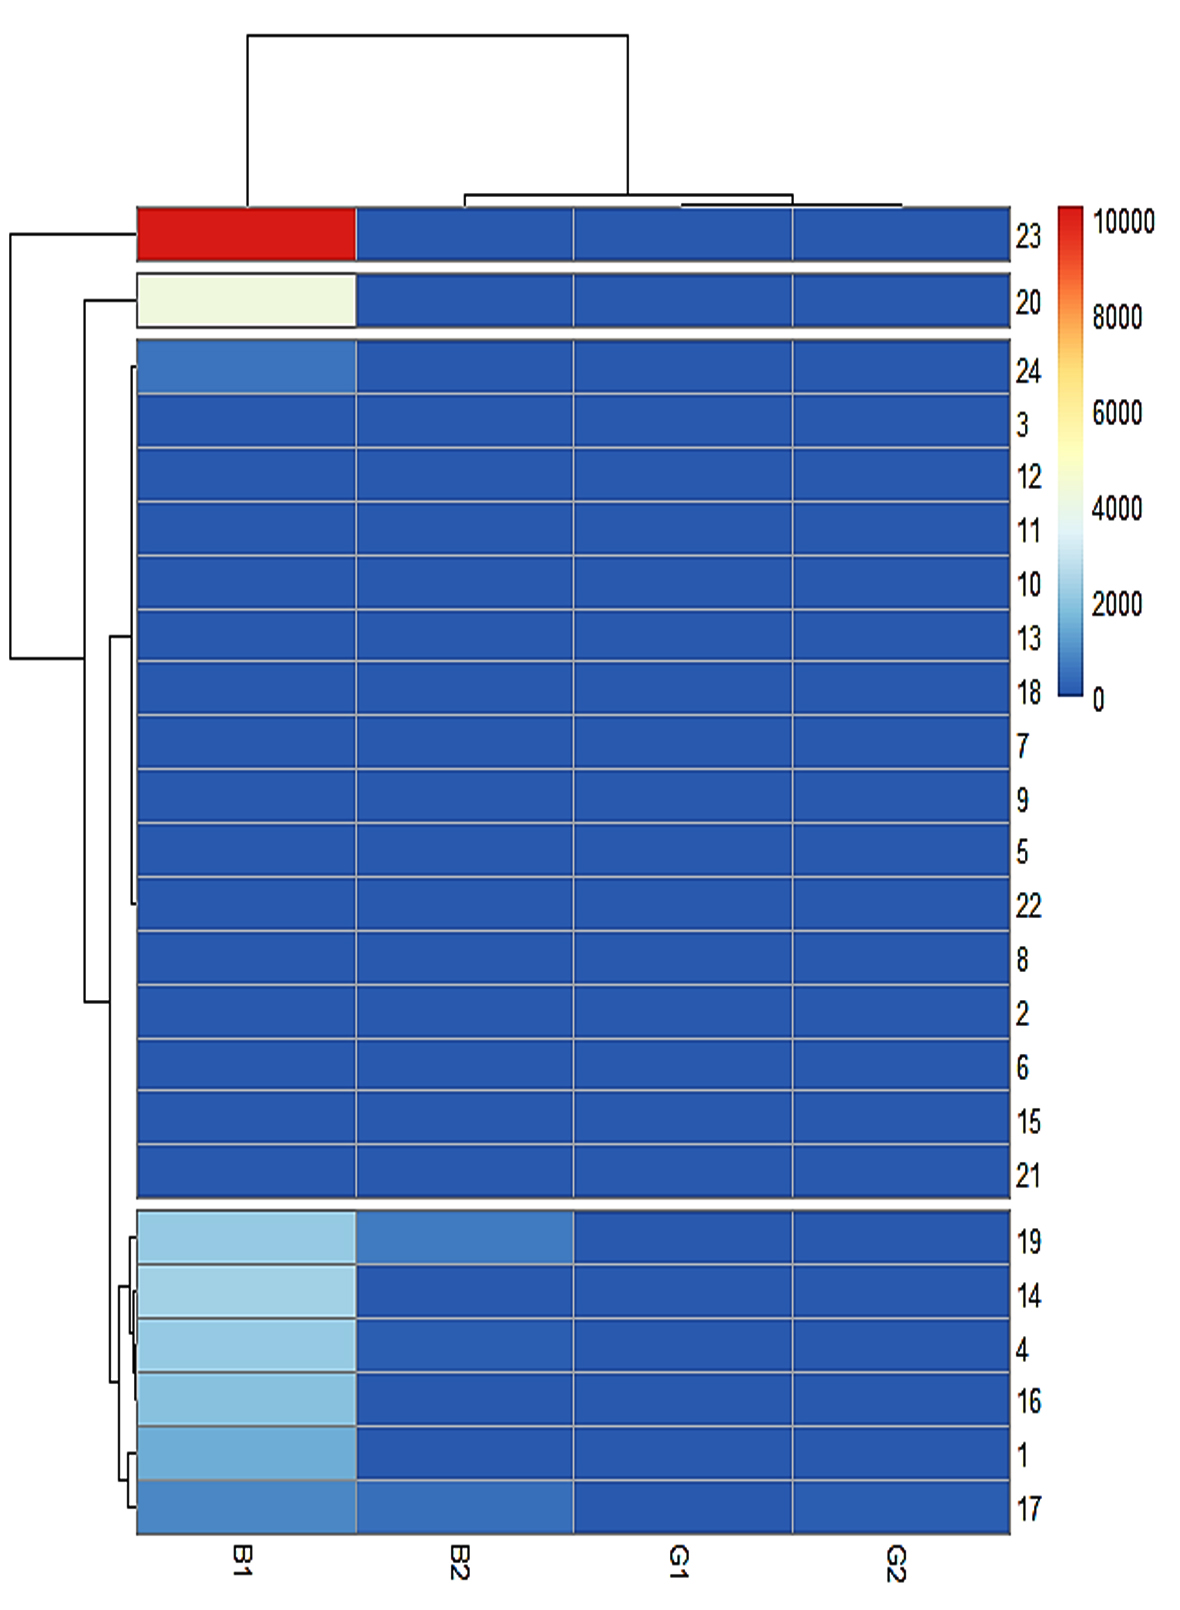
Figure 12. Heat map of aflatoxins (AFB1, AFB2, AFG1, AFG2) produced by Aspergillus isolates and dendrogram (white bar represent division of clusters)
Various biotic and abiotic factors affect maize productivity. Both internally and externally, they support various microbiomes. Mycotoxins, particularly aflatoxins released by Aspergillus spp., pose a serious threat to maize and its products. Aflatoxin in food matrices has been detected and quantified using an array of analytical techniques, including TLC, HPLC with a fluorescent detector, and LCMS.31-33 HPLC technique validation parameters such as sensitivity, linearity, and recovery rate should be within established limits to guarantee accurate measurement of aflatoxin contamination. Based on our experimental results, AFB1 and AFG1 multipoint calibration curves were linear from 1 ppb to 25 ppb, whereas AFB2 and AFG2 multipoint calibration curves had linearity ranging from 0.25 ppb to 6.25 ppb. This confirms that the chromatographic conditions used in this study were appropriate for the quantification of total aflatoxins. The linearity assessment of AFB1 in HPLC revealed a regression value of 0.9987, similarly to Kollia et al.34 The LOD and LOQ under the chromatographic conditions in this experiment were identical to those reported by Lee et al.35: LOD of 0.03 ppb and LOQ of 0.09, 0.04, 0.20 and 0.09 ppb for AFG1, AFB1, AFB2, and AFG2, respectively. According to Khan et al.,36 the LOQ for AFB1 and AFB2 are 0.220 and 0.189 ppb, respectively, whereas the limits of detection were 0.072 and 0.062 ppb, respectively.
By manually spiking different known concentrations of AFB1 and AFB2, the aflatoxin extraction and column clean-up processes used in this study produced a mean recovery rate of 81.81% for AFB1 and 71.92% for AFB2. The AOAC (2002) recommended recovery limits of 70%-125% and 70%-110% for spiking levels of 10 ppb and 10-100 ppb, respectively, and these results fall within those ranges. Using immuno-affinity column clean-up techniques, Ozkan et al.37 was able to achieve 89.3% and 85.95% recovery rates for AFB1 and AFB2, respectively, in non-contaminated red chilli pepper samples. Similarly, Choochuay et al.38 used immuno-affinity column cleaning for the sample and obtained a recovery in the range of 82.50%-109.85% feed using HPLC with pre-column derivatization and fluorescence detection.
Aflatoxin contamination occurs in diverse array of regional crops and food products. Aflatoxins primarily contaminate food and feed such as corn, rice, spices, dried fruits, nuts, and figs.39 The four major aflatoxins, AFB1, AFB2, AFG1, and AFG2, are commonly found in a wide range of food commodities and are synthesized by Aspergillus spp. Among various products, maize has the highest concentration of carcinogens that affect human health. Due to the global prevalence of maize products in traditional diets across the world, a large proportion of the population is highly exposed to aflatoxins.40
The legal restrictions for aflatoxin may vary by nation and intended application, with thresholds as low as 4 parts per billion (ppb), 10 ppb in Tanzania, and 20 ppb in India (USFDA, 2000; European Commission, 2010). Two (6.25%) of the 32 samples of maize products tested for aflatoxin contamination were free of the toxin, whereas the remaining samples had levels below the regulatory thresholds established by India. Ten samples (31.25%) exceeded the regulatory thresholds in Europe (> 4 ppb). Additionally, a contamination range of 0.296-13.595 ppb was observed in 93.75% of samples. Our findings are in line with those of Krishnan et al.,41 who reported that out of 40 corn flour samples collected from Chennai, Tamil Nadu, 23 samples (57.5%) were positive for aflatoxin (50.0% were positive for AFB1, 32.5% for AFB2, 35.5% for AFG1, and 5% for AFG2). Overall, the test findings showed that corn flour had a very high level of AFB1 contamination. Comparable research was conducted in Rwanda by Matsiko et al.,42 and in rural Kenya by Nabwire et al.43 on maize kernels and freshly milled maize flour, respectively. Indian exporters were probably furious after Canadian officials found aflatoxin in corn from India. This information is also likely to cause many countries that purchase grain that is “Grown in India” to become concerned.
Seed-borne fungi are primarily responsible for the declining quality and short shelf life of seeds and grains. This results in a variety of anomalies in the seeds, such as being discolored, harmed, shrunken, undersized, and rotting, which reduces germination. The worst illnesses are those that affect seeds because they damage the initial development of the seed and the plant as a whole. Similar to other crops, maize is plagued by several insect illnesses. It is recognized that the majority of illnesses are seed-borne in nature. The goal of this study was to critically estimate the quality of maize seeds used by Tamil Nadu farmers to determine their health. The mycoflora populations of individual seeds were recorded. Mycoflora diversity in individual seeds varied from 0 (no diversity) to high.
A total of 1152 mycoflora isolates from 10 distinct species were detected in our study, of which five were from the Aspergillus genus and accounted for 82% of the total mycoflora population. Aspergillus spp. were the dominant mycoflora, followed by Fusarium spp. (9%). Penicillium spp. (5%), Rhizopus spp. (2%), Alternaria spp. (1%), and Macrophomina (1%) were among the other identified mycoflora genera. This finding is comparable to that of El-Shanshoury et al.,44 who isolated and identified eight fungal taxa belonging to the Aspergillus, Fusarium, Penicillium, Alternaria, Mucor, Rhizopus, Trichoderma, and Cladosporium species. According to Ghiasian et al.,45 Fusarium species exceed other fungal genera, with a dominance rate of 38.5%, followed by Aspergillus (8.7%), Rhizopus (4.8%), Penicillium (4.5%), and Mucor species (1.1%), and four other fungal genera. Tsedaley and Adugna46 collected 110 fungi from three different types of maize, with Aspergillus, Fusarium, and Penicillium being the most prevalent. Kumar et al.19 reported fungal species belonging to the genera Aspergillus, Alternaria, Bipolaris maydis, Botryosphaeria, Cephalosporium, Cladosporium, Diplodia, Fusarium, Nigrospora, Macrophomina, Mucor, Penicillium, Rhizoctonia, and Trichoderma in maize seeds. Li and Liu47 reported that the ten most prevalent fungal genera in the strawberry rhizosphere were Aspergillus (6.98%), Acremonium (4.10%), Fusarium (4.27%), Chaetomium (3.07%), and Gibberella (2.39%). We found that 82% of the mycoflora was composed of five distinct species of Aspergillus. The most prevalent Aspergillus species were A. flavus and A. niger. According to Gulbis et al.,48 the most prevalent genera in Latvian maize grains are Alternaria, Fusarium, and Penicillium spp.
Alpha diversity assessment was used to evaluate community species diversity according to its richness and/or evenness. The Shannon index considers both the species richness and abundance. In our study, the Shannon index was < 1.9 in all but two of the 15 locations, indicating that there was no mycoflora abundance. Our findings are comparable to those reported by Kumar et al.,19 in which A. niger, A. flavus, and A. tamarii were the most prevalent mycoflora in maize seeds, based on the Shannon-Weiner index of diversity (H), Simpson index of dominance (D), and evenness (E). Gu et al.49 used the alpha diversity indices Chao 1 and Shannon to examine fungal populations in Chinese chives. Based on the findings, Ascomycota, Basidiomycota, and Mortierellomycota accounted for 59.34%-66.78%, 15.1%-29.32%, and 6.79%-11.57% of the total, respectively.
Beta diversity is another term used for sample dissimilarity. This quantifies the differences in the overall species composition between the two locations. In our study, a similarity in species composition was observed between the locations. However, Wang et al.50 studied bacterial and fungal species diversity in drylands, where beta diversity revealed species differences between all locations. The dominance of mycoflora species varies by location and is affected by several environmental factors including species variety, farming methods, and soil conditions. Liu et al.51 estimated diversity and revealed that fungal communities differed across sampling sites. Moreover, there was no variation in the heterogeneity of communities among the study sites. At the phylum level, the conditions were sufficiently comparable such that there was minimal variation in Ascomycota, Basidiomycota, and Mucoromycota dispersal across the sites.
A total of 24 Aspergillus species were isolated based on conidial coloration and purified on PDA medium. Houshyar-Fard et al.52 identified 226 Aspergillus section Flavi isolates in maize seeds. Molecular identification approaches based on internal transcribed regions are useful for identifying the species of fungal isolates. In this study, we used 18S rDNA sequence analysis to identify fungal isolates from maize seeds belonging to Aspergillus section Flavi. Previous research revealed that DNA sequence studies of ribosomal DNA ITS regions are crucial for identifying fungal contamination linked with food commodities.53 Similarly, Zulkifli and Rasit54 used ITS sequence analysis to identify Aspergillus isolated from maize grains. Our findings revealed that the majority of isolates from the Aspergillus section Flavi shared a significant level of sequence similarity with A. flavus and A. parasiticus. These outcomes are in agreement with earlier studies by Adjovi et al.,55 who discovered that 16 of 20 isolates from cassava samples belonged to A. flavus.
We examined the aflatoxigenic capacity of randomly chosen isolates of Aspergillus section Flavi isolated from maize seeds using the agar plug technique and HPLC analysis to assess the probability of the isolates producing aflatoxins. The capacity of the tested strains to produce aflatoxins varied, with concentrations ranging from 0 to 10250.78 ppb/g. Aspergillus isolate Asp 23 was the most toxigenic, producing all four aflatoxins with a maximum production capacity of 10250.78 ppb/g of AFB1. Of the isolates examined, 95.8% generated AFB1, 54.2% produced both AFB1 and AFB2, 16.7% produced all four aflatoxin types (AFB1, AFB2, AFG1, and AFG2), and 42% were nontoxigenic. Similarly, Rizzo et al.56 found that 50% of the studied isolates from dried medicinal and aromatic herbs were toxigenic and generated aflatoxins at concentrations ranging from 10 to 2000 ng/g. Ritter et al.57 isolated 30 Aspergillus isolates, 12 of which tested positive for aflatoxin production. Del Palacio et al.58 used HPLC to identify aflatoxigenic isolates of Aspergillus section Flavi isolated from sorghum silage and discovered that 30% of the tested isolates produced aflatoxins.
Our results align with those of Yan et al.,59 who evaluated the aflatoxigenic potential of randomly selected A. flavus and A. parasiticus strains isolated from herbal tea samples, revealing that A. flavus sourced from ginseng generated the highest aflatoxin levels (498 µg/kg). Similarly, our results are similar to those of Nikolic et al.,60 where 50% of the tested isolates either failed to generate AFB2, AFG2, AFB1, and AFG1, or did so at very low concentrations.
The current study clearly demonstrated that most maize samples obtained from various places in Tamil Nadu were contaminated with different types of aflatoxins; nonetheless, the toxin levels remained below the Indian regulatory limits. In addition, the information gathered from this study is crucial for seed-certifying organizations to avoid losses after harvest. Because certain fungal genera, such as Aspergillus, Fusarium, Penicillium, produce mycotoxins, colonization by these genera makes them inappropriate for human consumption. This affects the health and economy of the population. The study revealed that the most common mycoflora found in the samples were Fusarium, Aspergillus, and Penicillium, all of which are known to generate mycotoxins. In addition, the toxigenic potential of Aspergillus isolates varied from one location or product to another, which may be due to improper handling and storage conditions. To reduce contamination, similar studies should be performed across diverse storage structures because the majority of contamination arises from inadequate storage and handling practices.
ACKNOWLEDGMENTS
None.
CONFLICT OF INTEREST
The authors declare that there is no conflict of interest.
AUTHORS’ CONTRIBUTION
All authors listed have made a substantial, direct and intellectual contribution to the work, and approved it for publication.
FUNDING
None.
DATA AVAILABILITY
All datasets generated or analyzed during this study are included in the manuscript.
ETHICS STATEMENT
Not applicable.
- Zheng MZ, Richard JL, Binder J. A review of rapid methods for the analysis of mycotoxins. Mycopathologia. 2006;161(5):261-273.
Crossref - Peles F, Sipos P, Gyori Z, et al. Adverse effects, transformation and channeling of aflatoxins into food raw materials in livestock. Front Microbiol. 2019;10:2861.
Crossref - Raduly Z, Szabo L, Madar A, Pocsi I, Csernoch L. Toxicological and medical aspects of Aspergillus-derived mycotoxins entering the feed and food chain. Front Microbiol. 2020;10:2908.
Crossref - Cheng, X, Vella A, Stasiewicz MJ. Classification of aflatoxin contaminated single corn kernels by ultraviolet to near infrared spectroscopy. Food Control. 2019;98:253-261.
Crossref - Iamanaka BT, de Souza LA, Martins LM, et al. Aspergillus section Flavi diversity and the role of A. novoparasiticus in aflatoxin contamination in the sugarcane production chain. Int J Food Microbiol. 2019;293:17-23.
Crossref - Rushing BR, Selim MI. Aflatoxin B1: A review on metabolism, toxicity, occurrence in food, occupational exposure, and detoxification methods. Food Chem Toxicol. 2019;124:81-100.
Crossref - Kumar P, Mahato DK, Kamle M, Mohanta TK, Kang SG. Aflatoxins: A global concern for food safety, human health and their management. Front Microbiol. 2017;7:2170.
Crossref - Tabari M, Karim G, Ghavami M, Chamani M. Method validation for aflatoxin M1 determination in yoghurt using immuno-affinity column clean-up prior to high performance liquid chromatography. Toxicol Ind Health. 2011;27(7):629-635.
Crossref - Andrade PD, da Silva JLG, Caldas ED. Simultaneous analysis of aflatoxins B1, B2, G1, G2, M1 and ochratoxin A in breast milk by high-performance liquid chromatography/fluorescence after liquid-liquid extraction with low temperature purification (LLE-LTP). J Chromatogr A. 2013;1304:61-68.
Crossref - Ezekiel CN, Abia WA, Ogara IM, Sulyok M, Warth B, Krska R. Fate of mycotoxins in two popular traditional cereal-based beverages (kunu-zaki and pito) from rural Nigeria. LWT-Food Sci Technol. 2015;60(1):137-141.
Crossref - Shekhar M, Singh N, Kumar S, Kiran R. Role of mould occurrence in aflatoxin buildup and variability of Aspergillus flavus isolates from maize grains across India. Qual Assur Saf Crops Foods. 2017;9 (2):171-178.
Crossref - Singh LB, Ingle RW, Potdukhe SR, et al. Investigation on effect of mycoflora of paddy seed on weight of seed, germination of seed and vigour index of seedling. Biol Forum. 2021;13(2):332-357.
- Martín I, Gálvez L, Guasch L, Palmero D. Fungal Pathogens and Seed Storage in the Dry State. Plants. 2022;11(22):3167.
Crossref - Silvertown J. Plant coexistence and the niche. Trends Ecol Evol. 2004;19(11):605-611.
Crossref - Day NJ, Dunfield KE, Johnstone JF, et al. Wildfire severity reduces richness and alters composition of soil fungal communities in boreal forests of Western Canada. Glob Change Biol. 2019;25(7):2310-2324.
Crossref - Legendre P. Interpreting the replacement and richness difference components of beta diversity. Glob Ecol Biogeo. 2014;23(11):1324-1334.
Crossref - Mahoney N, Molyneux RJ. Rapid analytical method for the determination of aflatoxins in plant-derived dietary supplement and cosmetic oils. J Agric Food Chem. 2010;58(7):4065-4070.
Crossref - De Tempe J. The blotter method for seed health testing. Proc International Seed Testing Association. 1963;28(1):133-51.
Crossref - Kumar S, Sinha A, Singh S. Ecological biodiversity measurement of seed mycoflora contamination of freshly harvested in maize growing zone-II. J Pure Appl Microbiol. 2017;11(1):479-486.
Crossref - Tadych M, Bergen MS, Johnson-Cicalese J, Polashock JJ, Vorsa N, White JF. Endophytic and pathogenic fungi of developing cranberry ovaries from flower to mature fruit: Diversity and succession. Fungal Divers. 2012;54(1):101-116.
Crossref - Pielou EC. The measurement of diversity in different types of biological collections. J Theor Biol. 1966;13:131-144.
Crossref - Simpson EH. Measurement of diversity. Nature. 1949;163:688.
Crossref - Shannon CE. A mathematical theory of communication. Bell Syst Tech J. 1948;27(3):379-423.
Crossref - Fontana V, Guariento E, Hilpold A, et al. Species richness and beta diversity patterns of multiple taxa along an elevational gradient in pastured grasslands in the European Alps. Sci Rep. 2020;10(1):1-11.
Crossref - Pitt JI, Hocking AD. Methods for isolation, enumeration and identification. In Fungi and Food Spoilage. Springer. 1997:21-57.
Crossref - King Jr AD, Hocking AD, Pitt JI. Dichloran-Rose Bengal Medium for enumeration and isolation of molds from foods. Appl Environ Microbiol. 1979;37(5):959-964.
Crossref - Okoth, S, Nyongesa B, Ayugi V, Kang’ethe E, Korhonen H, Joutsjoki V. Toxigenic potential of Aspergillus species occurring on maize kernels from two agro-ecological zones in Kenya. Toxins. 2012;4(11):991-1007.
Crossref - Doyle J. DNA Protocols for Plants. In Hewitt GM, Johnston AWB, Young JPW (eds.), Molecular Techniques in Taxonomy. NATO ASI Series, vol 57. Springer, Berlin, Heidelberg. 1991:283-293.
Crossref - Allen, GC, Flores-Vergara MA, Krasynanski S, Kumar S, Thompson WF. A modified protocol for rapid DNA isolation from plant tissues using cetyltrimethyl ammonium bromide. Nat Protoc. 2006;1(5):2320-2325.
Crossref - White TJ, Bruns T, Lee S, Taylor J. Amplification and direct sequencing of fungal ribosomal RNA genes for phylogenetics. PCR protocols. 1990;18(1):315-322.
Crossref - Var I, Kabak B, Gok F. Survey of aflatoxin B1 in helva, a traditional Turkish food, by TLC. Food Control. 2007;18(1):59-62.
Crossref - Dragacci S, Grosso F, Gilbert J. Immuno-affinity column cleanup with liquid chromatography for determination of aflatoxin M1 in liquid milk: Collaborative study. J AOAC Int. 2001;84(2):437-443.
Crossref - Khayoon WS, Saad B, Lee TP, Salleh B. High performance liquid chromatographic determination of aflatoxins in chilli, peanut and rice using silica based monolithic column. Food Chem. 2012;133(2):489-496.
Crossref - Kollia E, Tsourouflis K, Markaki P. Aflatoxin B1 in sesame seeds and sesame products from the Greek market. Food Addit Contam Part B Surveill. 2016;9(3):217-222.
Crossref - Lee S, Chon H, Lee J, et al. Rapid and sensitive phenotypic marker detection on breast cancer cells using surface-enhanced Raman scattering (SERS) imaging. Biosens Bioelectron. 2014;51:238-243.
Crossref - Khan R, Ghazali FM, Mahyudin NA, Samsudin NIP. Chromatographic analysis of aflatoxigenic Aspergillus flavus isolated from Malaysian sweet corn. Separations. 2021;8(7):98.
Crossref - Ozkan A, Bindak R, Erkmen O. Aflatoxin B1 and aflatoxins in ground red chilli pepper after drying. Food Addit Contam Part B Surveill. 2015;8(3):227-233.
Crossref - Choochuay S, Phakam J, Jala P, Maneeboon T, Tansakul N. Determination of aflatoxin B1 in feedstuffs without clean-up step by high-performance liquid chromatography. Int J Anal Chem. 2018;2018(1):650764.
Crossref - Martinez-Miranda MM, Rosero-Moreano M, Taborda-Ocampo G. Occurrence, dietary exposure, and risk assessment of aflatoxins in the arepa, bread, and rice. Food Control. 2019;98:359-366.
Crossref - Zuki-Orozco BA, Batres-Esquivel LE, Ortiz-Perez MD, Juarez-Flores BI, Diaz-Barriga F. Aflatoxins contamination in maize products from rural communities in San Luis Potosi, Mexico. Ann Glob Health. 2018;84(2):300.
Crossref - Krishnan KV, Sureshkumar K, Jayaraman P. Analysis of food grain spoilage fungi and aflatoxins in raw and parboiled rice samples collected from Chennai, Tamil Nadu. Global Journal of Bioscience and Biotechnology. 2018;7(4):559-569
- Matsiko F, Kanyange C, Ingabire G, Dusingizimana T, Vasanthakaalam H, Kimonyo A. Detection and quantification of aflatoxin in cassava and maize flour sold in Kigali open markets, Rwanda. Int Food Res J. 2017;24(1):459-464.
- Nabwire WR, Ombaka J, Dick CP, et al. Aflatoxin in household maize for human consumption in Kenya, East Africa. Food Addit Contam Part B Surveill. 2020;13(1):45-51.
Crossref - El-Shanshoury AE-RR. Occurrence of moulds, toxicogenic capability of Aspergillus flavus and levels of aflatoxins in maize, wheat, rice and peanut from markets in central delta provinces, Egypt. Int J Curr Microbiol Appl Sci. 2014;3:852-865.
- Ghiasian SA, Kord-Bacheh P, Rezayat SM, Maghsood AH, Taherkhani H. Mycoflora of Iranian maize harvested in the main production areas in 2000. Mycopathologia. 2004;158 (1):113-121.
Crossref - Tsedaley B, Adugna G. Detection of fungi infecting maize (Zea mays L.) seeds in different storages around Jimma, South Western Ethiopia. Int J Plant Pathol Microbiol. 2016;7(3):1-6.
Crossref - Li WH, Liu QZ. Changes in fungal community and diversity in strawberry rhizosphere soil after 12 years in the greenhouse. J Integr Agric. 2019;18(3):677-687.
Crossref - Gulbis K, Bankina B, Bimsteina G, Neusa-Luca I, Roga A, Fridmanis D. Fungal diversity of maize (Zea mays L.) grains. Rural Sustainability Research. 2016;35(330):2-6.
Crossref - Gu, Y, Wang Y, Wang P, et al. Study on the diversity of fungal and bacterial communities in continuous cropping fields of Chinese chives (Allium tuberosum). Biomed Res Int. 2020;2020(1):3589758.
Crossref - Wang J, Zhang T, Li L, Li J, Feng Y, Lu Q. The patterns and drivers of bacterial and fungal b-diversity in a typical dry land ecosystem of North West China. Front Microbiol. 2017;8:2126.
Crossref - Liu L, Yan Y, Ding H, et al. The fungal community outperforms the bacterial community in predicting plant health status. Appl Microbiol Biotechnol. 2021;105(16):6499-6513.
Crossref - Houshyar-Fard M, Rouhani H, Falahati-Rastegar M, Mahdikhani-Moghaddam E, Malekzadeh-Shafaroudi S, Probst C. Studies on Aspergillus flavus Link. isolated from maize in Iran. J Plant Prot Res. 2014;54(3):218-224.
Crossref - Okoth S, De Boevre M, Vidal A, et al. Genetic and toxigenic variability within Aspergillus flavus population isolated from maize in two diverse environments in Kenya. Front Microbiol. 2018;9:57.
Crossref - Zulkifli NN, Rasit N. Lipase production from solid state fermentation of copra waste associated fungus Aspergillus niger. UMT J Undergrad Res. 2020;2(2):33-40.
Crossref - Adjovi Y, Bailly S, Gnonlonfin BJG, et al. Analysis of the contrast between natural occurrence of toxigenic Aspergilli of the Flavi section and aflatoxin B1 in cassava. Food Microbiol. 2014;38:151-159.
Crossref - Rizzo I, Vedoya G, Maurutto S, Haidukowski M, Varsavsky E. Assessment of toxigenic fungi on Argentinean medicinal herbs. Microbiol Res. 2004;159(2):113-120.
Crossref - Ritter AC, Hoeltz M, Noll IB. Toxigenic potential of Aspergillus flavus tested in different culture conditions. Food Sci Technol. 2011;31(3):623-628.
Crossref - Del Palacio A, Pan D. Occurrence and toxigenic potential of Aspergillus section Flavi on wheat and sorghum silages in Uruguay. Mycology. 2020;11(2):147-157.
Crossref - Yan H, Zhang L, Ye Z, et al. Determination and comprehensive risk assessment of dietary exposure to ochratoxin A on fermented teas. J Agric Food Chem. 2021;69(40):12021-12029.
Crossref - Nikolic M, Savic I, Nikolic A, et al. Toxigenic species Aspergillus parasiticus originating from maize kernels grown in Serbia. Toxins. 2021;13(12):847.
Crossref
© The Author(s) 2025. Open Access. This article is distributed under the terms of the Creative Commons Attribution 4.0 International License which permits unrestricted use, sharing, distribution, and reproduction in any medium, provided you give appropriate credit to the original author(s) and the source, provide a link to the Creative Commons license, and indicate if changes were made.