

ISSN: 0973-7510
E-ISSN: 2581-690X
A yellow pigment producing potent strain Streptomyces parvulus C5-5Y (KJ624998) isolated from leather industry was used in this study. The pigmented metabolite exhibited good spectrum of antagonistic activity against common human clinical pathogens. Hence, this work has been focused to analyze the bioactive compound present in the crude pigment. To achieve this, an initial step has been taken to purify the bioactive compound. The TLC and HPTLC analysis was carried out to analyze the number of compounds present in the crude pigment extract. Through silica gel column chromatography, the bioactive fraction was separated and named as F5. This fraction was efficient in combating the pathogens even at minor concentrations as supported by the MIC assay. The UV-Vis spectral analysis revealed the presence of phenoxazinone chromophores in their structures by their absorption maxima at 443nm. The mass of the compound was found to be 1256m/z and the results from LC-MS/MS data unveiled the possibility of the compound F5 to fall under actinomycin group of antibiotics. A further assessment has to be taken to confirm it through NMR analysis and to analyze the compound to be employed as therapeutics through in vitro and in vivo studies.
Streptomyces, pigment, antagonism, MIC, LC-MS/MS.
There is always a need in the pharmaceutical industry for efficient drugs to combat new emerging pathogenic strains. Microbial metabolites are promising; hence, researchers mainly focus on exploiting the microorganisms in search of new potent compounds. The Streptomyces species under the domain bacteria are ubiquitous in soil microbial communities and are mainly distinguished by their ability to produce an array of secondary metabolites1, 2. The biosynthesis of these substances is influenced by physiological and environmental signals3 and is mainly produced during idiophase. The secondary metabolites from Streptomycetes show several biological activities and can be broadly classified into four classes: (a) Antagonist agents, including antibacterials, antifungals, antiprotozoans as well as antivirals (b) Pharmacological agents, including antitumorals, immunomodulators, neurological agents and enzyme inhibitors (c) Agrobiologicals including insecticides, pesticides and herbicides and (d) Compounds with regulatory activities such as growth factors, siderophores or morphogenic agents. These metabolites may be of colored or non colored compounds which gains economic importance. One such colored compound is actinomycin which are bicyclic chromopeptide lactone antineoplastic antibiotics produced by various Streptomycetes. Many natural actinomycins are reported till date, which differs in their aminoacid substitution but commonly having phenoxazinone chromophore in their structure (Ivana). This piece of work has been carried out to characterize the yellow pigment compound produced by the strain C5-5Y and to evaluate its effectiveness against common human clinical pathogens.
Organisms used
The potent yellow pigmented antagonistic strain Streptomyces parvulus C5-5Y (KJ624998) was isolated from the soil samples collected from leather industrial areas of Vellore, Tamil Nadu. This strain was isolated using Starch Casein Nitrate (SCN) agar media. Common human clinical pathogens viz. Staphylococcus aureus, Staphylococcus epidermidis, Enterococcus sp., Escherichia coli, Pseudomonas aeruginosa, Klebsiella pneumoniae, Salmonella typhi, Proteus sp., Shigella sp., Bacillus sp., and Candida albicans used in this study which were procured from the PSG hospitals, Coimbatore.
Production and extraction of pigment from strain C5-5Y
The SCN medium used for production of yellow pigment consists of (g/L): Soluble starch-1, Casein-0.03, Potassium nitrate-0.2, Sodium chloride-0.2, Dipotassium hydrogen phosphate-0.2, Calcium carbonate-0.002, Ferrous sulphate-0.001, Magnesium sulphate-0.002. 1N HCl or NaOH was used to adjust the initial pH of the medium 7 before autoclaving. Erlenmeyer flasks containing 100mL of basal medium was inoculated with 5% v/v of the inoculums and incubated in reciprocating shaker with 180 x g at 27ÚC for 7 days. Later the biomass was harvested by centrifugation at 5000 x g for 10 minutes. The pigments from the biomass and culture filtrate were extracted using various polar and non-polar solvents such as water, methanol, ethanol, acetone, ethyl acetate, acetonitrile, isopropanol, petroleum ether, dichloromethane, n-butyl alcohol, isoamyl alcohol, acetic acid and chloroform in order to select the efficient solvent for extraction. A solvent ratio of 40% v/v was added to the culture filtrate and 40% w/v to the biomass and incubated in water bath at 45°C for 20 min to enhance the rate of extraction4.
Antagonistic activity of crude pigment extract
Antimicrobial activity of the concentrated crude pigment extract was determined by well diffusion assay following Bauer et al.,5 against the above said clinical test pathogens. With the help of a sterile cork borer, wells were punctured onto Mueller – Hinton agar plates previously seeded with one of the test pathogen. Thirty microliter of the pigment extract (from biomass and culture filtrate) and solvent (positive control) were added to the respective wells. The diameter of inhibition zone was measured after 24 h of incubation at 37°C. The inhibition by the positive control was excluded while calculating the results.
Analysis of compounds in the crude pigment
The initial analysis of the crude pigment for the determination of number of compounds and the suitable solvent systems for their separations were done through the TLC and HPTLC systems. The movement of the pigment in specific solvent systems was detected following thin layer chromatography (TLC)6. Different combinations of polar and non-polar solvent systems such as chloroform: methanol, butanol: acetic acid: water and petroleum ether: ethyl acetate was used in different ratio. The best solvent system that can separate maximum number of compounds from the crude extract was taken for further studies. The solvent front was marked and Rf value was calculated. The results of the TLC were further confirmed with the HPTLC analysis. CAMAG Linomat 5 system was used with the plate size of 10.0 x 10.0 cm. The mobile phase used to develop the plate was Chloroform: Methanol (90:10). Presences of bands were detected with CAMAG TLC Scanner 3 “Scanner-17048” at UV 254 nm and 366 nm with the scanning speed was 20 mm/sec.
Purification of compound through Column chromatography
The crude pigment extract was subjected to fractionation by silica gel column chromatography. The sample was made into slurry with activated silica gel 60-120 mesh (activation at 105p C for 6 hours). Elution was performed by the linear gradient of Chloroform and methanol7. The fractions were collected at specific intervals and their purity was also determined using TLC employing the mobile phase of Chloroform: methanol (90:10). The purity of compounds separated was detected by UV illuminator at 254nm and 366nm. All fractions collected were checked for their antimicrobial potency.
MIC assay of F5 compound
The minimum inhibitory concentrations (5) of the F5 compound against the sensitive organisms were determined using the well diffusion method. Serial dilutions of the compound were prepared to obtain 5 -25 µg concentrations. 40 µl of each concentration were dispensed in the wells bored in Muller – Hinton agar plates previously seeded with the test pathogens and were incubated at 37ºC. The plate was observed the next day to determine the sensitivity of each organism against the F5 compound. The least concentration of the purified compound that had inhibitory effect was taken as the minimum inhibitory concentration (MIC) of the compound against respective pathogens.
Characterization of F5 compound
The compound F5 from column chromatography was dissolved in acetone and it was taken for spectroscopic analysis using UV- Vis scanning spectroscopy. Scanning was performed between 200nm-700nm wavelengths8. The mass of the purified compound was found out through LC-MS/MS. The mobile phase used for this analysis was solvent A (acetonitrile 80%), solvent B (HPLC water 20%). The sample of about 20µL was injected and the flow rate was 0.5 mL/min at the wavelength of 444nm using C18 RP column. . ESI (±) MS ionization mode was used.
Production and extraction of pigment from strain C5-5Y
After the growth of cultures in the production medium, it was centrifuged at 5000 x g for 15 minutes at room temperature to separate the biomass and culture filtrate.
The yield of the pigment from the biomass and culture filtrate using different solvents was examined visually. Extraction of pigment was found to be maximum in acetone from biomass whereas chloroform was found to best for culture filtrate. The solvent extract was then concentrated using rotary evaporator.
Antagonistic activity of crude pigment extract
The crude extract exhibited maximum activity towards S. mutans, S. aureus, Shigella sp., K. pneumoniae and Staph. epidermidis with the zone of inhibitions of 2.5cm, 2.4cm, 2.4cm, 2.3cm and 2.3cm respectively (Table. 1.). Suppression of the pathogen growth was less towards other pathogens tested.
Table (1):
Antimicrobial activity of crude pigment extract.
S. No. |
Pathogens |
Zone of inhibition (cm) |
|---|---|---|
1 |
Salmonella typhi |
1.5 |
2 |
Staphylococcus aureus |
2.4 |
3 |
Streptococcus mutants |
2.5 |
4 |
E. coli |
0.7 |
5 |
Pseudomonas aeruginosa |
1.5 |
6 |
Klebsiella pneumoniae |
2.3 |
7 |
Enterococcus sp. |
0.8 |
8 |
Shigella sp. |
2.4 |
9 |
Proteus vulgaris |
0.7 |
10 |
Staphylococcus epidermidis |
2.3 |
Analysis of compounds in the crude pigment extract
Maximum separation of compounds from the crude pigment extract was found when choloroform: methanol (90:10) was used as mobile phase. About 7 bands were observed out of which the 4th band was bright yellow in colour with an Rf value 0.8 and was found to be bioactive. Further, HPTLC was carried out to find the exact number of compounds present in the crude pigment extract. A total of 15 bands were observed through HPTLC analysis (Fig. 1.). The 10th peak covered the maximum area of 46.10% with the maximum height of 523.7 and an Rf value of 0.91. This fraction was yellow in color and found to be bioactive.
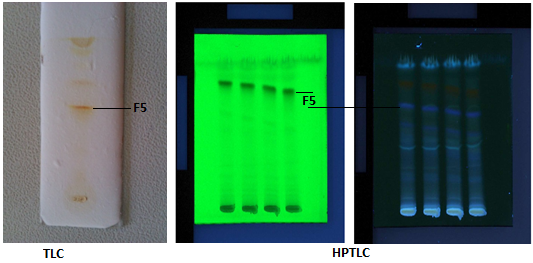 Fig. 1. TLC and HPTLC profile
Silica gel chromatography
The concentrated crude extract was taken to silica gel column chromatography in the ratio of 3:1 and it was eluted with the linear gradient of methanol and chloroform for the compound purification from crude pigment extract. An effective separation of the compounds was carried out by increasing a steady concentration of chloroform and methanol. Fifteen fractions have been obtained from the column, among which three fractions were colored. Fraction V which was yellow in color showed efficient antimicrobial activity against all the pathogens tested than other fractions eluted from the column. This fraction has been named as F5 and was found to be completely soluble in acetone.
MIC assay of F5 compound
The minimum inhibitory concentration of the compound F5 was studied against the common human pathogens stated before to check its efficiency. It was observed that the compound F5 was very efficient even at lower dosage level of 5µg against most of the pathogens tested except a few such as E.coli (15µg), Enterococcus faecalis (10µg) and Proteus vulgaris (20µg) (Table 2).
Table (2):
MIC assay for the compound.
| S. No. | Pathogens | Fraction F5 | ||||
|---|---|---|---|---|---|---|
| 5 µg | 10 µg | 15 µg | 20 µg | 25 µg | ||
| 1 | Salmonella typhi | 0.88±0.03 | 1.13±0.06 | 1.23±0.06 | 1.5±0.06 | 1.7±0.1 |
| 2 | Staphylococcus aureus | 1.4±0.06 | 1.58±0.03 | 1.87±0.06 | 2.2±0.06 | 2.43±0.12 |
| 3 | Streptococcus mutans | 1.5±0.03 | 1.67±0.06 | 1.8 | 1.3±0.7 | 2.3±0.1 |
| 4 | E. coli | – | – | 0.7±0.1 | 0.7±0.06 | 0.9±0.06 |
| 5 | Pseudomonas sp. | 0.83±0.06 | 0.9±0.06 | 1.13±0.06 | 1.25±0.05 | 1.4±0.1 |
| 6 | Klebsiella pneumoniae | 1.12±0.03 | 1.3±0.06 | 1.79±0.01 | 2.1±0.1 | 2.43±0.06 |
| 7 | Enterococcus faecalis | – | 0.7±0.15 | 0.7 | 0.9±0.06 | 1.1±0.1 |
| 8 | Shigella sp. | 1.3±0.06 | 1.53±0.01 | 1.83±0.06 | 2.13±0.06 | 2.38±0.07 |
| 9 | Proteus vulgaris | – | – | – | 0.73±0.06 | 0.8±0.1 |
| 10 | Staphylococcus epidermidis | 1.13±0.06 | 1.4±0.06 | 1.67±0.06 | 2.1±0.1 | 2.23±0.15 |
Characterization of F5 fraction
The fraction F5 was scanned through UV-Vis spectrum of 200-700nm. From the absorption spectrum of the fraction F5 it was found that the active compound had absorption at 443nm (Fig. 2.). From the results of LC-MS/MS the mass of the compound in fraction F5 was found to be 1256m/z. This molecular mass was similar to the mass of D-actinomycin (1255.4 m/z), a potent antibiotic reported to be produced by S. parvulus. The chromatogram in Fig 3.1 & 3.2 showed all the possibilities of the fragmentation by the compound F5 when subjected to LC-MS/MS analysis.
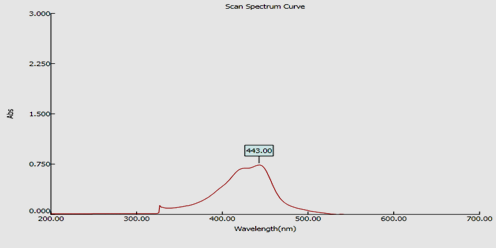 Fig. 2. UV spectrum of F5 compound
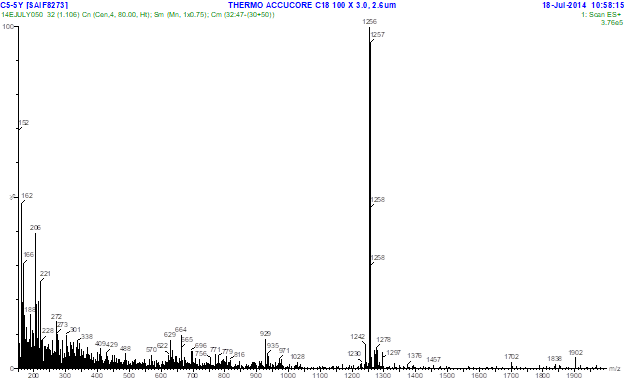 Fig. 3.1. LC- MS profile of F5 compound showing molecular mass 1256 m/z
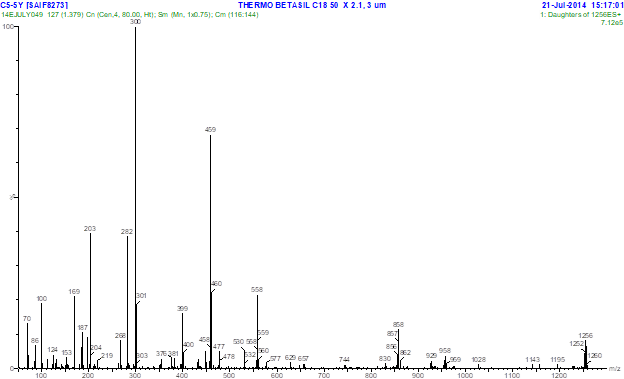 Fig 3.2. MS/ MS profile of F5 compound with mass 1256 m/z
In an attempt to meet the need of potent bioactive compound producing strains, soil sample from stressed environment (Industrial area) was collected. Among the isolated strains, the isolate Streptomyces parvulus C5-5Y (KJ624998) producing yellow pigment showed good activity against the clinical pathogens used. For assessment of bioactive compound of the pigment, crude pigment was extracted from biomass and culture filtrate using solvents acetone and chloroform respectively. Extracted crude pigment was analyzed for its antimicrobial property against 10 clinical pathogens and was found to be active against all the test pathogens. The crude extract was further purified through silica gel chromatography. Fraction F5 exhibited good antimicrobial activity. Screening of this F5 fraction with UV-Vis spectrophotometer showed maximum absorption at the range of 443 nm which was similar to the study by Gunther et al (9). In their study they have reported their compound having absorption maxima at 444 belongs to the phenoxazinone ring containing groups. A study by Ivana et al (10) revealed actinomycins C1,C2 and C3 had absorption maxima between 439 and 441 nm that was in par with the authentic Actinomycin D (441nm) suggesting the presence of phenoxazinone chromophores in their structures. Since fraction F5 also had absorption maxima at 443 nm, it indicates this compound might also possess a phenoxazinone ring in its structure.
Further analysis of the fraction with LC-MS/MS, molecular mass of the compound was found to be 1256m/z which were similar to the molecular mass of D-actinomycin. Actinomycins are bicyclic chromopeptide lactone antibiotics produced by various Streptomycetes. In their structures, two pentapeptide lactone rings are attached in amide linkages to a phenoxazinone dicarboxylic acid. Biosynthetically, actinomycin and its chromophore are formed by the oxidative condensation of two 3-hydroxy-4-methylanthranilic acid (4-methyl-3-hydroxyanthranilic acid, 4-MHA) pentapeptide lactones possessing aminoacids such as Methyl valine, Sarcosine, Proline, D-Valine and Threonine (11). 4-MHA is the starter building block of the nonribosomal assembly of the 4-MHA pentapeptide lactones. MS/MS profile of F5 showed few important peaks at the mass ranges of 169, 187, 268, 282, 300, 381, 399, 459, 530, 558, 559, 657, 858, 959 and 1143m/z which may be due to the fragmentation and elimination of some peptone lactone moieties of actinomycin D.
A comparable observation was reported by Ivana et al (10) who analysed the fragementation patterns of actinomycin D, demethylact D and Didemethlyact D through PSD-MALDI-TOF mass spectrometry. Presence of peaks at the mass range of 169, 187, 268, 282, 300, 381, 399 indicating the presence of peptide moieties, whereas the loss in some parts of the peptide lacone moieties indicated by the observation of peaks at 459, 530, 558 & 559, 657, 858, 959 and 1143 observed and reported that these peaks indicated the presence of PMeG(169), MeGMeV(187), VPMeG(268), PMeGMeV(282), H-PMeGMeV-OH(300), VPMeGMeV(381), H-VPMeGMeV-OH(399) and also the loss in some parts of the peptide lacone moieties such as H-VPMeGMeV-OH from both rings(459), VPMeGMeV+H2O from both rings(530), H-PMeGMeV-OH from one ring(558 & 559), H-PMeGMeV-OH from both ring(657), H-VPMeGMeV-OH(858), H-PMeGMeV-OH (959) and MeVal(1143) in their structure. Based on this report we suggest the observed peaks in our mass spectrum might be due to presence of these groups in the structure of F5. Further this compound has to be studied with NMR to confirm this compound as Actinomycin group of antibiotic.
Concluding the work, we have extracted the yellow pigment from Streptomyces parvulus C5-5Y with the help of acetone, this pigment possessed good antimicrobial potential against all the clinical pathogens used. Hence, the purification of the yellow compound F5 by column chromatography was done and the analysis of this through UV and LC-MS/MS revealed that this compound may belong to the group of actinomycin. Since the results obtained from this present work are promising and hence merit further studies as employing as therapeutics in cancer as well as antibiotics through their in vivo assessment using animal models.
ACKNOWLEDGMENTS
The author strongly acknowledges UGC-MRP (F.No.39-257/2010 (SR) dated: 28.12.2010) for their financial support and SAIF Lucknow for the analytical help.
- Williams, S.T., Goodfellow, M., Alderson, G., Wellington, E.M.H., Sneath, P.H.A., Sackin, M. Numerical classification of Streptomyces and related genera. J. Gen. Microbiol., 1983; 129: 1743-1813.
- Bibb, M.J. Regulation of secondary metabolism in Streptomycetes. Curr. Opin. Microbiol., 2005; 8: 208-215.
- El Nakeeb, M.A., Lechevalier, H.A. Selective isolation of aerobic actinomycetes. Appl. Microbiol. Biotechnol., 1963; 11: 75-77.
- Vijayabharathi, R., Bruntha Devi, P., Sathyabama, S., Bruheim, P., Brindha Priyadarisini, V. Optimization of resistomycin production purified from Streptomyces aurantiacus AAA5 using response surface methodology. J. Biochem. Tech., 2012; 3: 402-408.
- Bauer, A.W., Kirby, W.M.M.M., Sherris, J.C, Turch, M. Antibiotic susceptibility testing by a standardized single disc method. Am. J. Clin. Pathol., 1966; 45: 493-496.
- Odakura, Y., Kase, H., Itoh, S., Satoh, S., Takasawa, S. Biosynthesis of asatromicin 421 and related antibiotics. Biosynthetic studies with blocked mutants of 422 Micromonospora olivasterospora. J. Antibiot., 1984; 12: 670–680.
- Sanghvia, G.V., Ghevariyab, D., Gosaib, S., Langab, R., Dhadukc, N., Kunjadiac, P.D., Vaishnava, D.J., Daveb, G.S.. Isolation and partial purification of erythromycin from alkaliphilic Streptomyces werraensis isolated from Rajkot, India. Biotechnol. Reports., 2014; 1–2: 2–7.
- Ilic, S.B., Kontantinovic, S.S., Todorovic, Z.B. UV/VIS analysis and antimicrobial activity of Streptomyces isolates. Facta Universitatis Series. Med. Biol., 2005; 12: 44-46.
- Gunther, S.K., Christian, H., Wuppertal, E. Germany, assignors, by mesue assignments, to Farhenfabriken Bayer Alrtiengesellschaft, (A corporation of Germany Ser. No. 645, 7622 Claims. 1965. (Cl. 195—80) 1957).
- Ivana, C., Joachim, V., Ullrich, K. Occurrence and biosynthesis of C-demethylactinomycins in actinomycin-producing Streptomyces chrysomallus and Streptomyces parvulus. J. Antibiot. 2013; 1-8.
- Meienhofer, J., Atherton, E. Structure-activity relationships in the actinomycins. Adv.Appl. Microbiol. 1973; 16: 203–300.
© The Author(s) 2017. Open Access. This article is distributed under the terms of the Creative Commons Attribution 4.0 International License which permits unrestricted use, sharing, distribution, and reproduction in any medium, provided you give appropriate credit to the original author(s) and the source, provide a link to the Creative Commons license, and indicate if changes were made.