

ISSN: 0973-7510
E-ISSN: 2581-690X
Microbial migration between the ear, throat, and nasal cavities can aggravate certain otorhinolaryngological conditions. For instance, Staphylococcus aureus colonization in the middle ear increases otitis media occurrence, while nasal colonization can exacerbate allergic rhinitis (AR) symptoms. S. aureus produces superantigens (SAgs) that include T-cell SAgs (e.g. staphylococcal enterotoxins SEA, SEB, SEC, and SED), which cross-link class II major histocompatibility complex (MHC) molecules on antigen-presenting cells with T-cell receptors, causing widespread T-cell activation and cytokine release. It also produces B-cell superantigens, such as Protein A (SpA), which bind to immunoglobulins and activate B-cells, contributing to allergic airway diseases. The detection of these SAg genes and methicillin-resistant Staphylococcus aureus (MRSA) marker genes (mecA and femB) in both allergic and healthy individuals may enable the assessment of microbial transmission risk between the ear and nose. In this study, we quantified five SAg genes (SEA, SEB, SEC, SED, and SpA) and the MRSA markers mecA and femB using quantitative PCR (qPCR) in swab samples from 11 healthy individuals and one AR patient. The results demonstrated that these genes were not always co-present or correlated between an individual’s ear and nose samples. In several cases, MRSA marker genes were detected by qPCR despite the absence of S. aureus growth on selective culture, indicating potential detection of other carriers of these genes. These findings underscore the importance of quantifying SAg and MRSA gene levels in the ear and nose to establish baseline colonization and to assess potential risk factors for related otorhinolaryngological conditions.
Enterotoxins, MRSA, Staphylococcus aureus, Superantigens
Staphylococcus aureus is a common component of the microflora of human and animal skin and mucous membranes.1 Approximately 25% of healthy people carry S. aureus in their anterior nasal cavity or on other mucous membranes or damaged skin.2,3 Local and invasive infections can occur when S. aureus breaches these barriers and invades soft tissue, leading to conditions such as sepsis (with a mortality rate of 20%-40%), pneumonia, or bacteremia.1 S. aureus produces a variety of virulence factors, including adhesion proteins, immunomodulators, anti-phagocytic factors, and superantigens (SAgs).1,4 These factors can induce toxin-mediated diseases such as food poisoning, staphylococcal scalded skin syndrome, and toxic shock syndrome (TSS).5 Although traditionally considered an extracellular pathogen, S. aureus is also capable of surviving intracellularly by invading non-immune cells, thereby causing persistent infections and pathogenic effects.6
Superantigens are unconventional antigens that hyperactivate lymphocytes.6 T-cell SAgs bind simultaneously to the MHC class II molecules on antigen-presenting cells and to the variable β-chain region of T-cell receptors (TCR Vβ), triggering an abnormal, widespread activation of T cells and excessive release of pro-inflammatory cytokines.1,4,6 In severe cases, this uncontrolled immune activation can lead to a cytokine storm and TSS.5 By contrast, B-cell (antibody) SAgs, such as S. aureus Protein A (SpA), bind to the Fab or Fc regions of immunoglobulins and the B-cell receptor outside the conventional antigen-binding site, activating B lymphocytes in a non-specific manner.6
Staphylococcal superantigens fall into two main groups. The major group comprises more than 20 staphylococcal enterotoxins (SEs) and enterotoxin-like proteins (SEls). SEs are a family of Secreted, heat-stable proteins with common structural properties; the primary isoforms include staphylococcal enterotoxins A, B, C, and D (SEA, SEB, SEC, and SED).7 The genes encoding these SEs are carried on various mobile genetic elements such as bacteriophages, plasmids, and pathogenicity islands (SaPIs).8 The minor group of staphylococcal SAgs includes toxic shock syndrome toxin-1 (TSST-1).3
S. aureus SAgs are frequently implicated in chronic inflammatory airway diseases. In patients with perennial allergic rhinitis (AR), S. aureus colonization of the nasal mucosa is common and can exacerbate the AR, which is an inflammatory disease of the nasal mucosa associated with otitis media, chronic sinusitis, and nasal polyposis.9 Another S. aureus superantigen, Protein A (SpA), is widely used in biotechnology to purify antibodies10 but has also been found to contribute to allergic respiratory diseases.11-13 SpA is one of the most abundantly expressed S. aureus virulence factors during invasive infection and is associated with marked suppression of the immune response to staphylococcal antigens. Specifically, it can suppress opsonophagocytosis14 and inhibit complement activation.15
Methicillin-resistant S. aureus (MRSA) is defined by the presence of the mecA gene, which encodes a low-affinity penicillin-binding protein (PBP2′) that confers resistance to β-lactam antibiotics.16 The mecA gene has been detected not only in S. aureus but also in some coagulase-negative staphylococci (CNS).17 Another genetic marker important for identifying S. aureus is the femB auxiliary gene, located outside the mec operon, which encodes a ~50 kDa protein involved in cell wall peptidoglycan synthesis and contributing to methicillin resistance.18,19 Although femB is generally a reliable marker for S. aureus identification, some isolates may fail to amplify femB due to genetic variability or primer mismatch.18 Simultaneous detection of femB and mecA, rather than mecA alone, is therefore recommended for confident identification of MRSA, since mecA can occasionally be present in other staphylococcal species (CNS) that are not S. aureus.20
Given the critical roles of S. aureus SAgs (SEA, SEB, SEC, SED, and the B-cell SAg SpA) in the pathogenesis of ear, nose, and throat diseases and in antibody interactions,21-26 it is important to characterise the presence of their genes in the mucosal surfaces of the ear and nasal cavities alongside the presence of MRSA genes. Such characterisation can help us understand how these factors correlate with each other and aid in establishing potential risk factors in disease progression.
Sample collection and processing
This pilot study was approved by the Wenzhou-Kean University Ethics Committee (approval number: WKUIRB2023-039R) with minimal risks since the participants are all healthy individuals. All procedures were performed in accordance with relevant regulations and the Declaration of Helsinki. Informed consent was obtained from all participants. Twelve adult participants (aged 18 years or older) were recruited. One participant had a confirmed clinical diagnosis of allergic rhinitis (AR) and is referred to as Patient 1 in this report; the other 11 participants were healthy controls. None had known conditions that would interfere with normal microflora. Bilateral nasal and ear swabs were collected from each subject using sterile swabs, yielding a total of 24 samples (12 nasal swabs and 12 ear swabs). The swabs were immediately placed in autoclaved tubes containing 10% saline for transport. Within 24 hours, each swab sample was plated onto Baird-Parker (BP) agar (Qingdao Hope Bio, Qingdao, China) supplemented with Potassium Tellurite Egg-Yolk reagent (Qingdao Hope Bio) and incubated at 37 °C for 24 hours. This selective medium was used to screen for the presence of S. aureus, which typically produces black colonies with clear zones on BP agar.
Bacterial strains and bacterial growth
Two reference S. aureus strains from the BeNa Culture Collection (BNCC, Beijing, China) were used as positive controls for PCR analyses: S. aureus subsp. aureus Rosenbach (BNCC 139843), which is positive for SpA, SEA, SEB, SEC, SED, mecA, and femB; and S. aureus (BNCC 358401), which is positive for SpA, SEA, SEB, mecA, and femB. These strains were revived and cultured according to the supplier’s instructions before use.
Design of superantigen gene primers
Primers for the SAg and MRSA target genes were obtained as follows. The SpA (Protein A) gene primer pair was designed using the SpA gene sequence from GenBank (Accession X61307) as a template in the Primer3Plus program. Primers for SEA, SEB, SEC, SED, mecA, and femB were adopted from a published study by Klotz et al. on S. aureus enterotoxin genes A-D.27 All primers were synthesised by Sangon Biotech (Shanghai, China). Supplementary Material Table S1 lists the sequences and properties of the primers for the superantigen and MRSA target genes.
Housekeeping gene selection
To identify a reliable housekeeping gene for normalising qPCR data, we evaluated five candidate reference genes from S. aureus: gyrA, gyrB, era, SecA, and dnaG. Primer sequences for these housekeeping genes were taken from Rocha et al.28 and synthesised by Sangon Biotech. PCR amplification of each candidate reference gene was performed on DNA from the two reference S. aureus strains (BNCC 139843 and 358401) as well as on samples from several study participants. The PCR products were analysed by agarose gel electrophoresis to check for single, specific bands. The gene gyrA consistently produced a clear single band in all tested samples (see Results), whereas the other candidate genes were not amplified as consistently. We therefore selected gyrA as the reference housekeeping gene for all subsequent qPCR analyses. Supplementary Material Table S2 provides the primer sequences and properties for the candidate housekeeping genes tested.
Bacterial culture and OD600 normalisation
For each participant’s ear and nose sample that yielded growth on BP agar, up to three presumptive S. aureus colonies (black colonies) from the agar plate were picked with sterile toothpicks and inoculated into 5 mL of Nutrient Broth (NB) medium. These cultures were grown at 37 °C with shaking at 220 rpm for 12-14 hours. The overnight cultures were then diluted and transferred (200 µL per well) into a 96-well microplate (in triplicate for each sample) to measure optical density at 600 nm (OD600) using a Thermo Scientific microplate reader. The OD600 values of the cultures were averaged and used to normalise the bacterial cell density across all samples: cultures were diluted with fresh NB medium to achieve a uniform OD600 (with a tolerance of ±0.035) prior to DNA extraction or PCR. This normalisation ensured that approximately equal amounts of bacterial cells from each sample were used for DNA analysis.
PCR conditions
DNA templates for PCR were prepared by boiling a loopful of each normalized culture and extracting the supernatant, or by using crude lysates from the colonies. Standard PCR reactions were carried out in a Thermo Scientific™ Arktik Thermal Cycler using 50 µL reaction volumes containing 1 µL of template DNA, 25 µL of 2× HiFi-PCR Master Mix (Sangon Biotech), 2 µL of forward primer (10 µM), 2 µL of reverse primer (10 µM), and 20 µL of sterile deionised water. The thermal cycling profile was as follows: initial denaturation at 95 °C for 3 minutes, followed by 35 cycles of 95 °C for 15 seconds, 53 °C for 15 seconds, and 72 °C for 30 seconds, and a final extension at 72 °C for 5 minutes. PCR products were analysed by electrophoresis on 1% agarose gels. RealBand 1 kb Plus DNA ladder (0.1-10 kb range, Sangon Biotech) was used as a molecular size marker. Gel images were processed with GelApp software29,30 to document the results.
qPCR quantification and melt curve analysis
Quantitative real-time PCR (qPCR) was performed using an Applied Biosystems™ QuantStudio 3 Real-Time PCR System. Each 20 µL qPCR contained 1 µL of template DNA, 10 µL of 2 × S6 Universal SYBR® qPCR Master Mix (EnzyArtisan, Shanghai), 0.4 µL of the forward primer (10 µM), 0.4 µL of the reverse primer (10 µM), and 8.2 µL of sterile nuclease-free water. The qPCR cycling conditions were: initial enzyme activation step at 95 °C for 30 seconds; followed by 40 cycles of 95 °C for 3 seconds, 60 °C for 10 seconds, and 72 °C for 30 seconds. A melt curve analysis was performed immediately after amplification (95 °C for 15 seconds, then 60 °C for 1 minute, and an increase to 95 °C, holding for 1 second) to verify the specificity of each primer pair. All qPCR reactions were performed in triplicates, and no-template controls were included for each primer set to verify the absence of contamination or primer-dimer formation. The amplification specificity was confirmed by the presence of a single peak in each melt curve, and by comparing melt curve profiles between the reference strains and participant samples.
Gene expression calculation
All qPCR data were analysed using the QuantStudio 3 software. The threshold cycle (CT) values for each target gene were obtained, and gene expression in each sample was normalised to the expression of the gyrA reference gene. The relative expression of each target gene was calculated using the comparative CT method. Results are reported as a percentage of gyrA expression, where the expression of gyrA in each sample is considered 100%. For example, a target gene expressed at the same level as gyrA yields a value of 100%. Values above or below 100% indicate higher or lower expression relative to gyrA, respectively.
gyrA CT mean-Gene ∆CT mean / gyrA CT mean × 100%
S. aureus screening
Initial screening on BP agar indicated that S. aureus was present in many, but not all, of the collected samples. Specifically, black colonies characteristic of S. aureus grew from the ear and nasal swabs of most participants. However, no black colonies were observed on the nasal swab plates of Participants 3, 7, and 8, or on the ear swab plates of Participant 1 and Participant 8. This indicates a biochemical absence of S. aureus in those respective sites, as S. aureus typically reduces tellurite to produce black pigmentation on BP agar. All other sampled sites showed at least one putative S. aureus colony on BP agar. To further verify colony identity, representative black colonies from each positive plate were subjected to Gram staining. Microscopy confirmed that these isolates were Gram-positive cocci in clusters (the expected morphology for S. aureus).
Housekeeping gene and primer validation
As described in the Methods, five candidate housekeeping genes were tested to choose an appropriate reference gene for qPCR. Agarose gel electrophoresis of PCR products (Figure 1) showed that gyrA was amplified consistently from S. aureus colonies of multiple participants, whereas gyrB, era, SecA, and dnaG often yielded faint or no bands in some samples. Therefore, gyrA was selected as the stable reference gene for normalisation of qPCR data.
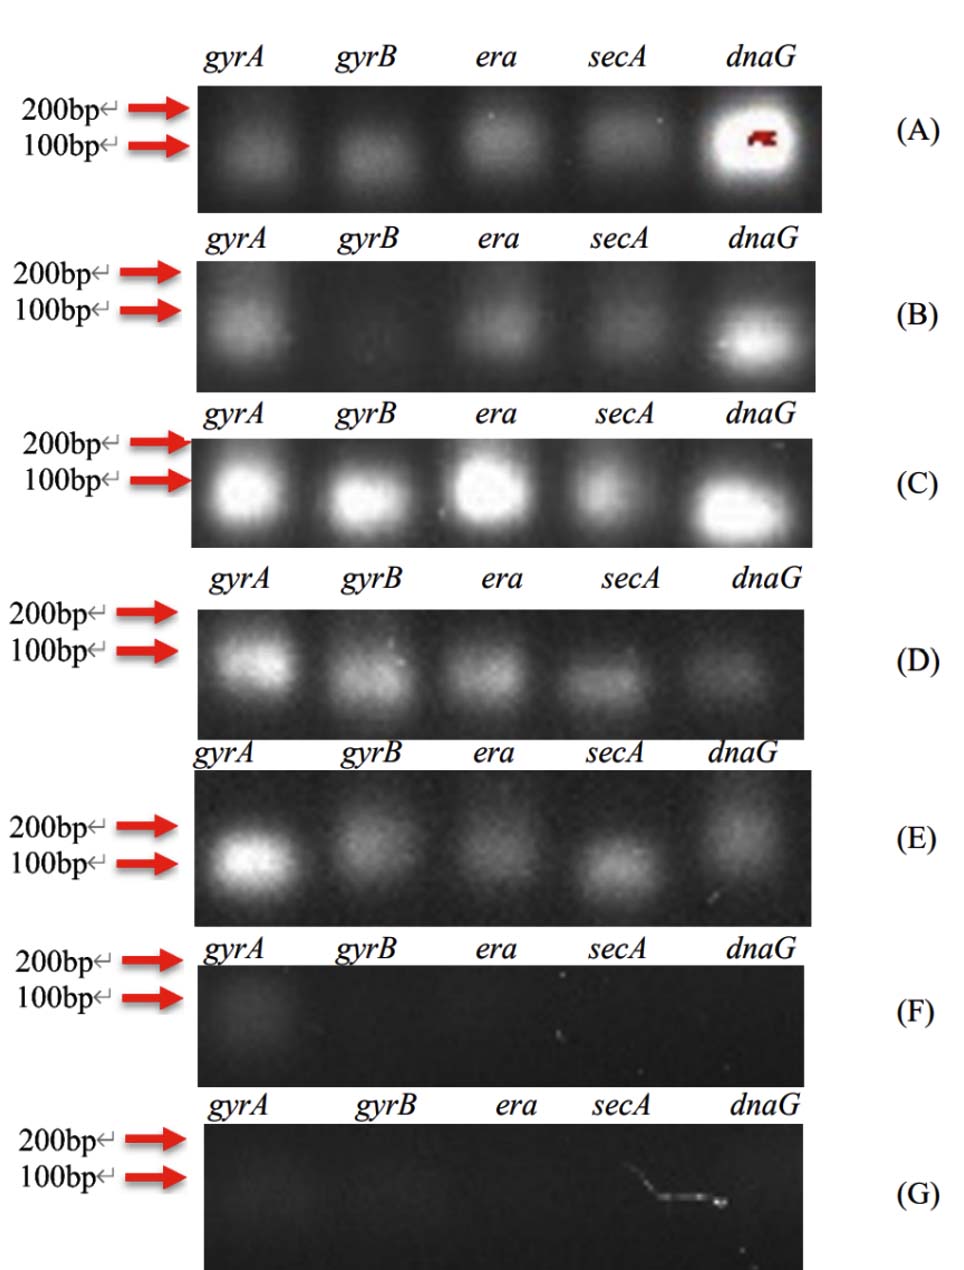
Figure 1. Agarose gel electrophoresis of PCR products for candidate housekeeping genes (gyrA, gyrB, era, SECA, dnaG). The gel (cropped to show the 200 bp marker and above) indicates that only gyrA produced a single clear band in all tested samples. Lanes: A = Patient 1 (ear sample); B-G = Participants 1-6 (ear samples). A 100 bp DNA ladder is shown at the left
To ensure the specificity and efficiency of the designed primers for the target SAg and MRSA genes, we performed melt curve analyses on both the reference strains and participant samples. Supplementary Materials Figure S1 illustrates the melt curve results. In Figure S1(i), the two reference S. aureus strains (BNCC 139843 and 358401) each produced a single distinct melt peak for all eight target amplicons (SpA, SEA, SEB, SEC, SED, mecA, femB, and gyrA), indicating that each primer set amplified a specific product without significant off-target amplification. Similarly, melt curves for the ear swab samples from Patient 1 and Participants 1-11 (Figure S1(ii)) showed single peaks for all targets, confirming primer specificity in actual participant samples. These results demonstrate that the qPCR assays were specific and suitable for quantifying the target genes in our sample set.
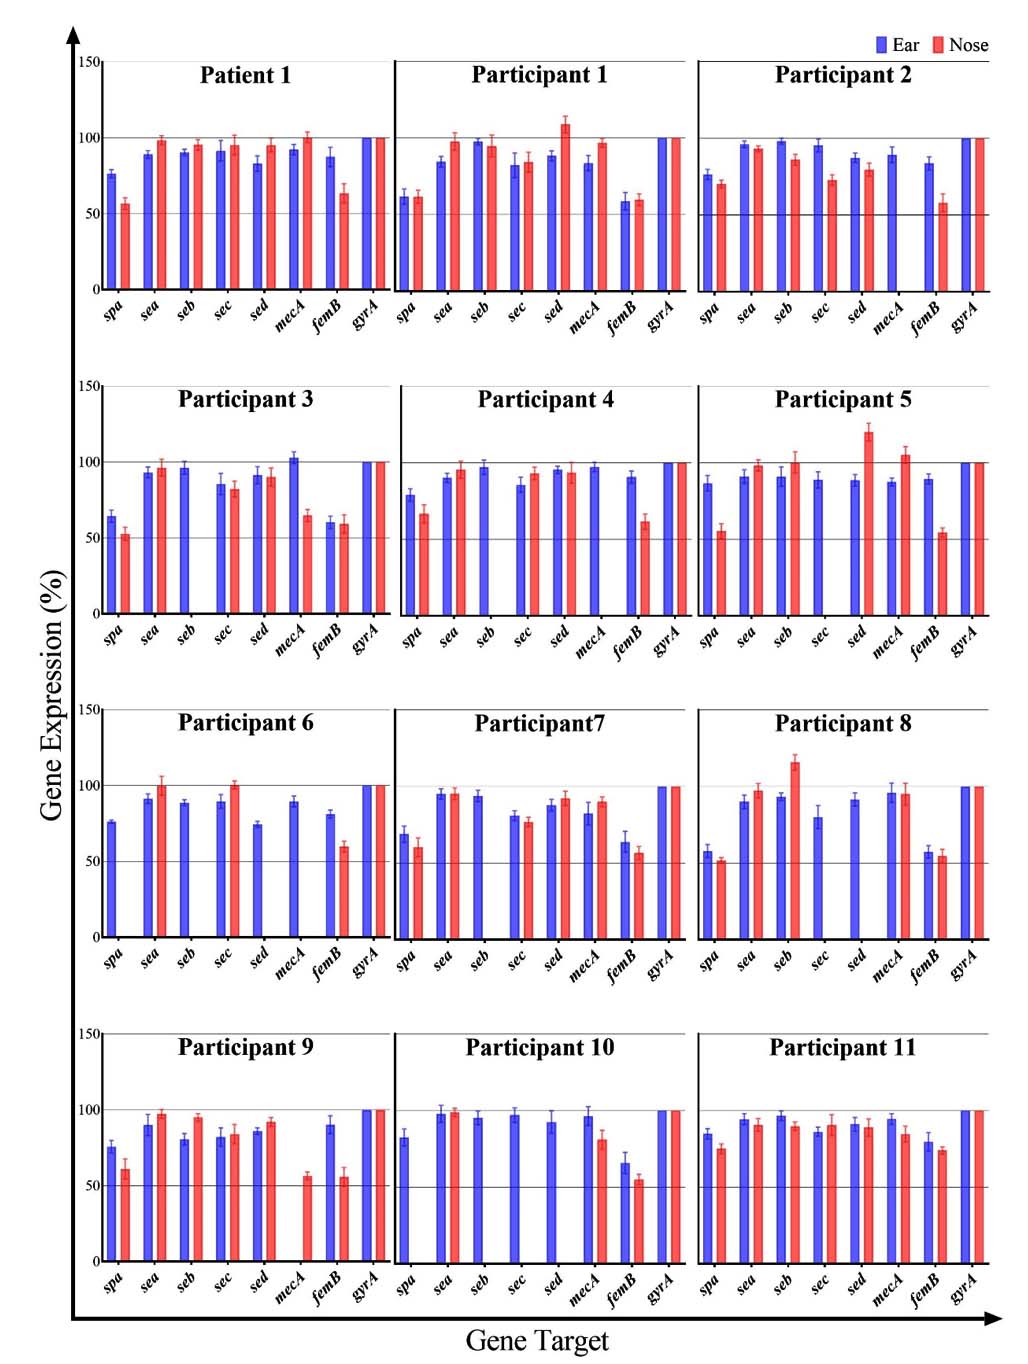
Figure 2. Relative expression (presence) of superantigen genes (SpA, SEA, SEB, SEC, SED) and MRSA marker genes (mecA, femB) in the ear and nose samples of the AR patient (Patient 1) and 11 healthy participants. Values are expressed as percentages relative to the gyrA reference gene (100%). Each cluster of bars represents an individual, with blue bars for ear swab and orange bars for nasal swab
Superantigen and MRSA gene expression
Using the validated qPCR assays, we quantified the expression (or gene presence, in the case of these DNA targets) of the five superantigen genes (SpA, SEA, SEB, SEC, SED) and the two MRSA marker genes (mecA, femB) in all ear and nose samples. The relative expression levels of all targets, normalised to gyrA, are presented in Figure 2 as percentages. Overall, we observed considerable variability between individuals and within the same individual between ear and nose sites. Notably, in the AR Patient 1 and in Participants 1, 2, and 11, all seven target genes were detected in both the ear and nose samples. In contrast, many of the other healthy participants had one or more target genes undetectable in either their ear or nose swabs. Below, we detail the findings for each individual:
Patient 1 (AR patient)
All target genes were detected in both the ear and nose of Patient 1. In the ear swab, the gene expression levels (relative to gyrA) for SpA, SEA, SEB, SEC, SED, mecA, and femB were 76%, 89%, 90%, 91%, 83%, 92%, and 87%, respectively. In the nasal swab, the corresponding expression levels were 57%, 98%, 95%, 95%, 95%, 100%, and 63%. Notably, in Patient 1, the nose sample showed higher levels of all SAg genes (SEA, SEB, SEC, SED) and the mecA gene compared to the ear sample, with the exception of SpA and femB, which were slightly higher in the ear. In fact, mecA in the nose was expressed at essentially 100% of the gyrA level, indicating a very high abundance of the mecA gene in the nasal sample of this patient.
Participant 1
In the ear sample of Participant 1, SpA, SEA, SEB, SEC, SED, mecA, and femB were detected at 62%, 84%, 97%, 82%, 89%, 84%, and 54% of gyrA levels, respectively. The corresponding nasal sample showed values of 62%, 98%, 95%, 84%, 109%, 97%, and 60%. With the exception of SpA (which was equal in both sites) and SEB (which was only marginally lower in the ear), all SAg genes in Participant 1 were present at higher levels in the nose than in the ear. This is noteworthy given that S. aureus colonies were not obtained from the ear BP culture for this participant, yet the qPCR still detected these genes in the ear swab DNA. Both MRSA marker genes (mecA and femB) were present in both the ear and nose of Participant 1.
Participant 2
In the ear swab of Participant 2, the expression levels for SpA, SEA, SEB, SEC, SED, mecA, and femB were 76%, 96%, 98%, 95%, 87%, 89%, and 83%, respectively. The nasal swab showed 70%, 93%, 86%, 73%, 80%, 0%, and 58%, respectively. Thus, all target genes except mecA were detected in the nose (mecA was not detected in Participant 2’s nasal sample). For Participant 2, the ear sample had generally higher levels of SAg genes and femB compared to the nose. The absence of mecA in the nose alongside the presence of femB suggests that while S. aureus was present, it may not have been MRSA in that nasal sample.
Participant 3
Ear sample levels for Participant 3 were 64% (SpA), 93% (SEA), 96% (SEB), 85% (SEC), 92% (SED), 103% (mecA), and 60% (femB). The nose sample levels were 53%, 96%, 0%, 82%, 90%, 65%, and 59%, respectively. S. aureus did not grow from the nasal swab of Participant 3 (no black colonies on BP agar), and accordingly, the SEB gene was not detected in the nose sample (0%). Despite the culture-negative nasal sample, several SAg genes (SpA, SEA, SEC, SED) and both MRSA markers were detected in the nose by qPCR. Apart from SpA (which was lower in the ear), SEB (absent in the nose), SEC and SED (which showed no significant difference between sites), and femB (slightly higher in ear), the other genes including mecA were actually present at higher levels in the nose than in the ear.
Participant 4
In the ear sample of Participant 4, the levels were 79% (SpA), 90% (SEA), 97% (SEB), 86% (SEC), 95% (SED), 97% (mecA), and 90% (femB). The nose sample had 66%, 96%, 0%, 93%, 93%, 0%, and 62%, respectively. The SEB and mecA genes were not detected in the nose of Participant 4. With the exception of those absent targets and SpA (which was higher in ear) and SED (which was roughly equivalent in both sites), the other SAg genes were present at higher levels in the ear than in the nose. In fact, only the SEA and SEC genes were noticeably higher in the nose compared to the ear for this participant.
Participant 5
Participant 5’s ear swab showed 87% (SpA), 91% (SEA), 91% (SEB), 89% (SEC), 88% (SED), 87% (mecA), and 90% (femB). The nose swab showed 55%, 98%, 100%, 0%, 120%, 105%, and 54%, respectively. In the nose of Participant 5, SEC was not detected, whereas SEB, SED, and mecA were notably high (SED and mecA exceeded the gyrA reference level at 120% and 105%, respectively). Apart from SpA, SEC, and femB (which were lower in the nose), all other SAgs in Participant 5 were at higher levels in the nasal sample than in the ear. It is noteworthy that in the nasal sample, SEB, SED, and mecA reached levels comparable to or higher than the housekeeping gene (gyrA), indicating a very strong presence of these genes.
Participant 6
The ear sample for Participant 6 had 76% (SpA), 91% (SEA), 89% (SEB), 90% (SEC), 74% (SED), 89% (mecA), and 81% (femB). In the nose sample, the values were 0%, 100%, 0%, 100%, 0%, 0%, and 60%, respectively. In other words, in Participant 6’s nasal swab, SpA, SEB, SED, and mecA were not detected at all, whereas SEA and SEC were present (each at 100% of gyrA) and femB was detected at a moderate level. For this participant, the ear harboured a more complete set of SAg and MRSA genes, while the nose had a subset (SEA, SEC, femB), possibly reflecting that the nasal S. aureus population lacked certain SAg genes or that S. aureus was not as prevalent in the nose.
Participant 7
In the ear swab from Participant 7, gene levels were 69% (SpA), 95% (SEA), 94% (SEB), 81% (SEC), 88% (SED), 82% (mecA), and 64% (femB). The nose swab had 60%, 95%, 0%, 77%, 92%, 90%, and 57%, respectively. The SEB gene was not detected in the nose of Participant 7. Other than SED and mecA (which were slightly higher in the nose than in the ear), all remaining detected genes in Participant 7 were at similar or lower levels in the nose compared to the ear. It is interesting to note that no S. aureus colonies grew from the nasal sample of this participant on BP agar, yet the qPCR detected most of the SAg genes and the mecA gene in the nasal DNA, again highlighting a discrepancy between culture and PCR detection.
Participant 8
Participant 8’s ear sample showed 58% (SpA), 90% (SEA), 93% (SEB), 80% (SEC), 91% (SED), 96% (mecA), and 57% (femB). The nose sample showed 52%, 97%, 116%, 0%, 0%, 95%, and 55%, respectively. In the nose of Participant 8, SEC and SED were not detected at all, while SEB was detected at a relatively high level (116%). Spa was slightly lower in the nose than in the ear. Participant 8 is unique in that neither the ear nor the nose sample yielded S. aureus colonies on BP agar (both were culture-negative), yet qPCR revealed the presence of mecA and femB in both sites (and several SAg genes as well). This suggests that non-culturable or low-abundance S. aureus (or possibly other bacteria carrying these genes) were present in those samples.
Participant 9
The ear swab from Participant 9 had 76% (SpA), 90% (SEA), 81% (SEB), 82% (SEC), 86% (SED), 0% (mecA), and 90% (femB). The nasal swab had 61%, 97%, 95%, 84%, 92%, 56%, and 56%, respectively. In the ear of Participant 9, mecA was not detected (0%), whereas in the nose, mecA was present (at 56%). Comparing sites, the nasal sample showed higher levels of SEA, SEB, SED, and mecA than the ear sample (SEC was roughly similar, and SpA and femB were higher in the ear). Thus, although mecA was absent in the ear culture of Participant 9, it was detectable in the nose, indicating a nasal MRSA carriage that was not mirrored in the ear.
Participant 10
In Participant 10’s ear sample, we measured 83% (SpA), 98% (SEA), 95% (SEB), 97% (SEC), 93% (SED), 96% (mecA), and 66% (femB). In the nose sample, however, SpA, SEB, SEC, and SED were all undetectable (0%), while SEA was 99%, mecA 81%, and femB 55%. Therefore, Participant 10’s nasal cavity lacked four of the SAg genes (SpA, SEB, SEC, SED) that were present in the ear. The remaining genes that were present in the nose (SEA, mecA, femB) were at lower levels compared to the ear (except SEA, which was approximately equal). This indicates that the ear of Participant 10 harboured a more diverse or abundant S. aureus population than the nose.
Participant 11
The ear sample of Participant 11 showed 85% (SpA), 94% (SEA), 97% (SEB), 86% (SEC), 91% (SED), 95% (mecA), and 80% (femB). The nose sample showed 75%, 90%, 90%, 90%, 89%, 85%, and 74%, respectively. All five SAg genes and both MRSA genes were detected in both sites for Participant 11. The levels were fairly comparable between ear and nose; only SEC was modestly higher in the nose (90% vs 86% in ear), while most other genes were slightly higher in the ear. Participant 11 thus had a full complement of the tested genes in both ear and nose, similar to the AR patient and a few other healthy individuals (e.g., Participants 1, 2, 9).
This study aimed to characterise the presence and relative abundance of select S. aureus superantigen genes (SpA, SEA, SEB, SEC, SED) and MRSA-associated genes (mecA, femB) in the ears and noses of human subjects, and to investigate their co-occurrence in these connected sites. Using a selective culture approach (BP agar) to identify S. aureus colonies, we found that not all participants were colonised with S. aureus in both sites. In fact, four of the twelve individuals (Participants 1, 3, 7, and 8) had one or both sampling sites culture-negative for S. aureus, suggesting that S. aureus colonisation of the ear and nose was not ubiquitous in our study group. Interestingly, even in culture-negative samples for S. aureus, we detected SAg and MRSA genes via qPCR, often in quantities comparable to those found in culture-positive samples. This discrepancy suggests that either non-culturable S. aureus or other bacteria carrying homologous genes were present in those samples, underscoring the enhanced sensitivity of molecular detection.
Methodologically, we took several steps to ensure the rigor and reliability of our analyses. We first identified a stable reference gene (gyrA) for normalising qPCR data by screening multiple housekeeping genes, an important step for accurate quantification in bacterial gene expression studies. The choice of gyrA was validated by consistent amplification across participant samples (Figure 1). We also confirmed the specificity of each primer set by melt curve analysis (Figure 2), using both known positive control strains and actual participant samples. The single-peak melt curves indicated that the primers amplified the intended targets without significant off-target effects, lending confidence to the qPCR results. All reactions were performed in triplicate and included appropriate controls, further underscoring the methodological robustness of our pilot investigation.
Our findings show that whenever S. aureus was present (as confirmed by culture), at least one of the tested SAg genes was expressed/detected in that sample. This aligns with previous studies, which report that S. aureus isolates commonly carry superantigen genes.31-34 In our samples, the SpA gene was particularly prevalent, as it was detected in 100% of ear swabs (12/12) and in 10 out of 12 nasal swabs. The two nasal samples lacking SpA (Participants 6 and 10) correspond to an absence rate of roughly 16.7% of nasal isolates, which is somewhat higher than reported SpA-negative rates in other populations. For example, only 3.8% of S. aureus strains lacked SpA in a study of 208 isolates from northern Iran35 and ~5% in a study of 17 isolates from Lagos, Nigeria.36 Our higher observed rate of SpA absence (approximately 10%-17%, depending on calculation) is likely due to our much smaller sample size and possibly the inclusion of samples where S. aureus density was low. Nevertheless, among the SpA-positive samples, there was no clear distinction between healthy participants and the AR patient in terms of SpA levels: the average SpA expression in healthy participants’ ears was ~74%, comparable to Patient 1’s ear (76%), and in the nose, it was ~50% in healthy individuals versus 57% in Patient 1.
The SEA gene was ubiquitous in our study, detected in every sample from all individuals (24/24 samples). This is consistent with reports that SEA is the most common staphylococcal enterotoxin gene in various contexts.32-34 The other enterotoxin genes were also widespread but not universal in nasal samples: in our dataset, SEB, SEC, and SED genes were each found in all 12 ear samples (100% of participants) but in 7-9 of 12 nose samples (58%-75%). The relatively lower frequency of these SAg genes in nose samples could reflect either true biological differences in nasal vs. auricular colonisation or simply the small sample size. It is noteworthy that our healthy participants often had SAg gene profiles similar to the AR patient, albeit sometimes at lower levels or only in one site. For instance, healthy Participants 1, 2, 9, and 11 each expressed all four tested enterotoxin genes and SpA in at least one site (often both), yet they were asymptomatic. This suggests that asymptomatic carriage of multiple SAg-producing S. aureus strains is possible, which may predispose these individuals to future allergic or inflammatory flare-ups if conditions permit.
Patient 1, who has clinically diagnosed AR, unsurprisingly harboured S. aureus in both the ear and nose. Prior studies have noted frequent S. aureus colonisation and SAg presence in AR patients.37 In Patient 1, we detected all four enterotoxin genes (SEA, SEB, SEC, SED) in both ear and nose samples. Interestingly, the expression levels of these SAg genes in Patient 1’s ear and nose were relatively low (all below 100% of gyrA) and quite similar between the two sites. This pattern does not fully align with some reports that AR patients show particularly strong responses to certain SAgs, such as SEA and SEB.37 One interpretation is that our Patient 1 may have been in a relatively quiescent phase of AR during sampling, so that SAg levels, while present, were not exceptionally high. It could also imply that other immune regulatory factors modulate SAg expression or impact in this patient. Nonetheless, we observed that for Patient 1, all SAg gene expression levels were modestly higher in the nose than in the ear. This could suggest slight differences in S. aureus strain populations or gene regulation between the nasal mucosa and the external ear canal for this patient. It should be noted, however, that the external ear canal is not directly involved in AR symptoms, so even a higher burden of SAgs in the ear may not trigger the same clinical effects as in the nasal passages.
Another notable observation in Patient 1 was the relatively low SpA gene expression compared to expectations. Previous studies have found high SpA expression in S. aureus isolates from patients with airway diseases,38,39 but Patient 1 showed quite low SpA levels in both ear and nose. This again might indicate that the patient was not experiencing an active AR exacerbation at the time of sampling, or that the colonising strain had lower SpA expression. It raises the possibility that SAg gene expression could fluctuate with disease activity, an aspect that could be explored in future longitudinal studies.
It should also be noted that the skin is also often colonized by S. aureus40, and that other bacteria like Streptococcus spp.41
We also confirmed that Patient 1 carried the mecA and femB genes in both ear and nasal samples, indicating colonisation by MRSA. This finding in a community setting (outside of a hospital environment) underscores that MRSA can be present in individuals with chronic airway conditions like AR. Importantly, several of the healthy participants in our study also carried one or both MRSA genes in their swabs. In fact, when considering both mecA and femB, 11 out of 12 individuals (all except Participant 8) had evidence of MRSA-related genes in at least one site. Specifically, mecA and femB were concurrently detected (suggesting true MRSA) in the nasal swabs of Participants 1, 4, 5, 6, 9, 10, 11, and 12, and in the ear swabs of Participants 2, 3, 4, 5, 6, 7, 9, 10, 11, and 12. If we define MRSA presence as having both mecA and femB, the overall MRSA gene detection rate in our cohort was approximately 91.7% (11/12 individuals), which is remarkably high. Even when considering sample-wise detection, we found MRSA genes in 95% of samples (if one counts detection of both markers). This is in stark contrast to a previous report from Zhejiang Province (China), which found MRSA carriage rates of roughly 33%-35% in hospital patients between 2015 and 2017.42 Our higher detection rate can be partly attributed to our use of sensitive molecular methods and the inclusion of healthy university-affiliated individuals rather than hospital patients.43 It suggests that MRSA or at least methicillin-resistance genes may be more widespread in the general community than culture-based studies indicate.
A recurring theme in our results is the mismatch between culture-based detection of S. aureus and PCR-based detection of SAg/MRSA genes. For example, Participant 8 had no S. aureus growth in either ear or nose, yet multiple genes (including mecA and femB) were detected in both. Participant 1’s ear showed no S. aureus colonies, yet was positive for all target genes by qPCR. These discrepancies highlight potential alternative sources for the detected genes, such as Streptococcus.41 One explanation is that other bacterial species can carry similar genes; for instance, the mecA gene is known to occur in Staphylococcus epidermidis, Staphylococcus pseudintermedius, and Staphylococcus haemolyticus, among others.44,45 Likewise, the femB gene, while often used as an S. aureus-specific marker, has homologs in other staphylococci (for example, S. epidermidis has femA/B analogs.46) It is possible that in samples where no S. aureus was cultured, our qPCR picked up DNA from coagulase-negative staph or other bacteria carrying mecA or femB. Streptococcus pyogenes, Yersinia pseudotuberculosis, and Mycoplasma arthritidis are known to produce superantigens as well41 and could theoretically be present in the flora of some participants, contributing to signals for genes analogous to SEA-SED (though the primers we used were specific for staphylococcal genes, low-level colonisation by S. aureus below culture detection limits is another likely reason). These findings underscore that the detection of a gene by PCR does not always equate to the presence of viable S. aureus bacteria, and caution must be exercised in interpretation.
Our study also suggests that horizontal gene transfer between bacteria could be a factor to consider. The presence of mecA or femB in samples without S. aureus might indicate that other skin or mucosal commensals harbor these resistance genes, which could be transferred to S. aureus if it co-colonises later. Given that all but one participant had S. aureus detected in at least one site, and many had SAg levels comparable to the AR patient, the stage may be set for exchange of genetic material such as SCCmec (the staphylococcal cassette chromosome containing mecA)44 among the staphylococcal community on these individuals. This could elevate the risk of even healthy carriers developing or spreading MRSA infections in the future.
When comparing ear and nose sites within individuals, we found that, in general, the ear samples tend to have equal or higher frequencies of SAg gene detection than the nose samples (with some notable exceptions like Patient 1). This could imply that the external ear canal, which is connected to the nasopharynx via the eustachian tube, might serve as a reservoir for SAg-producing microbes, or vice versa. Microbial travel between the nasal cavity and the middle ear (via the eustachian tube) is known to play a role in certain infections (for example, nasal pathogens can lead to otitis media). Our data hint that such travel could also apply to S. aureus carrying virulence factors, though the directionality and frequency of such transfer would need further investigation (possibly by strain typing methods to see if identical clones inhabit both sites).
Limitations
It is important to acknowledge the limitations of this study. First, the sample size was small (only 12 individuals, including one AR patient), which limits the statistical power and generalisability of the findings. A larger cohort would be necessary to draw more definitive conclusions about patterns of colonisation and gene prevalence. Second, the participants were all from a single community (university-affiliated adults), which may introduce selection bias; their microbial profiles might not represent other populations or age groups. Third, our study was cross-sectional, providing a single snapshot in time; temporal fluctuations in colonisation or gene expression were not assessed. Finally, while molecular detection is sensitive, it cannot confirm whether the detected genes are expressed at the protein level or have functional effects, nor can it distinguish between live bacteria and DNA remnants. We did not perform RNA-based expression analysis or quantify actual toxin production. Despite these limitations, the study offers preliminary insights that can inform future larger-scale studies.
In conclusion, our pilot qPCR-based analysis revealed that S. aureus and specifically SAg-producing S. aureus can inhabit the ear and nasal cavities of both healthy individuals and those with allergic rhinitis. Most S. aureus isolates from these sites carried multiple superantigen genes, with the SEA gene being the most frequently detected and SEB among the least. Remarkably, even in samples where S. aureus was not recoverable by culture, we detected MRSA-associated genes (mecA and femB), likely originating from other staphylococcal species, which highlights the potential for the horizontal transfer of antibiotic resistance elements in the commensal flora. Our results demonstrate that PCR screening for SAg and MRSA genes is a powerful tool to quickly assess colonisation by potentially virulent or resistant strains; however, such molecular methods should be complemented by traditional culture and biochemical identification for confirmation of active MRSA infections. This pilot study was limited by a small sample size, and thus the findings should be considered preliminary. Further research with larger and more diverse cohorts, as well as longitudinal sampling, is warranted to validate these observations and to better understand the dynamics of SAg and MRSA gene carriage in the ear-nose-throat region.
SUPPLEMENTARY INFORMATION
Additional file: Table S1-S2 and Figure S1.
ACKNOWLEDGMENTS
The authors are thankful to the ENT Clinic, Wenzhou Medical University, China, for their support.
CONFLICT OF INTEREST
The authors declare that there is no conflict of interest.
AUTHORS’ CONTRIBUTION
PDPA and LJ performed sample collection and contributed equally to this work. ZL, TJ, HZ, KY, MX and SD performed the experiments. SKEG supervised the study and wrote, reviewed and revised the manuscript. All authors read and approved the final manuscript for publication.
FUNDING
None.
DATA AVAILABILITY
All datasets generated or analyzed during this study are included in the manuscript.
ETHICS STATEMENT
This study was approved by the Institutional Ethics Committee, Wenzhou-Kean University, China, vide approval number WKUIRB2023-039R.
INFORMED CONSENT
Written informed consent was obtained from the participants before enrolling in the study.
- Tuffs SW, Goncheva MI, Xu SX, et al. Superantigens promote Staphylococcus aureus bloodstream infection by eliciting pathogenic interferon-gamma production. Proc Natl Acad Sci U.S.A. 2022;119(8):e2115987119.
Crossref - Suvarnsit K, Kiratisin P, Bunnag C, Tantilipikorn P. Prevalence of nasal carriage of Staphylococcus aureus in allergic rhinitis patients and healthy controls in Thailand. Asian Pac J Allergy Immunol. 2021;39:163-167.
Crossref - Nowrouzian FL, Dauwalder O, Meugnier H, et al. Adhesin and superantigen genes and the capacity of Staphylococcus aureus to colonize the infantile gut. J Infect Dis. 2011;204(5):714-721.
Crossref - Nada HA, Gomaa NIM, Elakhras A, Wasfy R, Baker RA. Skin colonization by superantigen-producing Staphylococcus aureus in Egyptian patients with atopic dermatitis and its relation to disease severity and serum interleukin-4 level. Int J Infect Dis. 2012;16(1):e29-e33.
Crossref - Xu SX, Gilmore KJ, Szabo PA, et al. Superantigens subvert the neutrophil response to promote abscess formation and enhance Staphylococcus aureus survival in vivo. Infect Immun. 2014;82(9):3588-3598.
Crossref - Deacy AM, Gan SK-E, Derrick JP Superantigen recognition and interactions: functions, mechanisms and applications. Front Immunol. 2021;12:731845.
Crossref - Feraudet-Tarisse C, Goulard-Huet C, Nia Y, et al. Highly sensitive and specific detection of staphylococcal enterotoxins SEA, SEG, SEH, and SEI by immunoassay. Toxins. 2021;13(2):130.
Crossref - Andjelkovic M, Tsilia V, Rajkovic A, De Cremer K, Van Loco J. Application of LC-MS/MS MRM to determine staphylococcal enterotoxins (SEB and SEA) in milk. Toxins.2016;8(4):4.
Crossref - Baysoy G, Arslan S, Karabay O, Uyan AP. Nasal carriage of Staphylococcus aureus in children with allergic rhinitis and the effect of intranasal fluticasone propionate treatment on carriage status. Int J Pediatr Otorhinolaryngol. 2007;71(2):205-209.
Crossref - Becker S, Frankel MB, Schneewind O, Missiakas D. Release of protein A from the cell wall of Staphylococcus aureus. Proc Natl Acad Sci U S A. 2014;111(4):1574-1579.
Crossref - Bachert C, Humbert M, Hanania NA, Zhang N, Holgate S, Buhl R, Broker BM. Staphylococcus aureus and its IgE-inducing enterotoxins in asthma: current knowledge. Eur Respir J. 2020;55(4):1901592.
Crossref - Hu H, Liu S, Hon K, Psaltis AJ, Wormald PJ, Vreugde S. Staphylococcal protein A modulates inflammation by inducing interferon signaling in human nasal epithelial cells. Inflamm Res. 2023;72(2):251-262.
Crossref - Lua W-H, Su CT-T, Yeo JY, et al. Role of the IgE variable heavy chain in FcוRIa and superantigen binding in allergy and immunotherapy. J Allergy Clin Immunol. 2019;144(2):514-523.e5.
Crossref - Kobayashi SD, DeLeo FR. Staphylococcus aureus protein A promotes immune suppression. mBio. 2013;4(5):e00764-13.
Crossref - Cruz AR, den Boer MA, Strasser J, et al. Staphylococcal protein A inhibits complement activation by interfering with IgG hexamer formation. Proc Natl Acad Sci U S A. 2021;118(7):e2016772118.
Crossref - Hurlimann-Dalel RL, Ryffel C, Kayser FH, Berger-Bachi B. Survey of the methicillin resistance-associated genes mecA, mecR1-mecI, and femA-femB in clinical isolates of methicillin-resistant Staphylococcus aureus. Antimicrob Agents Chemother. 1992;36(12):2617-2621.
Crossref - Kobayashi N, Wu H, Kojima K, et al. Detection of mecA, femA, and femB genes in clinical strains of staphylococci using polymerase chain reaction. Epidemiol Infect. 1994;113(2):259-266.
Crossref - Humaryanto H, Simanjuntak CA, Hanina H, Lipinwati L. Identification of methicillin resistant Staphylococcus aureus (MRSA) using cefoxitin disc diffusion test and duplex polymerase chain reaction in Jambi city hospitals. J Phys Conf Ser. 2019;1246(1):012016.
Crossref - Chu DTW, Plattner JJ, Katz L. New directions in antibacterial research. J Med Chem. 1996;39(20):3853-3874.
Crossref - Rajagunalan S, Soni D, Mishra A, et al. Molecular characterization and typing of Staphylococcus isolated from nostrils of food handlers. J Cell Tissue Res. 2016;16(3):5799-5810.
- Deacy AM, Gan SK-E The influence of variable-heavy chain families on IgG2,3,4 FcgRs binding and B-cell superantigens protein G and L binding using biolayer interferometry. Antib Ther. 2023;6:182-193.
Crossref - Gan SK, Derrick JP, Fraternali F. Editorial: Understanding and engineering antibody-superantigen interactions. Front Immunol. 2022;13:857339.
Crossref - Ling W-L, Su CT-T, Lua W-H, et al. Variable-heavy (VH) family influence on IgA1/2 engagement with antigen, FcaRI and superantigen proteins G, A, and L. Sci Rep. 2022;12(1):6510.
Crossref - Ling W-L, Yeo JY, Ng Y-L, Wipat A, Gan SK-E. More than meets the kappa for antibody superantigen protein L (PpL). Antibodies (Basel). 2022;11(1):14.
Crossref - Ling W-L, Gan SK-E. The synergistic effects of the constant region and variable heavy chain families of multimeric IgM on its interaction with Fc-mu receptor and antigen. Explor Immunol. 2022;2:783-793.
Crossref - Su CT-T, Lua W-H, Poh J-J, Ling W-L, Yeo JY, Gan SK-E. Molecular insights into nickel binding to therapeutic antibodies as a possible new antibody superantigen. Front Immunol. 2021;12:676048.
Crossref - Klotz M, Opper S, Heeg K, Zimmermann S. Detection of Staphylococcus aureus enterotoxins A to D by real-time fluorescence PCR assay. J Clin Microbiol. 2003;41(10):4683-4687.
Crossref - Rocha DJP, Santos CS, Pacheco LGC. Bacterial reference genes for gene expression studies by RT-qPCR: survey and analysis. Antonie Van Leeuwenhoek. 2015;108(3):685-693.
Crossref - Nguyen PV, Ghezal A, Hsueh YC, Boudier T, Gan SK, Lee HK. Optimal processing for gel electrophoresis images: applying Monte Carlo Tree Search in GelApp. Electrophoresis. 2016;37(15-16):2208-2216.
Crossref - Sim J-Z, Nguyen P-V, Lee H-K, Gan SK-E. Republication – GelApp: mobile gel electrophoresis analyser. Sci Phone Apps Mob Devices. 2019;5(4):4.
Crossref - Wilson GJ, Seo KS, Cartwright RA, et al. A novel core genome-encoded superantigen contributes to the lethality of community-associated MRSA necrotizing pneumonia. PLoS Pathog. 2011;7(10):e1002271.
Crossref - Kerouanton A, Hennekinne J-A, Letertre C, et al. Characterization of Staphylococcus aureus strains associated with food poisoning outbreaks in France. Int J Food Microbiol. 2007;115(3):369-375.
Crossref - Wang T, Tao X, Guo M, et al. Sequence polymorphisms and evolutionary analysis of Staphylococcus aureus enterotoxins A, B, C and D. Dis Surveill. 2020;35:926-933.
Crossref - Wieneke AA, Roberts D, Gilbert RJ. Staphylococcal food poisoning in the United Kingdom 1969-1990. Epidemiol Infect. 1993;110(3):519-531.
Crossref - Shakeri F, Shojai A, Golalipour M, Rahimi-Alang S, Vaez H, Ghaemi EA. Spa diversity among MRSA and MSSA strains of Staphylococcus aureus in north of Iran. Int J Microbiol. 2010;2010:351397.
Crossref - Adesida SA, Likhoshvay Y, Eisner W, et al. Repeats in the 3′ region of the protein A gene are unique in a strain of Staphylococcus aureus recovered from wound infections in Lagos, Nigeria. Afr J Biotechnol. 2006;5(20):1858-1863.
- Abdurrahman G, Schmiedeke F, Bachert C, Broker BM, Holtfreter S. Allergy – a new role for T cell superantigens of Staphylococcus aureus? Toxins. 2020;12(3):176.
Crossref - Gomez MI, Lee A, Reddy B, et al. Staphylococcus aureus protein A induces airway epithelial inflammatory responses by activating TNFR1. Nat Med. 2004;10(8):842-848.
Crossref - Schleich F, Moermans C, Gerday S, et al. Patients with asthma only sensitized to Staphylococcus aureus enterotoxins have more exacerbations, airflow limitation, and higher levels of sputum IL-5 and IgE. J Allergy Clin Immunol Pract. 2023;11(10):3055-3061.e4.
Crossref - Ryu S, Song PI, Seo CH, Cheong H, Park Y. Colonization and infection of the skin by S. aureus: immune system evasion and the response to cationic antimicrobial peptides. Int J Mol Sci. 2014;15(5):8753-8772.
Crossref - Commons RJ, Smeesters PR, Proft T, Fraser JD, Robins-Browne R, Curtis N. Streptococcal superantigens: categorization and clinical associations. Trends Mol Med. 2014;20(1):48-62.
Crossref - Huang L, Zhang R, Hu Y, et al. Epidemiology and risk factors of methicillin-resistant Staphylococcus aureus and vancomycin-resistant enterococci infections in Zhejiang, China from 2015 to 2017. Antimicrob Resist Infect Control. 2019;8(1):90.
Crossref - Jonas D, Speck M, Daschner FD, Grundmann H. Rapid PCR-based identification of methicillin-resistant Staphylococcus aureus from screening swabs. J Clin Microbiol. 2002;40(5):1821-1823.
Crossref - McManus BA, Coleman DC, Deasy EC, et al. Comparative genotypes, staphylococcal cassette chromosome mec (SCCmec) types and antimicrobial resistance in Staphylococcus epidermidis and Staphylococcus haemolyticus isolates from infections in humans and companion animals. PLoS One. 2015;10(9):e0138079.
Crossref - Skov R, Varga A, Matuschek E, et al. EUCAST disk diffusion method for detection of mecA-mediated b-lactam resistance in Staphylococcus pseudintermedius: oxacillin versus cefoxitin. Clin Microbiol Infect. 2020;26L122.e1-122.e6.
Crossref - Alborn WE, Hoskins J, Unal S, et al. Cloning and characterization of femA and femB from Staphylococcus epidermidis. Gene. 1996;180(1-2):177-181.
Crossref
© The Author(s) 2026. Open Access. This article is distributed under the terms of the Creative Commons Attribution 4.0 International License which permits unrestricted use, sharing, distribution, and reproduction in any medium, provided you give appropriate credit to the original author(s) and the source, provide a link to the Creative Commons license, and indicate if changes were made.