


ISSN: 0973-7510
E-ISSN: 2581-690X
https://dx.doi.org/10.22207/JPAM.13.1.41 | © The Author(s). 2019
The study was undertaken to illustrate the degradation of domestic wastewater collected from two scales of sewage treatment plants, treated in a continuous laboratory-scale bioreactor under aerobic conditions using a synthetically developed consortium comprising of three highly efficient bacteria. The objective of the present work was also to design and optimize the bioreactor functioning varying its operational parameters, viz. flow rate, hydraulic retention time, dilution rate and residence time. After 48 hours of treatment, approximately 5L of domestic water was successfully treated with all the major wastewater parameters eventually lying within the permissible limits given by CPCB/WHO.
Domestic wastewater treatment, sewage treatment plant, bacterial consortium, bioreactor, aerobic condition, bioremediation.
Water is one of the major global challenges in the current scenario1. Growing population, industrialization, urbanization and increasing economic activity together constitute an increasing water demand, water wastage and rise in the proportion of wastewater2,3. Hence, smart and rational management of the use of water is a pre-requisite condition for water sustainability. The wastewater is a combination of agricultural drainage, municipal/domestic wastewater, industrial effluents and discharge from hospitals4. Domestic wastewater contains a large amount of organic matter, namely, nitrate, detergents, oil and inorganic salts, etc5,6,7. Untreated sewage and its further disposal into the water bodies cause pollution with high rate of risk to aquatic lives due to high organic matter and thereby increased BOD content6. Hence, in order to reduce the hazardous environmental and health impacts, the domestic wastewater needs to be treated involving the removal of contaminants from the wastewater, thereby making it suitable for discharge into the environment or for reuse8,9,10. Treatment processes carried out are usually not adequate or efficient in meeting the water quality standards11. Chemical treatment of water is easy but costly and harmful because of the toxic chemicals involved; hence, biological treatment is a better choice for treatment. The conventional or biological treatment method involves organic matter degradation by microorganisms, especially bacteria, but the efficiency is low and the process is slow, thus a better method is the need of the hour6.
Each bacterium is effective in degrading a particular contaminant; however, the bio-degradation rate can be enhanced several folds, when more than one bacterium work together, synergistically in the form of a consortium which will assist in degrading many complex contaminants of a contaminated site with rapid and improved efficiency, possibly due to the co-metabolic activity of one species complementing the other12,13. However, microbes in an immobilized state have quite a few advantages over free cells’ application in wastewater treatment. Firstly, immobilization provides high cell density at a particular time for its persistent and effective response to the treatment process. Secondly, the entrapped or immobilized microbes are invulnerable and protected from adverse external environmental stress14.
The present study focussed on isolation and implementation of indigenous bacteria in the formulation of a consortium which was bioaugmented in a laboratory scale continuous aerobic bioreactor. The bioreactor was modelled to treat domestic wastewater in the laboratory which could be used on a pilot-scale. It helped in optimizing all the parameters requisite and pre-conditioned for maximum bioremediation that could mimic the conventional biological treatment process of a wastewater treatment plant but with an improved methodology of use of low-cost plastic matrix for immobilization of consortium for primary treatment and application of a cheap filter for final cleaning of the wastewater
Collection of samples
Fresh domestic effluent samples were collected from two scales of sewage treatment plants (STPs) at Noida, India. STP 1 was an Institutional STP at Noida, and STP 2 was the city STP at Noida, India. The effluents were collected from collection tank after the primary treatment, in large pre-sterilized bottles and stored at 4°C until physico-chemical and biochemical analyses were done in the laboratory.
Chemicals
All the chemicals for physico-chemical, biochemical and microbial growth studies were purchased from Hi Media, India. Double-distilled water was used to prepare the solutions. Sawdust and rice husk, used as adsorbents, were purchased from local vendors.
Wastewater characterization
Wastewater was characterized by conducting the physico-chemical analysis according to the standard protocols, mentioned in APHA7. pH and temperature were recorded by pH meter and scientific thermometer, respectively, at the time of sample collection. Other parameters such as DO (dissolved oxygen), BOD (biochemical oxygen demand), COD (chemical oxygen demand), TDS (total dissolved solids), TSS (total suspended solids), TS (total solids), hardness and alkalinity were determined in the laboratory.
Isolation, characterization and identification of bacteria
The bacteria were isolated from the domestic effluents following the serial dilution method. Further, the isolated bacterial colonies were subjected to gram staining and cfu/mL count. The isolates were then characterized by various biochemical assays as per the standard protocols15,16. The selected bacterial isolates were identified by following the Bergey’s manual17.
Selection of efficacious bacterial isolates
The potent bacterial isolates were eventually selected on the basis of biochemical results and better growth in the raw domestic effluent. To monitor the growth of isolates, 0.5 O.D. (OD600) of each bacterial isolate was inoculated in 10ml of the raw domestic effluent. The bacterial growth was estimated after 24 hours incubation at 35°C, by taking the optical density (O.D.) at 600nm (OD600) by UV-Visible spectrophotometer (1650 UV-Visible spectro-photometer, Shimadzu).
Synergistic/antagonistic effect of bacterial isolates on each other
To assess whether the selected bacteria grew together (synergistically) or against each other via killing the other strain(s) (antagoni-stically), the strains were inoculated in nutrient broth medium and then the O.D. was taken spectrophotometrically at 600nm after 24 hours incubation at 35°C, for 2 days consecutively. Also, the selected strains were streaked on nutrient agar plates and observed for their growth, if they grew antagonistically or synergistically at incubation temperature of 35°C for 24 hours16.
Preparation and immobilization of consortium inoculum on plastic matrix
The selected bacterial strains were grown separately in nutrient broth at incubation temperature ranged 30°C-35°C. Each bacterial strain was maintained at 0.5 O.D. and was inoculated in equal volumes, i.e., 10ml of each bacterium to 100ml of nutrient broth medium and kept for 24 hours of incubation at 35°C. After the growth of consortium, 50 sterilized used plastic bottle caps were introduced to the beaker and the mixture was kept for another 24 hours with gentle mixing so that cells were immobilized uniformly on the plastic matrix. The immobilized consortium on plastic caps, used in the primary tank, was imaged with scanning electron microscope in a SEM instrument (ZEISS EVO 50 MODEL). The caps were cut into a thin film, fixed on an aluminium stub with a double-sided adhesive, conductive carbon tape. Then the samples were sputter-coated with gold for 2-3 minutes and SEM images were taken at magnification ~4,000X.
Bioreactor set-up and working
The purpose of the laboratory structured, continuous aerobic bioreactor design was to determine the operating optimum conditions that favour an optimal effluent quality. A two-stage model was set-up for the experimental treatment of domestic wastewater (Fig. 1). The idea of the design of the model was taken from the model suggested by RamaKrishna and Ligy18 and by Arumugam and Sabarethinam19. The model was modified as per our study.
The laboratory structured continuous scale bioreactor was composed of 5 tanks, i.e., reservoir tank, primary tank, secondary tank, sludge tank and collection tank. The reservoir tank (5L), which was made of plastic, was filled with 5000mL of autoclaved untreated domestic effluent. The effluents were stored in this tank and provided to the primary tank as and when required for treatment. Two plastic cylindrical containers of 5L each were used as the primary and secondary tanks of the bioreactor. The primary and secondary tanks were kept on a wooden based setup with the primary tank placed 1 foot higher than the secondary tank, as shown in Fig. 1. All the tanks were attached through a thick plastic pipe, with a stopper in between the reservoir and primary, between primary and secondary tanks and between secondary and collection tanks, to control the flow rate.
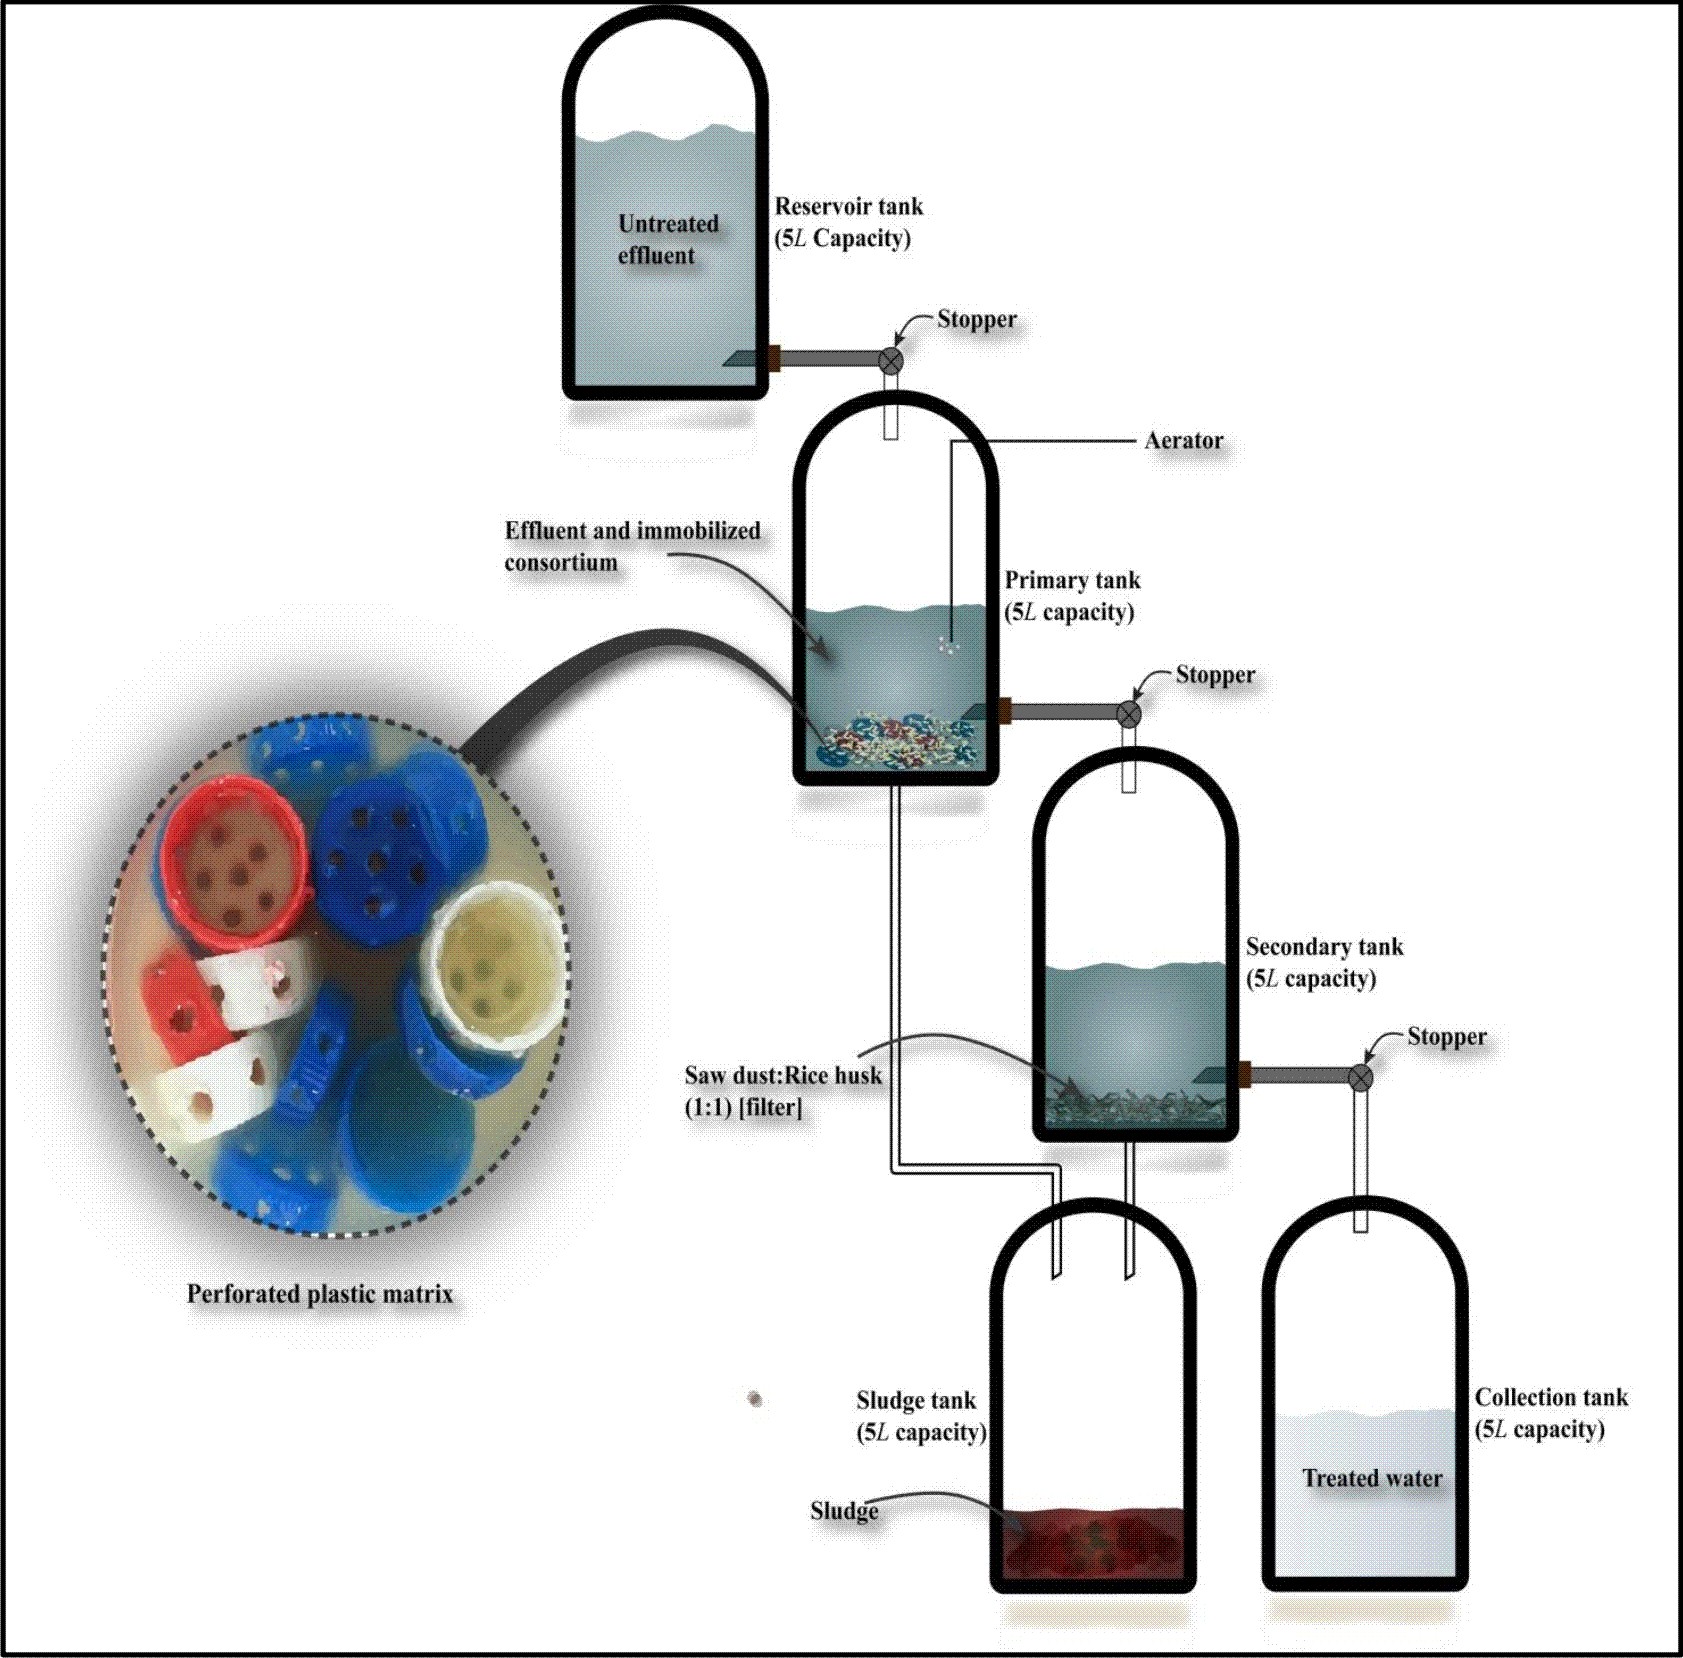
Fig. 1. Experimental set up of laboratory structured continuous scale aerobic bioreactor for the treatment of wastewater
At a time, 1000mL of effluent was allowed to pass from the reservoir through the regulated stopper at a flow rate of 3mLmin-1, 5mLmin-1 and 8mLmin-1. The primary tank was fed with 1000mL of untreated effluent, to which 50 bacteria-immobilized caps were added. Continuous aeration (through an assembly of aerator and diffusers) was provided to the effluent undergoing treatment in the primary tank. The effluent was given a retention time of 12h, 24h, 48h and 72h in the primary tank with continuous aeration wherein the immobilized consortium was allowed to carry out degradation.
After providing sufficient reaction time, aerators were switched off and the effluent was allowed to stand for an hour to settle down the sludge which was later on collected in the sludge tank and the treated effluent was allowed to flow to the secondary tank for filtration. The secondary tank, which was provided with one inch thick layer of adsorbent, i.e., 20g each of sawdust and rice husk, in the ratio of 1:1, at the bottom, was used for filtration. After filtration, the treated water was collected in the connected collection tank and tested for various physico-chemical parameters in the laboratory7,20,21. The performance of bioreactor is an important criterion for assessing its practicability in real time applications. The optimization studies were done to elucidate the dilution rate, working volume and residence time by the following equations given by El-Batal et al22

Where, D is the dilution rate which represents the momentous volume of the effluent to be filled per hour in the treatment tank; f is the flow rate, i.e., a volume of effluent flowing from one tank to the other per minute (mLmin-1) and V is the working volume (mL) or the actual volume of effluent being treated in the treatment tank, which can be calculated by the equation:
![]()
Where, V is the working volume (mL); r is the radius (cm) of the secondary or treatment tank and h is the height (cm) of the treatment tank.
The residence time, which is, the average duration of time for which the effluent spends in the treatment tank for its treatment, denoted by Tm, can be calculated by the following equation:

Table 1:
Physico-chemical characterization of the effluents
S.No. |
Parameters |
Effluent from Institutional STP (STP1) [Site I] |
Effluent from City STP
(STP2) [Site II] |
Permissible limit (by CPCB/WHO) |
|---|---|---|---|---|
1 |
pH |
7.68 |
7.80 |
6.5-7.5 |
2 |
Temperature (°C) |
37 |
37 |
35-37 |
3 |
Odour |
Pungent |
Pungent |
Odourless |
4 |
Colour |
Light grey |
Grey |
Colourless |
5 |
Electrical conductivity [EC] (mS/cm) |
2.21±0.02 |
2.3±0.1 |
0.6 |
6 |
Total dissolved solids [TDS] (mgL-1) |
902±1.08 |
1127±2.12 |
500 |
7 |
Total suspended solids [TSS] (mgL-1) |
65.086±0.05 |
74.048±0.16 |
200 |
8 |
Total solids [TS] (mgL-1) |
1202±0.5 |
1248±0.12 |
700 |
9 |
Total alkalinity [TA] (mgL-1) |
31.84±0.05 |
33.62±0.05 |
40 |
10 |
Turbidity (NTU) |
65.36±0.002 |
71.12±0.009 |
10 |
11 |
Total hardness [TH] (mgL-1) |
3990±0.24 |
4110±0.18 |
600 |
12 |
Calcium hardness (mgL-1) |
80±0.22 |
110±0.28 |
50 |
13 |
Dissolved oxygen [DO] (mgL-1) |
3±0.08 |
2±0.2 |
4-6 |
14 |
Biochemical Oxygen Demand [BOD] (mgL-1) |
56±1.5 |
90±1.8 |
30 |
15 |
Chemical Oxygen Demand [COD] (mgL-1) |
308±1.4 |
340±1.9 |
250 |
16 |
Sulphate (mgL-1) |
90±0.015 |
120±0.08 |
200 |
17 |
Phosphate (mgL-1) |
1.6±0.04 |
2.2±0.11 |
10 |
18 |
Total nitrogen (mgL-1) |
60±1.14 |
62±1.18 |
40 |
±Standard deviation; each value is a mean of three determinations
Statistical analysis
All the experiments were performed in triplicates and represented as mean± standard deviation. Further, the statistical analysis was done using ‘SPSS 16’ program.
Characterization of wastewater
The physico-chemical parameters of the untreated domestic effluent were evaluated following the standard protocols, as mentioned by APHA7 and was compared to the standard permissible limits given by CPCB/WHO, as given in Table 1. pH is the measure of hydrogen ion concentration in water and is thus the assessment of the water being acidic or alkaline in nature. In the present study, effluents were found to be slightly alkaline as the pH was 7.68 for Institutional and 7.80 for the city sample, respectively; the standard being 6.5-7.5. Temperature for both the samples was almost near to the standard value (35-37°C). Colour for STP1 sample was light grey and for STP2 sample was grey, visibly indicating poor water quality. Similarly, pungent smell of samples indicated release of harmful gases, leading to bad odour. Electrical conductivity (EC) is the ability of the water to carry electric current because of the presence of ions, thereby reducing its possibility for agricultural use.
EC values were 2.21±0.02mScm-1 and 2.3±0.1 mScm-1, for institutional and city samples, respectively; much beyond the standard limit. TDS values were 902±1.08mgL-1 and 1127±2.12 mgL-1 respectively, whereas TSS values were 65.086±0.05 mgL-1 and 74.048±0.16mgL-1 for STP1 and STP2 samples, respectively; but was within the expected standard limits. Hence, the Total Solids (TS) were found to be 1202±0.5 mgL-1 and 1248±0.12 mgL-1 for site I and site II samples, respectively; which was almost double to that prescribed in the standard limits. Total solids (suspended and dissolved) values indicate the nature of salinity of the wastewater. Total alkalinity indicates the level of carbonates and bicarbonates in water and its value was 31.84±0.05 mgL-1 and 33.62±0.05 mgL-1, for site I and site II samples, respectively, and was within the expected range. Turbidity is the measure of water clarity; that indicates the degree of light scattering by the suspended solids. Its values were 65.36±0.002NTU and 71.12±0.009NTU respectively, for the two samples, which was much higher than the standard level. Hardness (calcium and total) of water is due to the presence of calcium and magnesium in it. Its values were again much higher than the standard values, indicating a high content of calcium, magnesium, carbonate, bicarbonate and chloride ions. Dissolved oxygen (DO) values indicate the degree of pollution in the water bodies. The water quality is enhanced by the presence of DO, whereas, its values were found to be 3±0.08mgL-1 and 2±0.02mgL-1, for site I and site II samples, respectively. Biochemical oxygen demand (BOD) is the amount of oxygen needed by aerobic biological organisms to break down organic material present in a water sample at a certain temperature over a particular time period. Its values in the present samples were 56±1.5mgL-1 and 90±1.8mgL-1, respectively, higher than the expected standard values. Chemical oxygen demand (COD) is the amount of oxygen depleted on account of decomposition by microbes to a level detrimental to the aquatic life. Its values of both the samples were 308±1.4mgL-1 and 340±1.9mgL-1, respectively, which was higher than the expected standard limit of 250mgL-1. Total nitrogen was found to be above the expected range, however, sulphate and phosphate were much below the standard permissible limit.
Identification and characterization of the bacterial isolates
35 bacterial isolates were isolated and purified from the standard isolation procedure. Then, they were identified on the basis of physiology, morphology and biochemical assays. The isolates were analysed for their morphological parameters, covering colony colour, shape, size, margin elevation and edge and opacity. The strains were also tested for their gram nature by following the standard gram staining protocol15,16. The cell count was done by calculating the CFU (colony forming unit) per millilitre (mL) by counting the colonies grown on nutrient agar plates. The parameters studied are all summarised in Table 2. After the characteristic physiological and morphological analyses, the bacterial isolates were then characterized by biochemical tests, namely; amylase, cellulase, H2S, urease, citrate, methyl-red, voges-proskauer, gelatin, indole, carbohydrate catabolism, triple sugar iron, catalase and casein tests (Table 3).
Following the biochemical chara-cterization, the bacteria giving maximum positive results for the biochemical assays and showed better growth in the wastewater sample were chosen to be efficacious and used for consortia development. The selected bacteria were identified by following the Bergey’s manual17. The recognized bacteria were, namely, Bacillus species (B15), Achromobacter species (B24) and Comamonas species (B27).
The synergistic/antagonistic pattern of the prepared consortium
The consortium was developed for efficient and faster biodegradation of complex organic matter in the wastewater. The four selected bacteria were used to formulate four possible consortia with three bacterial strains in each consortium. To evaluate the compatibility of these four bacteria together, the growth of microbial cells in the consortia were checked in the nutrient broth by measuring optical density, OD600 nm (Table 4) as well as on nutrient agar plates (Fig. 2). As seen in Fig. 2(b), in Consortium 2, all the three bacterial strains showed no antagonistic phenomenon and grew well together in synergism, when incubated at 35°C for 48 hours16 as compared to consortia plates in Fig. 2(a), (c) and (d) in which all the constituting bacteria grew in an antagonistic manner.
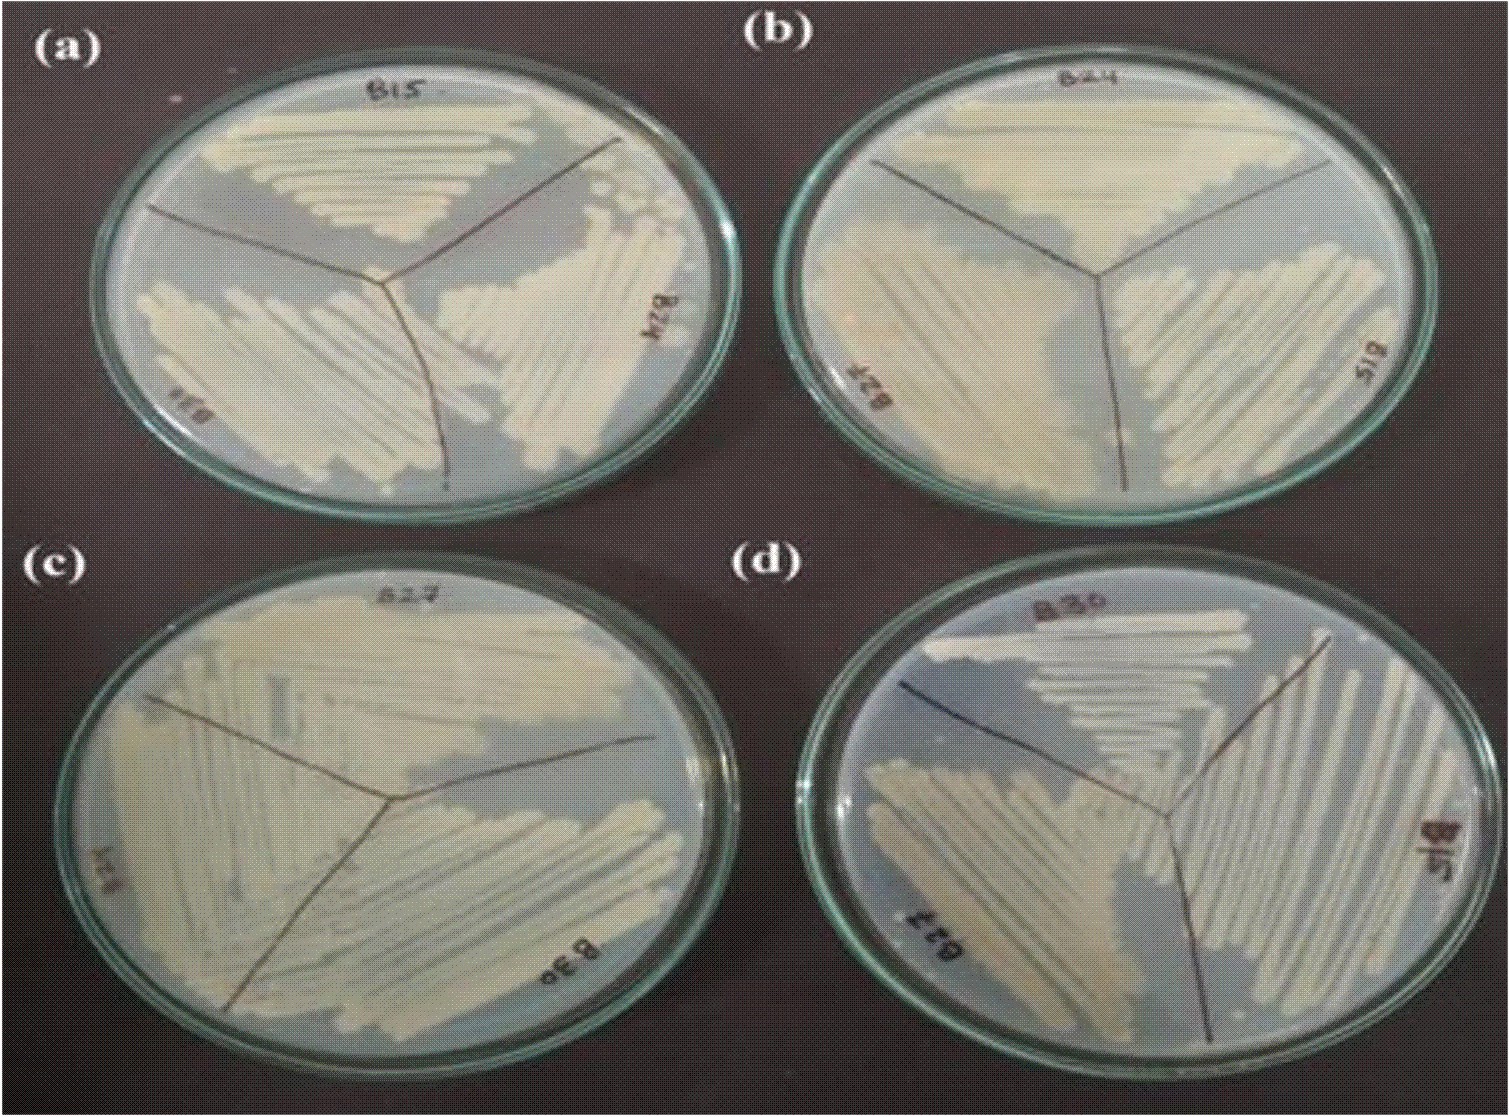
Fig. 2. Representation of prepared consortia on nutrient agar plates; (a) Consortium 1, (b) Consortium 2, (c) Consortium 3 and (d) Consortium 4
Table 2:
Morphological characteristics and growth parameters of the isolated bacteria
| S. No. | Isolated strains | Morphological characteristics | Gram nature | cfu (per ml) | Optical density (OD600 nm) in effluent
[after 24 hours] |
|||||
|---|---|---|---|---|---|---|---|---|---|---|
| colour | Shape | size | elevation | edge | opacity | |||||
| 1 | B1 | White | Circular | Medium | Convex | Smooth | Opaque | Gram negative | 1.201*109 | 0.585 |
| 2 | B2 | Cream | Circular | Medium | Flat | Smooth | Translucent | Gram positive | 1.209*109 | 0.582 |
| 3 | B3 | Cream | Circular | Medium | Raised | Smooth | Translucent | Gram positive | 1.218*109 | 0.751 |
| 4 | B4 | Light brown | Circular | Small | Flat | Smooth | Translucent | Gram positive | 1.246*109 | 0.765 |
| 5 | B5 | – | Circular | Pin-point | Flat | Smooth | Transparent | Gram positive | 1.213*109 | 0.351 |
| 6 | B6 | Cream | Irregular | Medium | Flat | Smooth | Translucent | Gram positive | 1.206*109 | 0.512 |
| 7 | B7 | Cream | Rhizoid | Medium | Raised | Undulating | Opaque | Gram negative | 1.211*109 | 0.434 |
| 8 | B8 | Cream | Circular | Small | Flat | Smooth | Translucent | Gram positive | 1.158*109 | 0.596 |
| 9 | B9 | Cream | Circular | Small | Flat | Smooth | Opaque | Gram positive | 1.109*109 | 0.572 |
| 10 | B10 | White | Irregular | Medium | Raised | Undulating | Opaque | Gram positive | 1.054*109 | 0.473 |
| 11 | B11 | Cream | Irregular | Medium | Flat | Smooth | Translucent | Gram positive | 1.019*109 | 0.511 |
| 12 | B12 | Brown | Irregular | Medium | Flat | Undulating | Opaque | Gram negative | 1.148*109 | 0.563 |
| 13 | B13 | – | Circular | Pin-point | Flat | Smooth | Transparent | Gram positive | 1.139*109 | 0.593 |
| 14 | B14 | Cream | Circular | Pin-point | Flat | Smooth | Translucent | Gram positive | 1.168*109 | 0.552 |
| 15 | B15 | Cream | Circular | Small | Flat | Smooth | Opaque | Gram positive | 1.328*109 | 0.944 |
| 16 | B16 | White | Irregular | Medium | Flat | Smooth | Translucent | Gram positive | 1.271*109 | 0.561 |
| 17 | B17 | Cream | Irregular | Small | Raised | Undulating | Translucent | Gram positive | 1.235*109 | 0.485 |
| 18 | B18 | White | Irregular | Medium | Raised | Smooth | Opaque | Gram negative | 1.197*109 | 0.533 |
| 19 | B19 | White | Irregular | Small | Raised | Undulating | Opaque | Gram positive | 1.187*109 | 0.572 |
| 20 | B20 | Cream | Circular | Pin-point | Flat | Smooth | Translucent | Gram positive | 1.147*109 | 0.581 |
| 21 | B21 | Cream | Circular | Pin-point | Flat | Smooth | Translucent | Gram positive | 1.152*109 | 0.398 |
| 22 | B22 | Cream | Irregular | Medium | Raised | Smooth | Opaque | Gram positive | 1.211*109 | 0.617 |
| 23 | B23 | – | Irregular | Pin-point | Flat | Smooth | Transparent | Gram positive | 1.216*109 | 0.541 |
| 24 | B24 | Cream | Circular | Small | Flat | Smooth | Opaque | Gram negative | 2.798*109 | 0.823 |
| 25 | B25 | – | Irregular | Medium | Flat | Undulating | Transparent | Gram positive | 1.141*109 | 0.319 |
| 26 | B26 | White | Circular | Small | Raised | Smooth | Translucent | Gram positive | 1.191*109 | 0.463 |
| 27 | B27 | Cream | Circular | Medium | Raised | Smooth | Translucent | Gram negative | 2.856*109 | 0.854 |
| 28 | B28 | Cream | Circular | Small | Flat | Undulating | Translucent | Gram positive | 1.258*109 | 0.282 |
| 29 | B29 | Cream | Circular | Small | Flat | Undulating | Translucent | Gram positive | 1.184*109 | 0.421 |
| 30 | B30 | Cream | Irregular | Large | Convex | Undulating | Opaque | Gram positive | 2.653*109 | 0.819 |
| 31 | B31 | Cream | Circular | Small | Raised | Smooth | Translucent | Gram positive | 1.416*109 | 0.518 |
| 32 | B32 | White | Circular | Small | Raised | Smooth | Translucent | Gram negative | 1.572*109 | 0.613 |
| 33 | B33 | Cream | Irregular | Medium | Flat | Undulating | Translucent | Gram positive | 1.191*109 | 0.482 |
| 34 | B34 | Yellow | Irregular | Medium | Flat | Smooth | Translucent | Gram positive | 1.269*109 | 0.622 |
| 35 | B35 | White | Circular | Pin-point | Raised | Smooth | Opaque | Gram positive | 1.269*109 | 0.643 |
SEM analysis for immobilization
The cross-section of the used plastic caps with and without immobilized bacterial consortium is shown in Fig. 3. The roughness of the surface of the caps was increased by forming small equal sized holes in them. As a result, the surface area was increased many-folds and thereby the immobilized consortium had increased reaction time on the effluent by enhanced growth. Differently shaped, constituting bacteria of the consortium was seen visibly in the SEM image, depicting the successful application of the plastic media for immobilization.
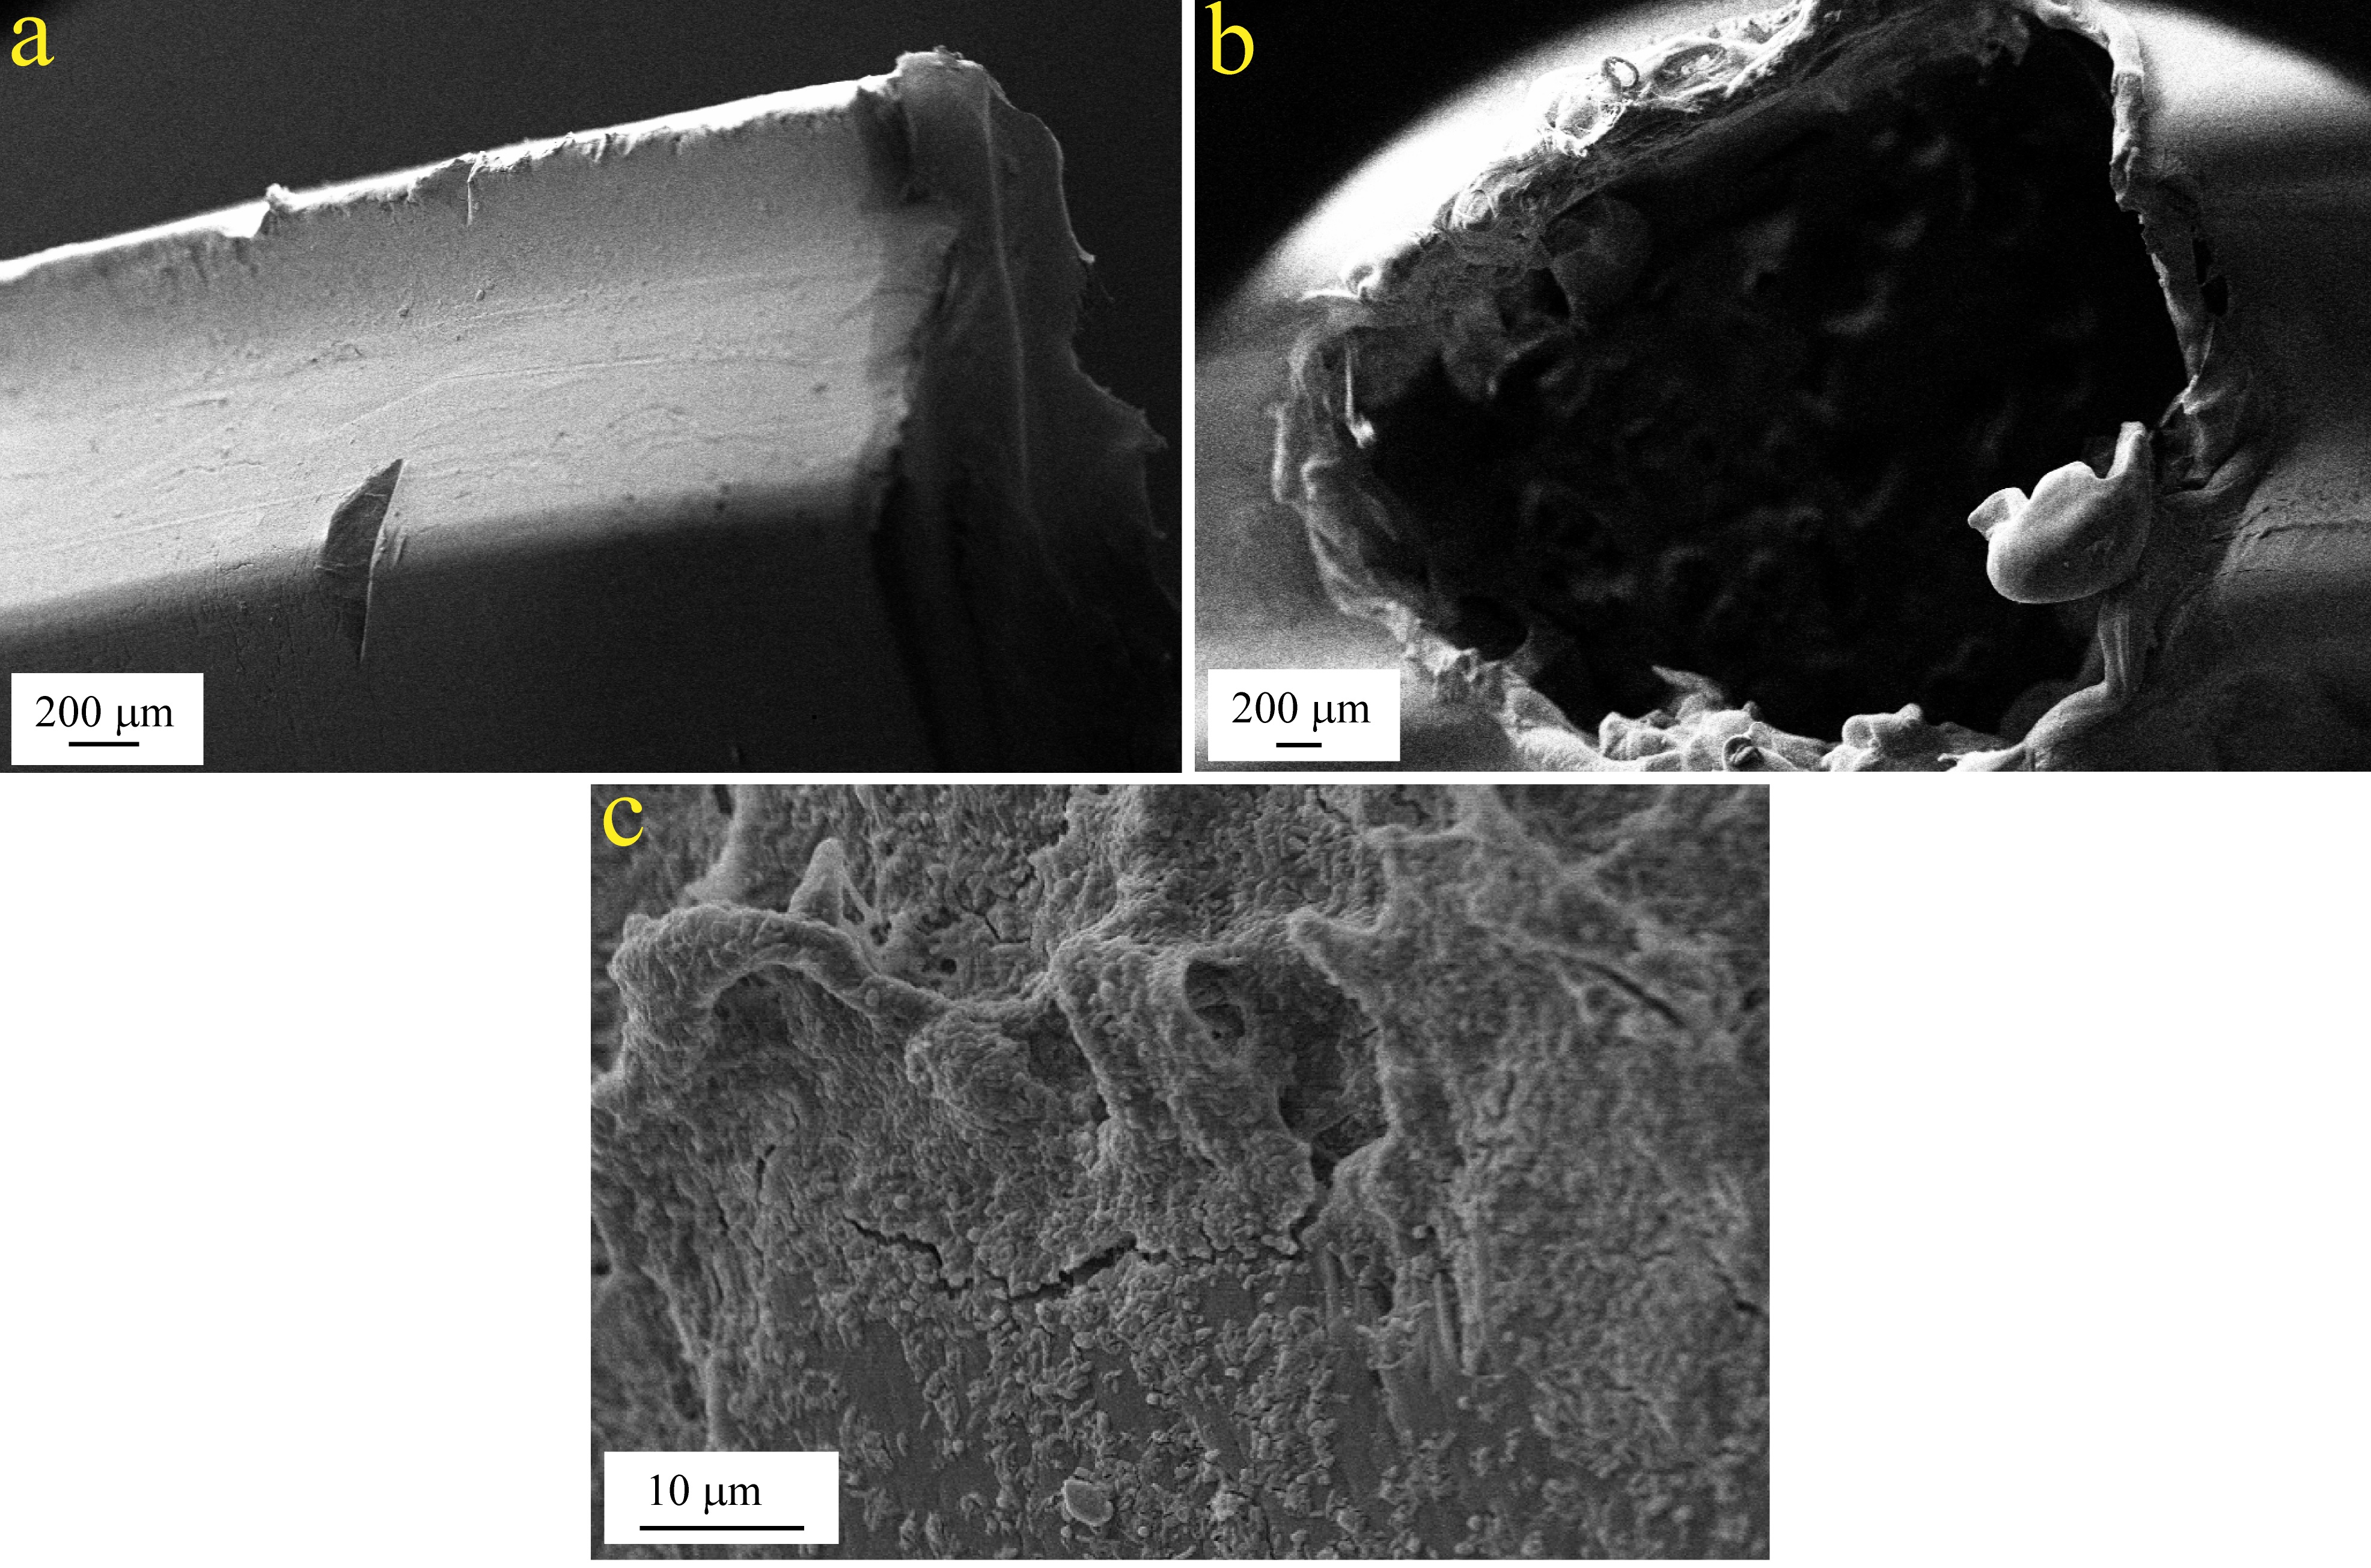
Fig. 3. SEM image of (a) plastic cap used for immobilization of consortium; (b) plastic cap with holes for enhanced immobilization and (c) immobilized consortium on the plastic caps.
Domestic effluent biodegradation analysis
In the present study, a closed and continuous laboratory scale bioreactor was developed, as illustrated in Fig. 1, firstly, for the growth of the developed consortium and then assessment of its biodegradation ability via the treatment of domestic effluent. The working experimental pH and temperature were noted as 7.4-7.5 and 37±5°C, respectively which were required for the optimum functioning of the bioreactor. Furthermore, optimization studies were done for flow rate and hydraulic retention time, as outlined in Table 5. Flow rate of 3, 5 and 8 mLmin-1, respectively were applied and were assessed for optimization on the basis of reduction in BOD and COD values. 3mLmin-1 of flow rate was less for the treatment process, however, could reduce much BOD and COD values, whereas, 8 mLmin-1 of flow rate was higher and thus was not able to remediate the water efficiently. 5mLmin-1 was found to have reduced the BOD and COD parameters sufficient to be applied in the bioreactor, hence was chosen. The hydraulic retention time optimization study was also done similarly on the basis of reduction in water quality parameters. Out of 12, 24, 48 and 72 hours of time provided for treatment of wastewater, 48 hours was selected as the optimum time needed for the appropriate treatment of water, accounting to the maximum reduction in BOD and COD values. 72 hours reduced the BOD and COD but were almost as much as reduced in 48 hours. Hence, 48hours retention time was chosen for time-consuming treatment.
Table 3:
Biochemical characterization of the isolated strains
Isolated strains |
Amy |
Cel |
H2S |
Ure |
Cit |
MR |
VP |
Gel |
Ind |
Carb |
TSI |
Cat |
Cas |
|---|---|---|---|---|---|---|---|---|---|---|---|---|---|
B1 |
+ |
– |
+++ |
– |
++ |
– |
+ |
+ |
++ |
+ |
Glu (+) |
– |
– |
B2 |
– |
– |
– |
– |
– |
– |
+ |
+ |
– |
+ |
Glu (+) Lac (+) |
– |
+ |
B3 |
++ |
– |
+++ |
– |
++ |
– |
+ |
– |
– |
+ |
Glu (+) Lac (+) |
– |
+ |
B4 |
++ |
– |
– |
– |
+ |
+ |
– |
+ |
– |
+ |
Glu (+) Lac (+) |
– |
+ |
B5 |
++ |
– |
– |
+ |
– |
+ |
– |
– |
++ |
– |
Glu (+) H2S (+) |
+ |
+ |
B6 |
+ |
– |
++ |
– |
++ |
+ |
– |
+ |
– |
– |
Glu (+) Lac (+) |
– |
+ |
B7 |
– |
– |
+++ |
– |
+ |
– |
+ |
+ |
– |
+ |
Glu (+) |
– |
+ |
B8 |
– |
+ |
– |
++ |
++ |
– |
+ |
+ |
– |
– |
Glu (+) Lac (+) |
– |
+ |
B9 |
– |
– |
+ |
++ |
– |
– |
+ |
+ |
– |
+ |
Glu (+) |
– |
+ |
B10 |
+ |
– |
+++ |
– |
++ |
+ |
– |
– |
– |
+ |
Glu (+) |
– |
+ |
B11 |
++ |
– |
– |
– |
– |
– |
+ |
– |
+ |
+ |
Glu (+) Lac (+) |
– |
+ |
B12 |
– |
+ |
– |
– |
+ |
– |
– |
+ |
– |
– |
– |
+ |
+ |
B13 |
+++ |
– |
– |
– |
– |
+ |
– |
– |
– |
+ |
Glu (+) |
– |
+ |
B14 |
– |
+ |
+++ |
++ |
++ |
– |
+ |
+ |
+ |
+ |
Glu (+) Lac (+) |
– |
– |
B15 |
+++ |
– |
++ |
– |
+++ |
– |
+ |
++ |
++ |
– |
Glu (+) |
+ |
+ |
B16 |
++ |
– |
+ |
+++ |
+ |
– |
+ |
– |
++ |
– |
Glu (+) H2S (+) |
– |
+ |
B17 |
+ |
– |
– |
+++ |
+ |
+ |
– |
– |
– |
+ |
Glu (+) |
– |
+ |
B18 |
– |
– |
+ |
++ |
+ |
+ |
– |
+ |
+ |
+ |
Glu (+) Lac (+) |
– |
+ |
B19 |
++ |
– |
+ |
– |
– |
+ |
– |
– |
– |
– |
Glu (+) |
– |
+ |
B20 |
– |
– |
+ |
++ |
++ |
– |
+ |
+ |
+ |
+ |
Glu (+) |
+ |
– |
B21 |
+ |
– |
+ |
++ |
++ |
+ |
– |
+ |
– |
+ |
Glu (+) H2S (+) |
– |
– |
B22 |
– |
– |
+++ |
– |
– |
– |
+ |
– |
– |
+ |
Glu (+) Lac (+) |
– |
+ |
B23 |
– |
– |
+++ |
++ |
++ |
– |
+ |
– |
– |
+ |
Glu (+) H2S (+) |
– |
+ |
B24 |
– |
– |
++ |
– |
+ |
++ |
– |
– |
++ |
++ |
Glu (+) |
+ |
+ |
B25 |
+ |
– |
++ |
– |
+ |
++ |
– |
+ |
– |
– |
Glu (+) |
+ |
+ |
B26 |
– |
– |
++ |
– |
– |
– |
+ |
+ |
– |
– |
Glu (+) Lac (+) |
– |
– |
B27 |
+ |
+ |
++ |
+ |
+ |
++ |
– |
+ |
+ |
+ |
Glu (+) Lac (+) |
+ |
+ |
B28 |
+ |
– |
++ |
+ |
+ |
+ |
– |
+ |
+ |
– |
Glu (+) Lac (+) |
– |
+ |
B29 |
– |
– |
++ |
– |
– |
– |
+ |
+ |
– |
– |
Glu (+) Lac (+) |
+ |
– |
B30 |
– |
– |
++ |
– |
– |
– |
+ |
+ |
– |
++ |
– |
– |
– |
B31 |
+ |
– |
++ |
– |
– |
+ |
– |
+ |
– |
– |
Glu (+) Lac (+) |
– |
+ |
B32 |
– |
– |
++ |
– |
– |
– |
++ |
+ |
– |
– |
Glu (+) Lac (+) |
– |
+ |
B33 |
+ |
– |
++ |
– |
+ |
++ |
– |
+ |
+ |
+ |
Glu (+) Lac (+) |
– |
+ |
B34 |
– |
– |
++ |
+ |
– |
– |
+ |
+ |
– |
– |
Glu (+) |
+ |
– |
B35 |
+ |
– |
++ |
– |
– |
+ |
– |
+ |
– |
– |
Glu (+) Lac (+) |
+ |
+ |
(Amy-Amylase test, Cel-Cellulase test, H2S-Hydrogen sulphide test, Ure-Urease test, Cit-Citrate test, MR-Methyl Red test, VP-Voges-Proskauer test, Gel-Gelatin test, Ind-Indole test, Carb-Carbohydrate catabolism test, TSI-Triple sugar iron test, Cat-Catalse test, Cas-Casein test.
Glu-Glucose, Lac-Lactose; + Low activity++; Moderate activity+++; Maximum activity;- No activity)
Table 4:
Bacterial consortia composition and their growth in effluent
Consortia |
Constituting bacterial isolates |
Optical density (OD600 nm) in effluent
[after 24 hours] |
|---|---|---|
Consortium 1 |
B15, B24, B30 |
0.428 *2 (D.F.) |
Consortium 2 |
B15, B24, B27 |
0.817*2 (D.F.) |
Consortium 3 |
B24, B27, B30 |
0.728*2 (D.F.) |
Consortium 4 |
B15, B27, B30 |
0.698*2 (D.F.) |
Hence, with a regulated and optimized flow rate of 5mLmin-1, about 1420mL of the working volume of wastewater in the primary tank was treated by the immobilized and exponentially grown consortium with a residence time of 4.76h. Thus, after about 6 hours of incubation time in the primary tank, the water was passed to the secondary tank, wherein the water was filtered through an inch thick layer of sawdust: rice husk (1:1) which provided the final filtration and cleaning of the wastewater before the collection. Also, after the treatment and filtration processes, some amount of settled sludge was collected in the sludge tank and finally the colourless, odourless and detoxified water was collected in the collection tank. Table 6 summarizes the effluent biodegradation parameters analysed before and after the treatment by the immobilized consortium 2 in the laboratory scale bioreactor. The effective treatment of the effluent by immobilized consortium 2 is justified by the synergistic action of the combined metabolic activities and interactions of the constituting strains in the consortium.
Table 5:
Effect of flow rate and hydraulic retention time in the bioreactor for effluent treatment
| Institutional STP sample (STP1) | ||||||||
|---|---|---|---|---|---|---|---|---|
| Parameters
(mgL-1) |
Permissible limit (by CPCB/WHO) | Flow rate (mLmin-1) | Hydraulic retention time (h) | |||||
| 3 | 5 | 8 | 12 | 24 | 48 | 72 | ||
| BOD | 30 | 18 | 20 | 27 | 28 | 24 | 20 | 19 |
| COD | 250 | 228 | 230 | 241 | 245 | 238 | 230 | 229 |
|
City STP sample (STP2) |
||||||||
| BOD | 30 | 25 | 26 | 28 | 28 | 27 | 26 | 25 |
| COD | 250 | 240 | 242 | 247 | 248 | 246 | 242
|
241 |
After 48h of treatment, physico-chemical parameters were determined and were found to have reduced drastically. pH was shifted from alkaline to close to neutral values for both STP1 and STP2 samples. Reduction in electrical conductivity values in both the samples after primary treatment and filtration were associated with the use of ions by the consortium bacteria for their growth and further was adsorbed by the mixture of sawdust and rice husk during the filtration. The presence of total dissolved and suspended solids indicated a large amount of organic and inorganic matter present in the effluent, however, after the treatment, there was a huge reduction in these parameters which would be due to the use of organic matter by the bacteria for their growth and adsorption of the remaining on sawdust and rice husk mixture. Reduction in the turbidity values, biochemical oxygen demand (BOD) and chemical oxygen demand (COD), which are widely used as significant indicators of water quality, were clearly in justification with the fact that the bacteria consumed most of the organic matter and suspended particles for their growth and survival and thus lead to the reduction in these parameters. These vital measurements are important parameters for evaluating the suitability and practicality of the effluent for irrigation purpose. Reduction in the hardness values could possibly be due to filtration, helping in the removal of various ions like calcium, magnesium and others like sulphate, phosphate and nitrogen.
Table 6:
Physico-chemical characterization of the effluents after treatment in the bioreactor
| S.No. | Parameters | Institutional effluent
(STP1) |
City effluent
(STP2) |
Permissible limit (by CPCB/WHO) | ||
|---|---|---|---|---|---|---|
| Before treatment | After treatment | Before treatment | After treatment | |||
| 1 | pH | 7.68 | 7.4 | 7.80 | 7.46 | 6.5-7.5 |
| 2 | Temperature (°C) | 37 | 36 | 37 | 36 | 35-37 |
| 3 | Odour | Pungent | Odourless | Pungent | Odourless | Odourless |
| 4 | Colour | Light grey | Colourless | Grey | Colourless | Colourless |
| 5 | Electrical conductivity [EC] (mS/cm) | 2.21±0.02 | 0.41±0.01 | 2.3±0.1 | 0.5±0.02 | 0.6 |
| 6 | Total dissolved solids [TDS] (mgL-1) | 902±1.08 | 463±1.08 | 1127±2.12 | 488±1.01 | 500 |
| 7 | Total suspended solids [TSS] (mgL-1) | 65.086±0.05 | 60.12±0.08 | 74.048±0.16 | 70.08±1.01 | 200 |
| 8 | Total solids [TS] (mgL-1) | 1202±0.5 | 530±0.04 | 1248±0.12 | 572±0.02 | 700 |
| 9 | Total alkalinity [TA] (mgL-1) | 31.84±0.05 | 27.04±0.04 | 33.62±0.05 | 30.15±0.09 | 40 |
| 10 | Turbidity (NTU) | 38.36±0.002 | 8.09±0.08 | 51.12±0.009 | 9.15±0.04 | 10 |
| 11 | Total hardness [TH] (mgL-1) | 3990±0.24 | 581±1.11 | 4110±0.18 | 592±1.04 | 600 |
| 12 | Calcium hardness (mgL-1) | 80±0.22 | 45±0.42 | 110±0.28 | 48±0.12 | 50 |
| 13 | Dissolved oxygen [DO] (mgL-1) | 3±0.08 | 6±0.04 | 2±0.2 | 5±0.03 | 4-6 |
| 14 | Biochemical Oxygen Demand [BOD] (mgL-1) | 56±1.5 | 20±0.52 | 90±1.8 | 26±0.14 | 30 |
| 15 | Chemical Oxygen Demand [COD] (mgL-1) | 308±1.4 | 230±0.07 | 340±1.9 | 242±0.09 | 250 |
| 16 | Sulphate (mgL-1) | 90±0.015 | 72±0.32 | 120±0.08 | 102±0.22 | 200 |
| 17 | Phosphate (mgL-1) | 1.6±0.04 | 1.1±0.42 | 2.2±0.11 | 1.8±1.82 | 10 |
| 18 | Total nitrogen (mgL-1) | 60±1.14 | 30±1.82 | 62±1.18 | 32±1.67 | 40 |
The present study exhibited that biodegradation of domestic wastewater can be achieved in a better, enhanced and rapid manner by incorporation of the consortium comprising of highly efficient <em>Bacillus species, Achromobacter species and Comamonas species.</em> Moreover, the consortium when immobilized on the plastic matrix that has never been used before, as per our knowledge, escalated the biodegradation efficiency manifold. The treated wastewater quality analysis depicted an increase in DO and reduction in BOD and COD values in addition to decrease in various other parameters; leading to the successful use and application of the assembled bioreactor with the bioaugmented immobilized consortium, which accelerated the entire degradation process and was successful in treating a large volume of institutional as well as city STP wastewater samples.
We are thankful to Amity University, Noida, Uttar Pradesh for all the scientific support provided throughout this study.
The authors declare that they have no conflict of interest in the publication.
- Wang Y K, Sheng G P, Shi B J, Li W W, Yu H Q. A novel electrochemical membrane bioreactor as a potential net energy producer for sustainable wastewater treatment. Scientific reports, 2013; 21(3): 1864.
- Malathi S, Thippeswamy S. Temporal variability of water quality parameters in Sita river, tributary of river Tunga, from the Krishna river basin in Western Ghats, India: Application of principal component analysis. J. Water Res. Photon, 2013; 135: 161-174.
- Murty M N, Kumar S. Water Pollution in India: An Economic Appraisal. India infrastructure report, 2011; 19: 285-298 .
- Kushwah R K, Bajpai A, Malik S. Wastewater Quality Studies of Influent and Effluent Water at Municipal Waste-water Treatment plant, Bhopal (India). Int J Chem, Env Pharma Res, 2011; 2(2-3): 131-134.
- NA S, Mungal N A, Kamble S P. Study of physico-chemical characteristics of domestic wastewater in Vishnupuri, Nanded, India. Int J Cur. Microbiol. App Sci, 2015; 4(1): 533-536.
- Monica S, Karthik L, Mythili S, Sathiavelu A. Formulation of effective microbial consortia and its application for sewage treatment. J. Microbial & Biochem Technol, 2011; 3: 051-055.
- APHA. Standard Methods for the Examination of Water and Wastewater. 18th ed. American Public Health Association, Washington, D.C, 1992.
- Kushwah R K, Bajpai A, Malik S. Characteristics of waste water in sewage treatment plant of BHOPAL, (India). J Chem Pharm Res, 2011; 3(6): 766-771.
- Manju G N, Raji C, Anirudhan T S. Evaluation of coconut husk carbon for the removal of arsenic from water. Water Res, 1998; 32(10): 3062-3070.
- Poots V J P, McKay G, Healy J J. Removal of basic dye from effluent using wood as an adsorbent. Journal (Water Pollution Control Federation), 1978; 926-935.
- Joel O F, Akinde B S, Nwokoye C U. Determination of Some Physicochemical and Microbiological Characteristics of Sewage Samples from Domestic, House-boat and Off-shore Facilities Discharge Point. J Appl Sci Env Management, 2009; 13(3).
- Dhall P, Kumar R, Kumar A. Biodegradation of sewage wastewater using auto-chthonous bacteria. The Scientific World Journal, 2012.
- Safitri R, Priadie B, Hawadish A. Domestic waste water bioremediation by consortium of bacteria. Abstrak, 2015.
- Lee J, Cho M H. Removal of nitrogen in wastewater by polyvinyl alcohol (PVA)-immobilization of effective micro-organisms. Korean J chem eng, 2010; 27(1): 193-197.
- Srivastava A K, Gupta A K, Mehrotra T, Choudhury R, Singh R. Physicochemical, Biochemical and Statistical Analysis of Beverages Industry Effluent. Res. J. Pharma. Technol., 2016; 9(7): 887.
- Srivastava, A. K., Rana, S. V., Mehrotra, T., & Singh, R. Characterization and immo-bilization of bacterial consortium for its application in degradation of dairy effluent. J. Pure. Appl. Microbiol., 2016; 10(3): 2199-2209.
- Holt, J. G., Williams, S. T., & Holt. Bergey’s manual of systematic bacteriology, Lippincott Williams & Wilkins, 1989; 4.
- Krishna K R, Philip L. Bioremediation of Cr(VI) incontaminated soils. J. Hazard Mater, 2005; 121(1-3): 109–117.
- Arumugam A, Sabarethinam P L, Performance of a three-phase fluidized bed reactor with different support particles in treatment of dairy wastewater. ARPN J. Eng. Appl. Sci., 2008; 3(5): 42–44.
- Porwal H J, Mane A V, Velhal S G. Biodegradation of dairy effluent by using microbial isolates obtained from activated sludge. Water Resources and Industry, 2015; 9: 1-15.
- Mian H R, Haydar S, Hussain G. Optimization of sequencing batch reactor for wastewater treatment using chemically enhanced primary treatment as a pre-treatment. Water SA, 2018; 44(3): 399-405.
- El-Batal A I, Hassan A M, Hassan M S, Helal A H. Removal of dyes fromtextile wastewater using treated Aspergillus tamarii biomass in batch and column reactor. World Appl. Sci. J., 2012; 19(9): 1305–1310.
© The Author(s) 2019. Open Access. This article is distributed under the terms of the Creative Commons Attribution 4.0 International License which permits unrestricted use, sharing, distribution, and reproduction in any medium, provided you give appropriate credit to the original author(s) and the source, provide a link to the Creative Commons license, and indicate if changes were made.