

ISSN: 0973-7510
E-ISSN: 2581-690X
Aditya Chaudhary1![]() , Khushbu Verma1
, Khushbu Verma1 ![]() and Baljeet Singh Saharan2
and Baljeet Singh Saharan2![]()
A GC-MS based metabolic profiling was carried out to study metabolic differences of lactic acid bacteria isolated from different food sources. Metabolic fingerprinting is a non-targeted procedure where all detectable peaks are considered to establish sample classification. A total of 40 compounds were identified as major metabolites contributing to the difference among five different probiotic lactic acid bacteria. Some of the metabolites identified in this study have been reported as a defrosting agent, antioxidant, flavour agent, antimicrobial, natural food additive, anti-inflammatory, anti-sleep disorder agent and anti-cancer agents. These results suggest that GC-MS based metabolomic analysis is a useful tool to facilitate future investigations into the characterization of probiotic lactic acid bacteria.
Lactic acid bacteria, metabolic profiling, GC-MS, traditional food products, probiotics.
Lactobacillus and Pediococcus is a gram-positive facultative anaerobic bacterium found widely in fermented food products and can be investigated for the metabolites present in them by GC-MS based metabolic profiling.
Metabolic fingerprinting is explained as the semi-quantitative investigation of extracellular (exo-metabolome) and intracellular (endo- metabolome) metabolites, respectively (Villas-Boas et al., 2005). These metabolic profiles GC-MS has consistently been the most favoured analytical technique for the analysis of metabolites present in distinct biological samples. Gas chromatography and mass spectrophotometry (GC-MS) present the high chromatographic resolution ascribed to the high sensitivity and specificity of mass spectrophotometry (Villas-Boas et al., 2005). In comparison with other techniques, GC-MS can produce a comparably high reproducibility, high resolution, high-quality sensitivity, and good- throughput analysis, which can be used for analyzing the metabolic products, inclusive of carbohydrates, fatty acids, organic acids, and amino acids (Park et al., 2016). Derivatization is necessary before the investigation by GC-MS as most of the metabolites are non-volatile (Schummer et al., 2009). Nowadays, most adaptable derivatization technique is silylation, which has the ability to derivatize compounds having polar functional groups by mixing TMS (Trimethylsilyl) reagent to develop TMS Compounds (Nordström A, 2004). However, for the study of different biological metabolic fingerprinting, N, O-bis (trimethylsilyl) trifluoroacetamide with 1% trimethylchlorosilane is generally used as silylation reagent and derivatization method with GC-MS (Alreshidi et al., 2015; Li et al., 2013). For the study of metabolites in the microbial sample, derivatization based GC-MS technique can be applied to identify the intracellular as well as extracellular metabolites of Lactobacillus and Pediococcus species.
Liquid injection GC-MS provides an inexpensive and simple option for the analysis of metabolites produced by probiotic lactic acid bacteria. As the concentration of metabolites varies widely in different probiotic lactic acid bacteria, it is required to develop the analytical plan that would permit concurrent quantification of them in a single run utilizing comparably a small amount of sample along with minimum sample preparation. GC-MS has high sensitivity and hence can be used for the investigation of less common samples that might only be available in minute quantity. In this study, direct-injection GC-MS methodology was used for the profiling of different metabolites, which has the high specificity of mass spectrometry along with the high reproducibility and high resolution of gas chromatography.
The results of this study provide reference data for interpreting the differences in the metabolite profiles of different probiotic lactic acid bacteria isolated from different food sources.
Collection of food samples
Food items viz. Dosa batter, jalebi batter, maida dough, sauerkraut and soymilk were used in this experiment. Dosa batter, Jalebi batter, Soymilk were collected from a local market in New Delhi, India. Maida dough and Sauerkraut were prepared at home. The food samples were taken in a sterilized bag and stored at -4° until use.
Strain isolation
1 g or 1 ml of food sample were added into 9 ml of 0.85% (w/v) normal saline. After homogenization, serial dilutions were prepared upto 10-9 with 0.85% (w/v) normal saline and 0.1 ml decimal of appropriate dilutions were plated onto de Man, Rogosa, Sharpe (MRS) agar medium (Himedia, India) (de Man et al., 1960). The agar plates were incubated at 35° for 24 h under anaerobiosis. Morphologically different colonies were picked and re-streaked onto MRS agar plates up to purity. Glycerol stocks of strains were preserved at -20°.
Probiotic Lactic Acid Bacteria
L. plantarum DB-2, L. fermentum J-1, P. acidilactici M-3, L. plantarum SK-3 and P. pentosaceus SM-2 were isolated from Dosa batter, Jalebi batter, Maida dough, Sauerkraut, and Soymilk and were identified in own previous studies with NCBI accession no. MK246169, MK353735, MK461878, MK246167 and MK461882 respectively (Chaudhary and Saharan, 2019) (Table 1). Probiotic attributes such as acid tolerance (Liong and Shah, 2005), bile tolerance (Walker and Gilliland, 1993), antibiotic susceptibility (Thirabunyanon et al., 2009), hemolytic activity (Harrigan, 1998), gelatinase activity (Harrigan, 1990), autoaggregation (Del Re et al., 2000), co-aggregation studies (Del Re et al., 2000), hydrophobicity (Rosenberg et al., 1980), bacteriocin production (Papagianni and Anastasiadou, 2009), lactic acid and hydrogen peroxide production (AOAC, 1995), exopolysaccharide production (Mora et al., 2002) were studied on all the five isolates. Bacterial isolates were identified at the genomic level by using 16 S rRNA gene technique (Hashem et al., 2010; Bollag and Edelstein, 1991).
Table (1):
Genotyping of screened lactic acid bacterial strains.
Name of isolate |
Source |
Identity (%) |
16S r RNA identification |
Accession number |
|---|---|---|---|---|
DB-2 |
Dosa Batter |
99 |
Lactobacillus plantarum |
MK246169 |
J-1 |
Jalebi batter |
99 |
Lactobacillus fermentum |
MK353735 |
M-3 |
Maida dough |
97 |
Pediococcus acidilactici |
MK461878 |
SK-3 |
Sauerkraut |
100 |
Lactobacillus plantarum |
MK246167 |
SM-2 |
Soymilk |
99 |
Pediococcus pentosaceus |
MK461882 |
Metabolic fingerprinting
Metabolites were extracted by following the method given by Coucheney et al. (2008) with minor modifications.
Sampling for metabolic fingerprinting
Microbial suspensions (20 ml) of isolate (grown in MRS broth for 24 h at 35°C) were disrupted using pulsed, high-frequency sound waves (>20kHz) for five cycles (30 sec. run; one min break) to extract intracellular metabolites. Suspensions procured after sonication were centrifuged for 10 min at 10,000 rpm in order to segregate the extra as well as intracellular metabolites from the cells.
Extraction for metabolic fingerprinting
The supernatant was removed and the metabolites were extracted with a Methanol: Water: Chloroform mixture (2: 0.8: 1): 2.5 ml of cold chloroform and 5 ml of cold methanol (-20°C) and the phases were allowed to separate. Metabolic fingerprints were assessed in the aqueous phase after freeze-drying while in the organic phase, the dried chemical extracts obtained after complete evaporation of the solvent was used.
Generation of metabolic fingerprints and data processing
Derivatization of dried samples
The derivatization method given by Mastrangelo et al. (2015) and Park et al. (2019) was used in this study for the evaluation of metabolic fingerprinting. The freeze-dried samples and dried chemical extracts were methoxymated using methoxyamine in pyridine solution and trimethylsilylated by BSTFA (N,O-Bis(trimethylsilyl)trifluoroacetamide) with 1 % chlorotrimethylsilane (TMCS).
GC-MS analysis
Derivatives from Lactobacillus and Pediococcus strains were analysed using Thermo Trace 1300GC coupled with Thermo TSQ 800 Triple Quadrupole MS (Pogacic et al., 2015). Six-microlitre aliquots were injected in splitless mode. The samples were warmed to 65°C for 15 min and the metabolites were extracted before being adsorbed on the trap at 35°C. The trap was heated at 250°C for 0.1 min, leading to desorption of the metabolites. Metabolites were then separated on TG 5MS column (30m X 0.25mm, 0.25µm thickness) with column makeup of 5% diphenyl; 95% dimethyl polysiloxane. The temperature of the oven was initially 50°C, maintained for 3 min. The temperature was increased at 15°C/min to 220°C. The mass spectrometer was operated in the scan mode within a mass range of m/z 30 to 700. The quadruple mass spectrophotometry parameters were set to the conditions: ion source temperature of 230°C, split flow of 40 ml/min, carrier flow of 1.5 ml/ min, injector temperature and MS transfer line temperature of 250°C. Ionization was done by electronic impact at 70 eV. All samples were analysed in the same GC-MS and injected in a randomized order over the GC-MS run. Blank samples (boiled deionized water) were injected after every sample to verify the instrumental carryover.
Data pre-processing and data analysis
The GC-MS raw data files were converted to netCDF format. Further, the raw data were processed to time- and mass- aligned chromatographic peak areas with the XCalibur 2.2SP1 with Foundation 2.0SP1. Metabolites were identified by comparison of mass spectra and retention times with those of authentic standards from NIST 2.0 Mass Spectral Library (Mastrangelo et al., 2015).
Metabolic fingerprinting
The exo- and endo-metabolites of probiotic isolates in culture supernatant provides a window for explaining the comprehensive nature of metabolites. The metabolite profiling provides information about the nutritional as well as of toxic effects, if any of metabolites on the interactive effects of the dietary components on the health of the gut of the host.
In total, 40 metabolites were detected from the culture supernatants of these five isolates. Out of 40 compounds obtained in the solvent phase, only 17 compounds viz. Isopropyl alcohol; L-lactic acid; 2-Propanol, 1-hydrazino; Decane; Benzaldehyde, 2,4, dimethyl; Dodecane; Tetradecane; Phenol, 2,4 bis (1,1 dimethylethyl); Hexadecane, 2,6,11,15 tetramethyl; Hexadecane; Geranyl isovalerate; Pyrrolo [1,2a] pyrazine 1,4 dione, hexahydro 3 (2 methylpropyl); n-Hexadeconic acid; 9 Octadecenamide, (Z); Benzoic acid; Undecane; Dodecanoic acid were common to all the tested isolates as described in Table 2. Out of 17 compounds, Isopropyl alcohol; Dodecane, Hexadecane, Tetradecane and Pyrrolo [1,2a] pyrazine 1,4 dione, hexahydro 3 (2 methylpropyl); Benzaldehyde, 2,4, dimethyl and Geranyl isovalerate; Phenol, 2,4 bis (1,1 dimethylethyl); Hexadecane, 2,6,11,15 tetramethyl; n-Hexadeconic acid; 9 Octadecenamide, (Z), have been reported as defrosting agent, antioxidant, flavour agent, antimicrobial, natural food additive, anti-inflammatory, anti-sleep disorder agent, respectively (Bharat et al., 2013).
Table (2):
Metabolic profile of biocomponents identified in solvent extract of probiotic lactic acid bacteria isolated by GC-MS.
S.No |
Compound |
Five isolates |
Four isolates |
Three isolates |
Two isolates |
One isolate |
|---|---|---|---|---|---|---|
1 |
Acetic acid, anhydride with formic acid |
■ |
||||
2 |
4-amino-1-butanol |
■ |
||||
3 |
Benzaldehyde,2,4,dimethyl |
■■■■■ |
||||
4 |
Benzoic acid |
■■■■■ |
||||
5 |
Decane |
■■■■■ |
||||
6 |
DL-2,3-Butanediol |
■■ |
||||
7 |
Dodecane |
■■■■■ |
||||
8 |
Dodecanoic acid |
■■■■■ |
||||
9 |
Eicosanoic acid |
■■■ |
||||
10 |
Ethanamine, 2-propoxy- |
■■ |
||||
11 |
Ethanol, 2-(2-propenyloxy) |
■■ |
||||
12 |
2-Ethoxyethylamine |
■ |
||||
13 |
Ethylamine |
■ |
||||
14 |
Formamide |
■ |
||||
15 |
Geranyl isovalerate |
■■■■■ |
||||
16 |
Hexadecane |
■■■■■ |
||||
17 |
Hexadecane,2,6,11,15 tetramethyl |
■■■■■ |
||||
18 |
n-hexadecanoic acid |
■■■■■ |
||||
19 |
2-Hydrazino ethanol |
■■■ |
||||
20 |
Hydroperoxide, heptyl |
■ |
||||
21 |
Hydroperoxide, 1-methylhexyl |
■ |
||||
22 |
Hydroperoxide, pentyl |
■■ |
||||
23 |
Isopropyl Alcohol |
■■■■■ |
||||
24 |
Isopropyl myristate |
■■■■ |
||||
25 |
L-Lactic acid |
■■■■■ |
||||
26 |
Methane, nitroso- |
■■■■ |
||||
27 |
Methyltartronic acid |
■■ |
||||
28 |
9 Octadecenamide, (Z) |
■■■■■ |
||||
29 |
4-Penten-2-ol |
■ |
||||
30 |
Phenol,2,4,bis (1,1 dimethylethyl) |
■■■■■ |
||||
31 |
Propanoic acid, 2-hydroxy-, methylester |
■ |
||||
32 |
2-Propanol,1-Hydrazino |
■■■■■ |
||||
33 |
Propylene glycol |
■■■■ |
||||
34 |
Pyrrolo [ 1,2 a ] pyrazine 1,4 dione, hexahydro 3 (2 methylpropyl) |
■■■■■ |
||||
35 |
R-(-)-1,2 propanediol |
■■■■ |
||||
36 |
Squalene |
■■ |
||||
37 |
Tetracosane |
■■■■ |
||||
38 |
Tetradecane |
■■■■■ |
||||
39 |
Tetradecanoic acid |
■■■ |
||||
40 |
Undecane |
■■■■■ |
■ represents Lactobacillus plantarum DB-2
■ represents Lactobacillus fermentum J-1
■ represents Pediococcus acidilactici M-3
■ represents Lactobacillus plantarum SK-3
■ represents Pediococcus pentosaceus SM-2
All five bacterial strains secreted different metabolites. The metabolites, their retention time, peak area, area % and peak height are represented in Table 3 and the GC-MS chromatograms are shown in Figure 1.
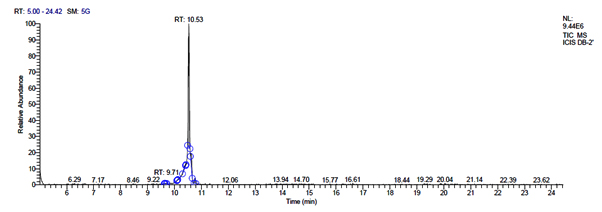 a. GC-MS chromatogram of metabolites secreted by plantarum DB-2
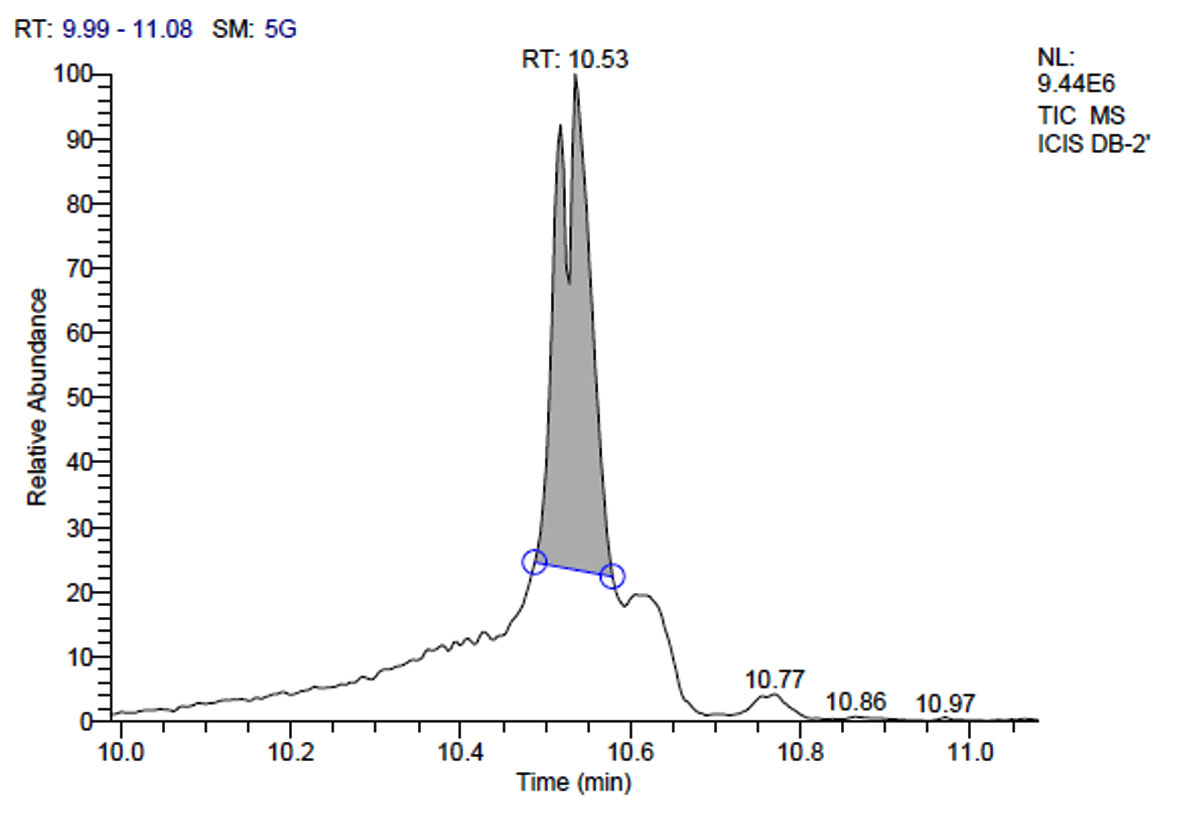
b. GC-MS chromatogram of plantarum DB-2 at retention time 10.53 min
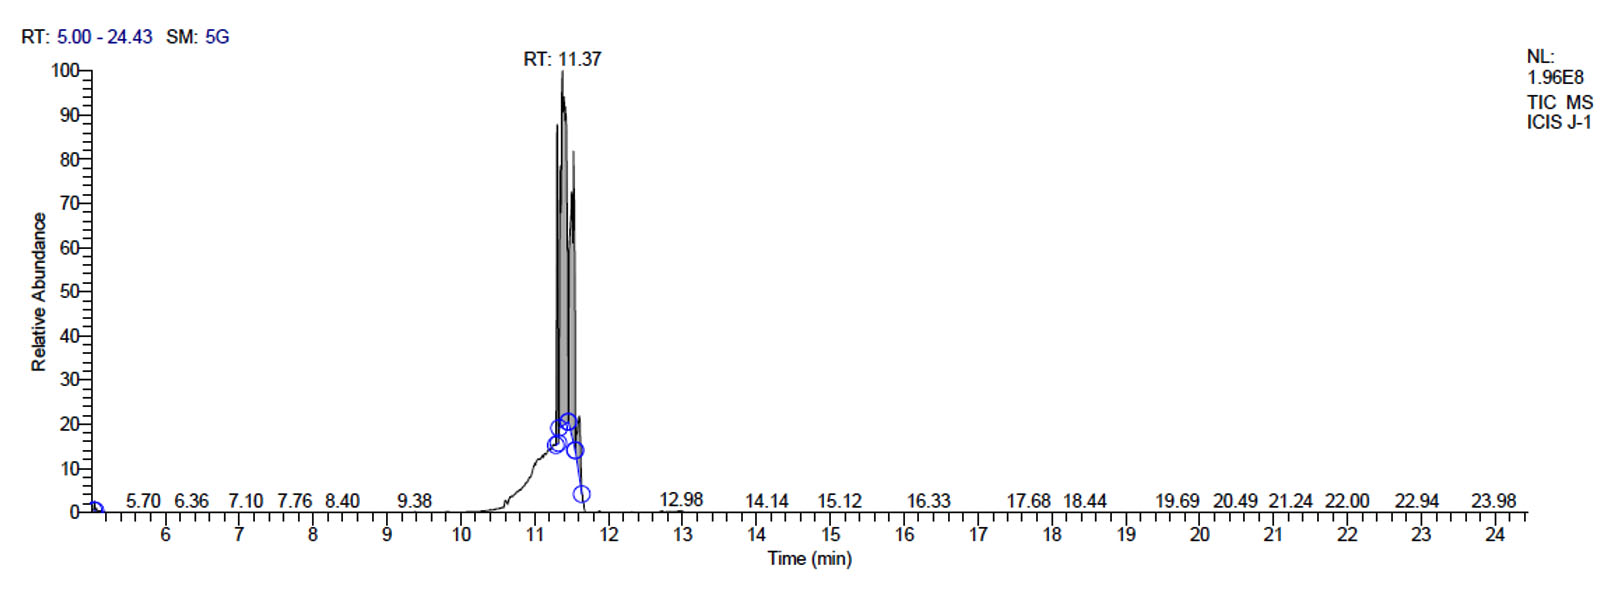
c. GC-MS chromatogram of metabolites secreted by fermentum J-1
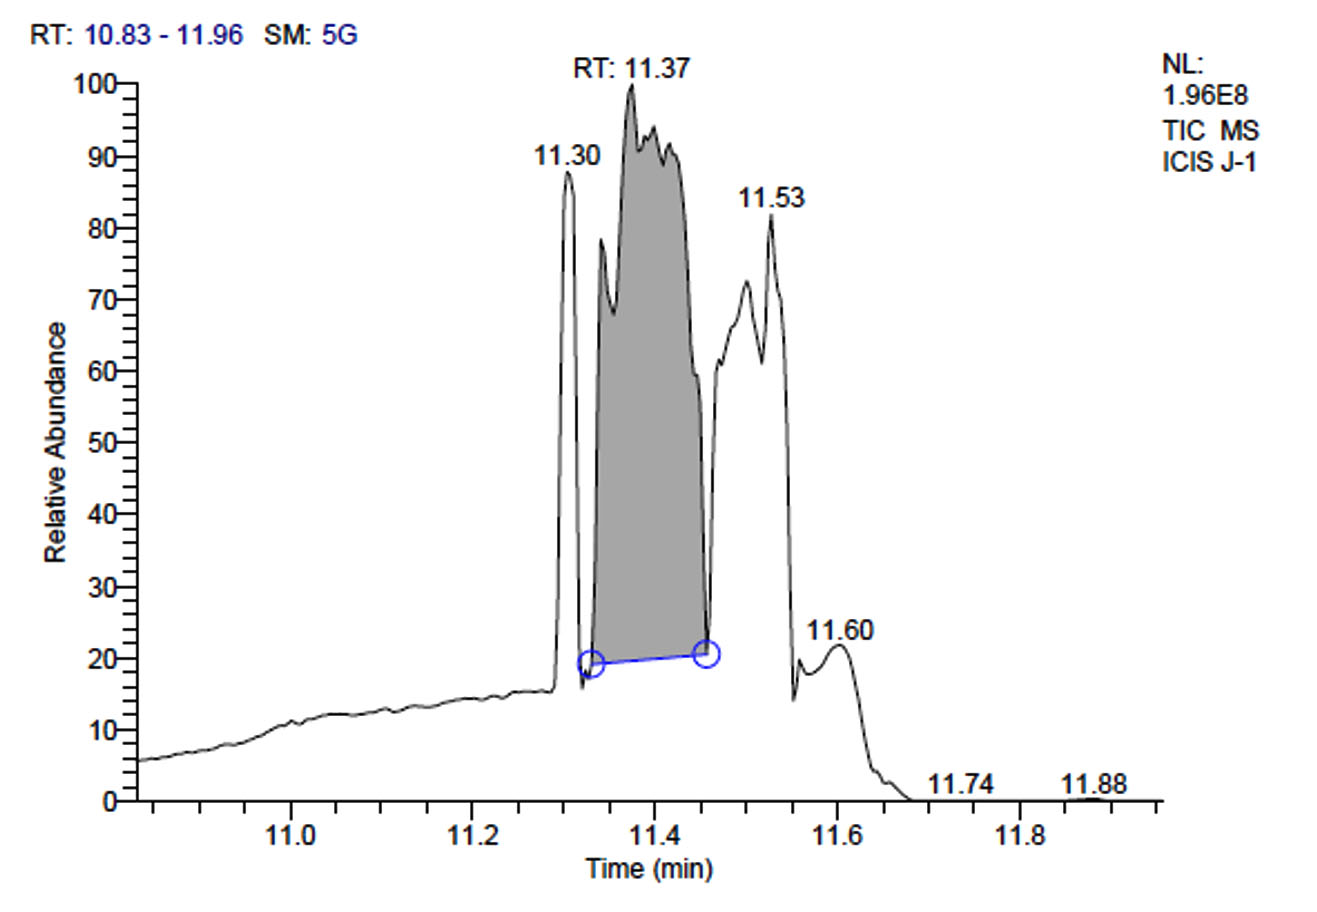
d. GC-MS chromatogram of fermentum J-1 at retention time 11.37 min
e. GC-MS chromatogram of metabolites secreted by acidilactici M-3

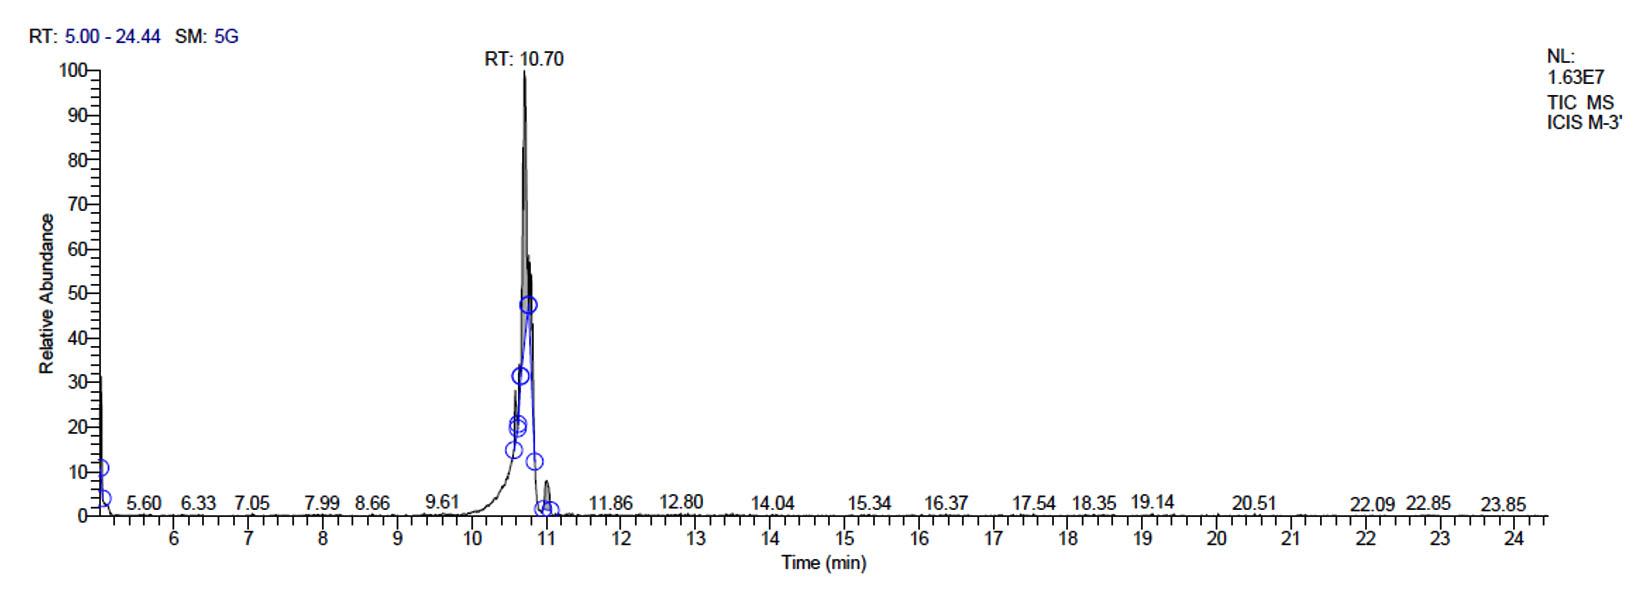
f. GC-MS chromatogram of acidilactici M-3 at retention time 10.70 min
g. GC-MS chromatogram of metabolites secreted by plantarum SK-3
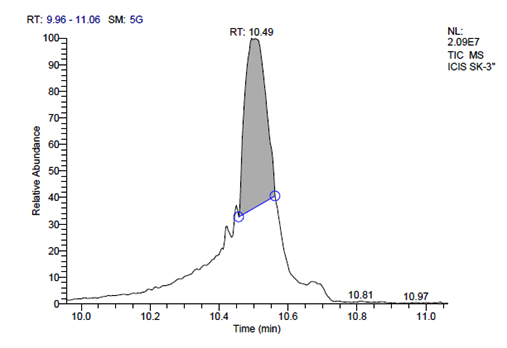
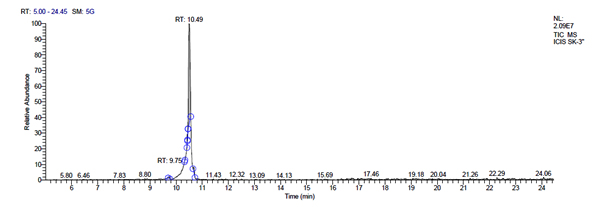
h. GC-MS chromatogram of plantarum SK-3 at retention time 10.49 min
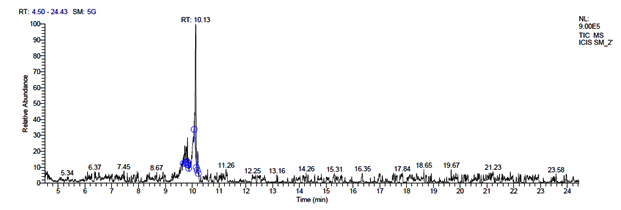
i. GC-MS chromatogram of metabolites secreted by pentosaceus SM-2
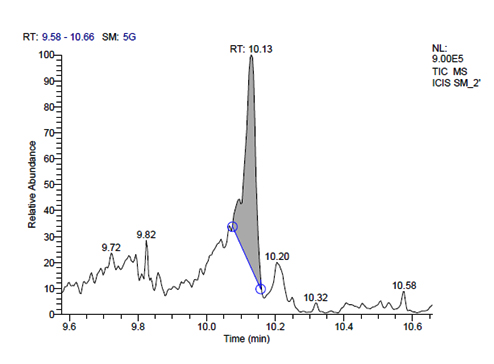
j. GC-MS chromatogram of pentosaceus SM-2 at retention time 10.13 min
Fig. 1. GC-MS chromatograms of metabolites secreted by Lactic acid bacteria
Total scans for L. plantarum DB-2 was 5709. Total run time was 19.42 min (5.00 – 24.42 min) (Figure 1a). The maximum peak area of 19659374.61 at the peak height of 7235909.56 was observed with 85.29% area covered at retention time 10.53 min (Table 3a, Figure 1b).
Table (3):
Metabolic profile of biocomponents identified in solvent extract of probiotic Lactic acid bacteria isolates by GC-MS.
a.) Lactobacillus plantarum DB-2
Retention Time |
Peak Area |
Area % |
Peak Height |
|---|---|---|---|
9.63 |
13668.39 |
0.06 |
23789.56 |
9.65 |
5965.64 |
0.03 |
13938.29 |
9.71 |
16405.98 |
0.07 |
28881.92 |
10.09 |
13022.90 |
0.06 |
27200.06 |
10.12 |
10917.74 |
0.05 |
18554.92 |
10.36 |
532337.99 |
2.31 |
147518.20 |
10.43 |
89582.31 |
0.39 |
148261.31 |
10.53 |
19659374.61 |
85.29 |
7235909.56 |
10.63 |
1922104.73 |
8.34 |
757552.20 |
10.77 |
785784.33 |
3.41 |
319137.44 |
| Retention Time | Metabolites | Molecular formula | Cas No. |
|---|---|---|---|
| 9.63 | Methane, nitroso- | CH3NO | 18501-20-7 |
| Formamide | CH3NO | 75-12-7 | |
| Dodecane | CH3(CH2)10CH3 | 112-40-3 | |
| DL-2,3-Butanediol | C4H10O2 | 6982-25-8 | |
| 9.65 | 2-Propanol, 1-hydrazino- | C3H10N2O | 18501-20-7 |
| Isopropyl alcohol | C3H8O | 67-63-0 | |
| Propylene glycol | C3H8O2 | 57-55-6 | |
| 9.71 | L-Lactic acid | C3H6O3 | 79-33-4 |
| Acetic acid, anhydride with formic acid | C3H4O3 | 2258-42-6 | |
| R-(-)-1,2-propanediol | C3H8O2 | 4254-14-2 | |
| 10.09 | Methyltartronic acid | C4H6O5 | 595-98-2 |
| Dodecanoic acid | C3H10N20 | 18501-20-7 | |
| 2-Hydrazinoethanol | C2H8N20 | 109-84-2 | |
| 10.12 | Tetradecane | CH2(CH3)10CH2 | 629-59-4 |
| Benzoic acid | C6H5COOH | 65-85-0 | |
| Undecane | C11H24 | 1120-21-4 | |
| 10.36 | Hexadecane, 2,6,11,15, tetramethyl | C20H42 | 504-44-9 |
| Benzaldehyde, 2,4, dimethyl | C9H10O | 15764-16-6 | |
| Phenol, 2,4, bis (1,1 dimethylethyl) | C14H22O | 96-76-4 | |
| 10.43 | Decane | C10H22 | 124-18-5 |
| Formamide | CH3N0 | 75-12-7 | |
| Tetracosane | C24H50 | 646-31-1 | |
| 10.53 | Hexadecane | C16H34 | 544-76-3 |
| Geranyl isovalerate | C15H26O2 | 109-20-6 | |
| Pyrrolo [1,2a] pyrazine 1,4 dione, hexahydro 3 (2 methylpropyl) | C11H18N2O2 | 5654-86-4 | |
| 10.63 | n-Hexadeconic acid | C16H32O2 | 57-10-3 |
| 9 Octadecenamide, (Z) | C18H35NO | 301-02-0 | |
| L-Lactic acid | C3H6O3 | 79-33-4 | |
| 10.77 | Methane, nitroso- | CH3NO | 865-40-7 |
| Ethylamine | C2H7N | 75-04-7 | |
| 2-Ethoxyethylamine | C4H11NO | 110-76-9 |
L. fermentum J-1 has total of 5713 scans. Total run time was 19.43 min (5.00 – 24.43 min) (Figure 1c). The maximum peak area of 863376582.00 at the peak height of 157335492.57 was observed with 54.03% area covered at retention time 11.37 min (Table 3b, Figure 1d).
b). Lactobacillus fermentum J-1.
Retention Time |
Peak Area |
Area % |
Peak Height |
|---|---|---|---|
5.04 |
2763275.83 |
0.17 |
4173857.72 |
11.30 |
152563796.70 |
9.55 |
141697072 |
11.37 |
863376582.00 |
54.03 |
157335492.57 |
11.53 |
497177369.61 |
31.12 |
129599071.95 |
11.61 |
81982240.17 |
5.13 |
26851053.15 |
| Retention Time | Metabolites | Molecular Formula | Cas No. |
|---|---|---|---|
| 5.04 | Hydroperoxide, pentyl | C5H12O2 | 74-80-6 |
| Ethanol, 2-(2-propenyloxy)- | C5H10O2 | 111-45-5 | |
| Hydroperoxide, 1-methylhexyl | C7H16O2 | 762-46-9 | |
| Decane | C10H22 | 124-18-5 | |
| Undecane | C11H24 | 1120-21-4 | |
| 11.30 | Benzaldehyde, 2,4, dimethyl | C9H10O | 15764-16-6 |
| Benzoic acid | C6H5COOH | 65-85-0 | |
| 2-Propanol, 1-hydrazino- | C3H10N2O | 18501-20-7 | |
| Isopropyl alcohol | C3H8O | 67-63-0 | |
| L-Lactic acid | C3H6O3 | 79-33-4 | |
| 11.37 | Dodecane | C12H26 | 112-40-3 |
| Phenol, 2,4 bis (1,1dimethylethyl) | C14H22O | 96-76-4 | |
| Propanoic acid, 2-hydroxy-,methyl ester, (ñ)- | C4H8O3 | 2155-30-8 | |
| Dodecanoic acid | C12H24O2 | 143-07-7 | |
| Tetradecane | CH2(CH3)10CH2 | 629-59-4 | |
| 11.53 | Hexadecane | C16H34 | 544-76-3 |
| Geranyl Isovalerate | C15H26O2 | 109-20-6 | |
| Pyrrolo [ 1,2 a ] pyrazine 1,4 dione, hexahydro 3 (2 methylpropyl) | C11H18N2O2 | 5654-86-4 | |
| n-Hexadeconic acid | C16H32O2 | 57-10-3 | |
| 2-Hydrazinoethanol | C2H8N2O | 109-84-2 | |
| 11.61 | Eicosanoic acid | C20H40O2 | 506-30-9 |
| Tetracosane | C24H50 | 646-31-1 | |
| Isopropyl myristate | C17H34O2 | 110-27-0 | |
| 9 Octadecenamide, (Z) | C18H35NO | 301-02-0 | |
| Tetradecanoic acid | C14H28O2 | 544-63-8 | |
| Hexadecane, 2,6,11,15 tetramethyl | C20H42 | 504-44-9 |
P. acidilactici M-3 has total of 5715 scans. Total run time was 19.44 min (5.00 – 24.44 min) (Figure 1e). The maximum peak area of 31245106.39 at the peak height of 9971964.56 was observed with 58.41% area covered at retention time 10.70 min (Table 3c, Figure 1f).
c). Pediococcus acidilactici M-3.
Retention Time |
Peak Area |
Area % |
Peak Height |
|---|---|---|---|
5.02 |
3774941.17 |
7.06 |
3718077.48 |
10.58 |
2981495.15 |
5.57 |
1994601.20 |
10.63 |
1773985.26 |
3.32 |
1572423.15 |
10.70 |
31245106.39 |
58.41 |
9971964.56 |
10.80 |
9650577.59 |
18.04 |
3715383.92 |
11.00 |
4064008.32 |
7.60 |
1071788.04 |
| Retention Time | Metabolites | Molecular Formula | Cas No. |
|---|---|---|---|
| 5.02 | Hydroperoxide, pentyl | C5H12O2 | 74-80-6 |
| Hydroperoxide, heptyl | C7H16O2 | 764-81-8 | |
| Ethanol, 2-(2-propenyloxy)- | C5H10O2 | 111-45-5 | |
| Benzoic acid | C6H5COOH | 65-85-0 | |
| 10.58 | Dodecane | C12H26 | 112-40-3 |
| Undecane | C11H24 | 1120-21-4 | |
| Isopropyl alcohol | C3H8O | 67-63-0 | |
| Propylene Glycol | C3H8O2 | 57-55-6 | |
| L-Lactic acid | C3H6O3 | 79-33-4 | |
| 10.63 | R-(-)-1,2-propanediol | C3H8O2 | 4254-14-2 |
| Tetradecane | CH2(CH3)10CH2 | 629-59-4 | |
| Phenol, 2,4 bis (1,1dimethylethyl) | C14H22O | 96-76-4 | |
| Hexadecane, 2,6,11,15 tetramethyl | C20H42 | 504-44-9 | |
| Benzaldehyde, 2,4, dimethyl | C9H10O | 15764-16-6 | |
| 10.70 | 2-Propanol, 1-hydrazino- | C3H10N2O | 18501-20-7 |
| Dodecanoic acid | C12H24O2 | 143-07-7 | |
| Methane, nitroso- | CH3NO | 865-40-7 | |
| Tetracosane | C24H50 | 646-31-1 | |
| Decane | C10H22 | 124-18-5 | |
| 10.80 | Eicosanoic acid | C20H40O2 | 506-30-9 |
| Hexadecane | C16H34 | 544-76-3 | |
| Isopropyl myristate | C17H34O2 | 110-27-0 | |
| Geranyl isovalerate | C15H26O2 | 109-20-6 | |
| n-Hexadeconic acid | C16H32O2 | 57-10-3 | |
| 11.00 | Ethanamine, 2-propoxy- | ||
| Pyrrolo [ 1,2 a ] pyrazine 1,4 dione, hexahydro 3 (2 methylpropyl) | C11H18N2O2 | 5654-86-4 | |
| Tetradecanoic acid | C14H28O2 | 544-63-8 | |
| 9 Octadecenamide, (Z) | C18H35NO | 301-02-0 | |
| Squalene | C30H50 | 111-02-4 |
L. plantarum SK-3 has total of 5719 scans. Total run time was 19.45 min (5.00 – 24.45 min) (Figure 1g). The maximum peak area of 55699133.56 at the peak height of 13468063.78 was observed with 92.21% area covered at retention time 10.49 min (Table 3d, Figure 1h).
d). Lactobacillus plantarum SK-3.
Retention Time |
Peak Area |
Area % |
Peak Height |
|---|---|---|---|
9.75 |
625128.64 |
1.03 |
279968.97 |
10.33 |
87526.28 |
0.14 |
137242.54 |
10.42 |
1067849.36 |
1.77 |
1455637.02 |
10.45 |
898971.70 |
1.49 |
1508377.52 |
10.49 |
55699133.56 |
92.21 |
13468063.78 |
10.69 |
2027689.17 |
3.36 |
774610.72 |
| Retention Time | Metabolites | Molecular Formula | Cas No. |
|---|---|---|---|
| 9.75 | Isopropyl alcohol | C3H8O | 67-63-0 |
| L-Lactic acid | C3H6O3 | 79-33-4 | |
| 2-propanol, 1-hydrazino | C3H10N2O | 18501-20-7 | |
| Benzoic acid | C6H5COOH | 65-85-0 | |
| 10.33 | 2-Hydrazinoethanol | C2H8N20 | 109-84-2 |
| Dodecane | C12H26 | 112-40-3 | |
| Benzaldehyde, 2,4, dimethyl | C9H10O | 15764-16-6 | |
| Undecane | C11H24 | 1120-21-4 | |
| 10.42 | Propylene glycol | C3H8O2 | 57-55-6 |
| Tetradecane | CH2(CH3)10CH2 | 629-59-4 | |
| Dodecanoic acid | C12H24O2 | 143-07-7 | |
| Hexadecane, 2,6,11,15 tetramethyl | C20H42 | 504-44-9 | |
| 10.45 | R-(-)-1,2-propanediol | C3H8O2 | 4254-14-2 |
| Hexadecane | C16H34 | 544-76-3 | |
| Isopropyl myristate | C17H34O2 | 110-27-0 | |
| Decane | C10H22 | 124-18-5 | |
| 10.49 | Methane, nitroso- | CH3NO | 865-40-7 |
| Phenol, 2,4 bis (1,1dimethylethyl) | C14H22O | 96-76-4 | |
| Geranyl isovalerate | C15H26O2 | 109-20-6 | |
| n-Hexadeconic acid | C16H32O2 | 57-10-3 | |
| 10.69 | Ethanamine, 2-propoxy- | C5H13NO | 42185-03-5 |
| 4-Amino-1-butanol | C4H11NO | 13325-10-5 | |
| Pyrrolo [ 1,2 a ] pyrazine 1,4 dione, hexahydro 3 (2 methylpropyl) | C11H18N2O2 | 5654-86-4 | |
| 9 Octadecenamide, (Z) | C18H35NO | 301-02-0 |
L. pentosaceus SM-2 has total of 5860 scans. Total run time was 19.93 min (4.50 – 24.43 min) (Figure 1i). The maximum peak area of 1586768.57 at the peak height of 739977.40 was observed with 68.57% area covered at retention time 10.13 min (Table 3e, Figure 1j).
e). Pediococcus pentosaceus SM-2.
Retention Time |
Peak Area |
Area % |
Peak Height |
|---|---|---|---|
9.72 |
216757.74 |
9.37 |
98425.02 |
9.79 |
210048.41 |
9.08 |
89220.41 |
9.82 |
72569.37 |
3.14 |
142459.44 |
9.86 |
36228.30 |
1.57 |
51748.50 |
10.13 |
1586768.57 |
68.57 |
739977.40 |
10.20 |
191626.29 |
8.28 |
115859.62 |
| Retention Time | Metabolites | Molecular Formula | Cas No. |
|---|---|---|---|
| 9.72 | Methyltartronic acid | C4H6O5 | 595-98-2 |
| L-Lactic acid | C3H603 | 79-33-4 | |
| 2-propanol, 1-hydrazino | C3H10N2O | 18501-20-7 | |
| Benzoic acid | C6H5COOH | 65-85-0 | |
| 9.79 | R-(-)-1,2-propanediol | C3H8O2 | 4254-14-2 |
| DL- 2,3 –Butanediol | C4H10O2 | 6982-25-8 | |
| Dodecane | C12H26 | 112-40-3 | |
| Decane | C10H22 | 124-18-5 | |
| Benzaldehyde, 2,4, dimethyl | C9H10O | 15764-16-6 | |
| 9.82 | Propylene glycol | C3H8O2 | 57-55-6 |
| Tetradecane | CH2(CH3)10CH2 | 629-59-4 | |
| Dodecanoic acid | C12H24O2 | 143-07-7 | |
| Phenol, 2,4 bis (1,1dimethylethyl) | C14H22O | 96-76-4 | |
| Hexadecane, 2,6,11,15 tetramethyl | C20H42 | 504-44-9 | |
| 9.86 | Isopropyl Alcohol | C3H8O | 67-63-0 |
| Hexadecane | C16H34 | 544-76-3 | |
| Tetracosane | C24H50 | 646-31-1 | |
| Tetradecanoic acid | C14H28O2 | 544-63-8 | |
| Undecane | C11H24 | 1120-21-4 | |
| 10.13 | Methane, nitroso- | CH3NO | 865-40-7 |
| Isopropyl myristate | C17H34O2 | 110-27-0 | |
| Geranyl isovalerate | C15H26O2 | 109-20-6 | |
| n-Hexadeconic acid | C16H32O2 | 57-10-3 | |
| Eicosanoic acid | C20H40O2 | 506-30-9 | |
| 10.20 | 4-Penten-2-ol | C5H10O | 625-31-0 |
| Pyrrolo [ 1,2 a ] pyrazine 1,4 dione, hexahydro 3 (2 methylpropyl) | C11H18N2O2 | 5654-86-4 | |
| 9 Octadecenamide, (Z) | C18H35NO | 301-02-0 | |
| Squalene | C30H50 | 111-02-4 |
Five metabolic compounds were distributed in four of the selected isolates viz. Isopropyl myristate; Methane, nitroso-; Propylene glycol; R-(-)-1,2 propanediol and Tetracosane. Compounds- Methane, nitroso-; Propylene glycol; R-(-)-1, 2 propanediol were present in
L. plantarum DB-2, P. acidilactici M-3, L. plantarum SK-3 and P. pentosaceus SM-2. A metabolite – Isopropyl myristate was secreted by L. fermentum J-1, P. acidilactici M-3, L. plantarum SK-3 and P. pentosaceus SM-2. Compound – Tetracosane was reported in L. plantarum DB-2, L. fermentum J-1, P. acidilactici M-3 and P. pentosaceus SM-2. Out of five metabolic compounds, Isopropyl myristate has been reported with medicinal activity against skin disorders. Out of 40, 3 metabolic compounds i.e. Eicosanoic acid, 2-Hydrazino ethanol and Tetradecanoic acid have been reported in three of the selected isolates. A metabolite – Eicosanoic acid was secreted by L. fermentum J-1, P. acidilactici M-3, and P. pentosaceus SM-2. Compound – 2-Hydrazino ethanol was found in supernatant of L. plantarum DB-2, P. acidilactici M-3 and P. pentosaceus SM-2. A metabolic compound – Tetradecanoic acid was present in L. fermentum J-1, P. acidilactici M-3 and P. pentosaceus SM-2 (Table 2).
Six out of 40 metabolic compounds viz. DL-2, 3-Butanediol; Ethanamine, 2-propoxy-; Ethanol, 2-(2-propenyloxy); Hydroperoxide, pentyl; Methyltartronic acid and Squalene were present in two of the selected isolates. Metabolites – DL-2, 3-Butanediol and Methyltartronic acid were secreted by L. plantarum DB-2 and L. plantarum SK-3. Compounds – Ethanamine, 2-propoxy-; Ethanol, 2-(2-propenyloxy) and Hydroperoxide, pentyl were found in the supernatant of P. acidilactici M-3 and L. plantarum SK-3. Metabolite – Squalene was synthesized in the culture supernatant of P. acidilactici M-3 and P. pentosaceus SM-2 (Table 2). Squalene is a triterpine compound, originally found in shark liver oil and has a high therapeutic potential. Squalene is a therapeutic agent having anti-cancerous, anti-tumour, chemo-preventive, antioxidant, and sunscreen properties along with anti-microbial activity (Ezhilan and Neelamegam, 2012). In industry, it is scarcely produced by plant sources along with the shark liver oil. Microbial production of Squalene is an attractive alternative to label the issue with an objective to increase its productivity and purity by using biotechnological interventions. Although, a detailed study is required for the commercialization of the production of Squalene from native probiotic bacteria.
9 metabolites out of 40 were produced by only one selected isolate viz. Acetic acid, anhydride with formic acid; 4-amino-1-butanol; 2-Ethoxyethylamine; Ethylamine; Formamide; Hydroperoxide, heptyl; Hydroperoxide, 1-methylhexyl; 4-Penten-2-ol and Propanoic acid, 2-hydroxy-, methylester. Compounds – Acetic acid, anhydride with formic acid; 2-Ethoxyethylamine; Ethylamine; Formamide were produced by L. plantarum DB-2. Metabolite – 4-amino-1-butanol was found to be synthesized by L. plantarum SK-3. Metabolite – Hydroperoxide, heptyl was present in P. acidilactici M-3. Compounds – Hydroperoxide, 1-methylhexyl and Propanoic acid, 2-hydroxy-, methylester were secreted by L. fermentum J1. Metabolite – 4-Penten-2-ol was produced by P. pentosaceus SM-2
(Table 2).
Probiotics has a vital role in well-being and health beyond basic nutrition. Probiotics have potential health benefits such as antimicrobial activity, antimutagenic, anticarcinogenic activities, constipation, regulation of immune function, improving gastrointestinal health, reducing lactose intolerance, and allergenic diseases such as food allergy, etc. Due to these health benefits, probiotic bacteria and their metabolites are gaining importance in pharmaceutical preparation, food products, medicines and dietary supplements (Da Cruz et al., 2009; Settanni and Moschetti, 2010; Fernandez et al., 2013). Production of different primary and secondary metabolites by the probiotic bacteria, employs their biological effects directly or by modifying the immune system. The metabolites of lactic acid bacteria provide therapeutic benefits in preventing and curing various diseases and also responsible for the development of flavour, aroma and texture in food products (Chen et al., 2014). The metabolites produced by lactic acid bacteria in this study have been remarked with various functional as well as therapeutic properties viz. food additives, flavouring agents, anti-inflammatory, anti-cancerous, potential against skin disorders, cholesterol-lowering and anti-diarrheal properties and endorse their huge potential in food and pharmaceutical industries.
Many researchers have observed similar metabolic products in many lactic acid bacteria influencing human metabolism when incorporated into the system as probiotics or the food fermented by the respective bacteria. Cagno et al. (2009) observed tomato juice fermented with L. plantarum POM1 and POM35 for the effect of metabolites produced by the bacterial starters (by GC-MS technique) on the sensory and health-promoting properties of tomato juice and found a large number of volatile compounds in fermented tomato juice as compared to the control. Lee et al. (2009) isolated the metabolites from lactic acid bacteria in grape wines through GC-based metabolic profiling and 1H-NMR and identified various organic acids such as lactic acid, tartaric acid and volatile compounds such as benzoic acid, dodecanoic acid, dodecamethyl cyclohexasiloxane, isopropyl myristate, tetradecanoic acid, 1-hexadecanol, hexadeconoic acid and octadecanoic acid responsible for wine odour and flavour. Vanaja et al. (2011) observed the metabolites secreted by L. plantarum LPcfr and found compounds viz. hexadecane, hexadeconic acid, dodecanal having antifungal and antioxidant properties and fatty acids such as stearic and palmitic acids having antifungal properties. Sheela et al. (2012) found antimicrobial compounds (fatty acids such as palmitic acid and stearic acid and Phenol, 2, 4-bis (1, dimethylethyl)) after GC-MS in symbiotic cow milk beverage fermented with L. kefiranofaciens, Candida kefir and Saccharomyces boulardii. The fermented cow milk symbiotic beverage had the greater anti-diarrhoeal effect as compared to other milk beverages, thereby indicating the role of antibacterial metabolites produced by the probiotic bacteria. Padmavathi et al. (2014) studied the anti-biofilm efficacy and anti-quorum sensing of the metabolites produced by marine Vibrio alginolyticus G16 against Serratia marcescens and found the active compound as phenol, 2, 4-bis (1,1-dimethylethyl) after purification and mass spectrometric analysis.
Sheela et al. (2015) studied the biocontrol efficacy of symbiotic strawberry juice and found most of the metabolites were of antibacterial, anti-diarrhoeal (17-pentatriacontene) and of antioxidative nature. Effect of probiotics and prebiotics was evaluated on the metabolites isolated from human microbiota and found these metabolites helping in the regulation of colonic cell proliferation, inactivation of toxic compounds and enhancement of health-promoting properties (Vitali et al., 2012). Hong-Xin et al. (2015) used GC-MS analysis to identify aroma compounds viz. decane, dodecanoic acid, hexadecanoic acid, hexanoic acid 4-hexadecyl ester and phenol 2,4 bis (1,1-dimethylethyl) during ripening period (180 days) of cheese fermented with L. casei LC2W and found these metabolites help in accelerating the ripening process.
The reliability of the technique in investigating the effect of metabolic compounds on colonic metabolic signature has been recently studied (Maccaferri et al., 2010, Vitali et al., 2010, Garner et al., 2007).
Utilization of probiotic bacteria and their metabolites in medicines, dietary supplements, pharmaceutical preparation and food products are enhancing due to their potential health benefits such as anticarcinogenic activities, constipation, reducing lactose intolerance, regulation of immune function, allergenic diseases such as food allergy, etc. These attributes of probiotic lactic acid bacteria have been described by the production of different primary and secondary metabolites that exert their biological effects either directly or by modifying the immune system.
ACKNOWLEDGMENTS
Authors are thankful to Hon’ble Chairperson JV’n Vidushi Garg & Hon’ble Founder and Advisor JV’n Dr. Panckaj Garg, Jayoti Vidyapeeth Women’s University, Jaipur (Rajasthan) for their kind cooperation, encouragement and providing the facilities of University Innovation Centre and other laboratories.
CONFLICT OF INTEREST
The authors declare that they have no conflict of interest.
AUTHORS’ CONTRIBUTION
Ad C conceived and planned the experiments, performed the analysis and wrote the manuscript. K V and B S S supervised the research project.
FUNDING
None.
ETHICS STATEMENT
This research does not contain any studies with human participants or animals performed by any of the authors.
AVAILABILITY OF DATA
The authors declare that [the/all other] data supporting the findings of this study are available within the article.
- Alreshidi M M, Dunstan R H, Macdonald M M, Smith N D, Gottfries J, Roberts T K. Metabolomic and proteomic responses of Staphylococcus aureus to prolonged cold stress. J Proteome, 2015; 121: 44–55.
Crossref - Aneja K R. Experiments in Microbiology, Plant pathology and Biotechnology. Biochemical activities of microorganisms, 4th edn. New age International Publishers, New Delhi, 2003; pp. 245-275.
- AOAC. 1995. Official methods of analysis of association of official analytical chemists, 16th edn. Vol I and II. Association of Official Analytical Chemists. Arlington, Virginia, USA.
- Bharat N, Irshad M, Rizvi M A, Fatma T. Antimicrobial and cytotoxic activities of cyanobacteria. International Journal of Innovative Research in Science, Engineering and Technology, 2013 ; 2(9): 4328-4343.
- Bollag D M and Edelstein S J. Protein concentration determination. In: Bollag D M and Edelstein S J, eds. Protein Methods, Wiley-Liss, 1991 New York.
- Chaudhary A and Saharan BS. Probiotic properties of Lactobacillus plantarum. Journal of Pure and Applied Microbiology, 2019 ; 13(2): 933-948.
Crossref - Chen M M, Li A L, Sun M C, Feng Z, Meng X C and Wang Y. Optimization of the quenching method for metabolomics analysis of Lactobacillus bulgaricus. Journal of Zhejiang University-Science B (Biomedicine and Biotechnology), 2014 ; 15(4): 333-342.
Crossref - Coucheney E, Daniell T J, Chenu C and Nunan N. Gas chromatographic metabolic profiling: a sensitive tool for functional microbial ecology. Journal of Microbial Methods, 2008 ; 75: 491-500.
Crossref - Da Cruz G, Alonso Buriti A, Batista F C, De Souza C H, Fonseca Faria J A and Isay Saad S M. Probiotic cheese: health benefits, technological and stability aspects. Trends in Food Science and Technology, 2009 ; 20(8): 344-354.
Crossref - de Man J, Rogosa M and Sharpe M. A medium for the cultivation of lactobacilli. Journal of Applied Bacteriology, 1960 ; 3:13-135.
Crossref - Del Re B, Sgorbati B, Miglioli M and Palenzona D. Adhesion, autoaggregation and hydrophobicity of 13 strains of Bifidobacterium longum. Letters in Applied Microbiology, 2000 ; 31:438-442.
Crossref - Ezhilan B P and Neelamegam R. GC-MS analysis of phytocomponents in the ethanol extract of Polygonum chinense L. Pharmacognosy Research, 2012 ; 4(1): 11–14.
Crossref - Fernandez L, Langa S, Martin V, Maldonado A, Jimenez E, Martin R and Rodriguez J M. The human milk microbiota: origin and potential roles in health and diseases. Pharmacological Research, 2013 ; 69(1): 1-10.
Crossref - Garner C E, Smith S, de Lacy Costelllo B, White P, Spencer R. Volatile organic compounds from feces and their potential for diagnosis of gastrointestinal diseases. FASEB J, 2007 ; 21: 1675-88.
Crossref - Harrigan W F. Laboratory methods in food microbiology. Academic Press: New York 1998.
- Harrigan W F and McCance M E. Laboratory Methods in Food and Dairy Microbiology. Academic Press, London. 1990.
- Hashem S, Sabit H H, Amin M, Tawakkot W and Shamseldin A F. Molecular characterization of Egyptian isolates of Lactobacillus and Bifidobacterium. Journal of American Science, 2010 ; 6(11): 959-964.
- Hong-Xin J, Mi-Ya S and Guang-Yu G. Influence of Lactobacillus casei LC2W on the proteolysis and aroma compounds of Cheddar cheese during ripening period. CyTA Journal of Food; 2015 .
Crossref - Lee J, Hong Y and Lee C. Characterization of fermentation behaviours of lactic acid bacteria in Grape wines through 1H NMR- and GC based metabolic profiling. Journal of Agricultural and Food Chemistry, 2009 ; 57: 4810-4817.
Crossref - Li X, Long D, Ji J, Yang W, Zeng Z, Guo S. Sample preparation for the metabolomics investigation of poly-gamma-glutamate-producing Bacillus licheniformis by GC-MS. J Microbiol Meth, 2013 ; 94(1):61–7.
Crossref - Liong M T and Shah N P. Acid and bile tolerance and cholesterol removal ability of Lactobacilli strains. Journal of Dairy Science, 2005 ; 88:55-56.
Crossref - Maccaferri S, Vitali B, Klinder A, Kolida S, Ndagijimana M. Rifaximin modulates the colonic microbiota of patients with Crohn’s disease: an in vitro approach using a continuous culture colonic model system. J Antimicrobial Chemotherapy, 2010 ; 65: 2556-2565.
Crossref - Mastrangelo A, Ferrarini A, Rey-Stolle F, Garcia A, Barbas C. From sample treatment to biomarker discovery: a tutorial for untargeted metabolomics based on GC-(EI)-Q-MS. Anal Chim Acta, 2015 ; 900:21–35.
Crossref - Mora D, Fortina M G, Parini C, Ricci G, Gatti M, Giraffa G and Manachini P L. Genetic diversity and technological properties of Streptococcus thermophilus strains isolated from dairy products. Journal of Applied Microbiology, 2002; 93:278-287.
Crossref - Nordstrom A. Design of experiments: an efficient strategy to identify factors influencing extraction and derivatization of Arabidopsis thaliana samples in metabolomic studies with gas chromatography/mass spectrometry. Anal Biochem. 2004 ; 331(2):283–95.
Crossref - Padmavathi A R, Abinaya B and Pandian S K. Phenol, 2,4-bis(1,1-dimethylethyl) of marine bacterial origin inhibits quorum sensing mediated biofilm formation in the uropathogen Serratia marcescens. Biofouling , 2014 ; 30(9): 1111-1122.
Crossref - Papagianni M and Anastasiadou S. Pediocins: the bacteriocins of Pediococci: sources, production, properties and applications. Microbial Cell Factories, 2009 8:3.
Crossref - Park S E, Seo S H, Kim E J, Byun S H, Na C S, Son H S. Changes of microbial community and metabolite in kimchi inoculated with different microbial community starters. Food Chem, 2019; 274: 558–565.
Crossref - Park S E, Yoo S A, Seo S H, Lee K I, Na C S, Son H S. GC-MS based metabolomics approach of kimchi for the understanding of Lactobacillus plantarum fermentation characteristics. Lwt-food Sci Technol. 2016; 68: 313–321.
Crossref - Pogacic T, Maillard M B, Leclerc A, Herve C, Chuat V, Yee A L, Valence F, Thierry A. A methodological approach to screen diverse cheese-related bacteria for their ability to produce aroma compounds. Food Microbiol , 2015 46: 145–153.
Crossref - Rosenberg M, Gutnick D and Rosenberg E. Adherence of bacteria to hydrocarbons: a simple method for measuring cell surface hydrophobicity. FEMS Microbiology Letters, 1980 ; 9:29-33.
Crossref - Schummer C, Delhomme O, Appenzeller B M, Wennig R, Millet M. Comparison of MTBSTFA and BSTFA in derivatization reactions of polar compounds prior to GC/MS analysis. Talanta, 2009 ; 77(4):1473–82.
Crossref - Settanni L and Moschetti G. Non-starter lactic acid bacteria used to improve quality and provide health benefits. Food Microbiology, 2010 ; 27(6): 691-697.
Crossref - Sheela T, Devi D B, Sabetha B, Vinoth M and Jayakumar K. Biocontrol efficacy of synbiotic Strawberry (Fragaria ananassa Duch.) juice. International Journal of food Nutrition and Safety, 2015 ; 6(1): 10-16.
- Sheela T, Kulothungan S and Sugnaya R S. Effect of symbiotic milk beverage on diarrhoel causing organisms. International Journal of Current Pharmaceutical Research, 2012 ; 4(2): 74-78.
- Smart K F, Aggio R B M, Van Houtte J R, Villas-Boas S G. Analytical platform for metabolome analysis of microbial cells using methyl chloroformate derivatization followed by gas chromatography-mass spectrometry. Nat Protoc. 2010 ; 5(10):1709–29.
Crossref - Thirabunyanon M, Boonprasom P and Niamsup P. Probiotic potential of lactic acid bacteria isolated from fermented dairy milks on antiproliferation of colon cancer cells. Biotechnology Letters, 2009 ; 31: 571–576.
Crossref - Vanaja G, Gotcheva V, Angelov A and Agrawal R. Formation of volatile and fatty acids of therapeutic importance in the probiotic Lactobacillus plantarum LPcfr adapted to resist GI conditions. Journal of Food Science and Technology, 2011; 48(1): 110-113.
Crossref - Villas-Boas S G, Mas S, Akesson M, Smedsgaard J, Nielsen J. Mass spectrometry in metabolome analysis. Mass Spectrom. Rev. 2005 ; 24: 613–646.
Crossref - Vitali B, Ndagijimana M, Cruciani F, Carnevali P, Candela M. Impact of a synbiotic food on the gut microbial ecology and metabolic profiles. BMC Microbiol, 2010; 10: 4.
Crossref - Vitali B, Ndagijimana M, Maccaferri S, Biagi E, Guerzoni M E and Bridigi P. An in vitro evaluation of the effects of probiotic and prebiotics and prebiotics on the metabolic profile of human microbiota. Anaerobe, 2012; 1: 6.
Crossref - Walker D K and Gilliland S E. Relationships among bile tolerance, bile salts deconjugation and assimilation of cholesterol by Lactobacillus acidophilus. Journal of Dairy Science, 1993 ; 76: 956-961.
Crossref
© The Author(s) 2020. Open Access. This article is distributed under the terms of the Creative Commons Attribution 4.0 International License which permits unrestricted use, sharing, distribution, and reproduction in any medium, provided you give appropriate credit to the original author(s) and the source, provide a link to the Creative Commons license, and indicate if changes were made.