

ISSN: 0973-7510
E-ISSN: 2581-690X
The present investigation was conducted with the objective to explore the production of wine from Jamun fruit by manipulating the fermentation variables. During study three different wine yeasts strains viz. Sachharomyces cerevisiae 3304, 4787 and 3604 were first screened at 15oC and 25oC for their ability to produce wine using Jamun juice with respect to sugar utilization, alcohol production and yeast viable count, strain S. cerevisiae 4787 was selected on the basis of fermentation rate and final alcohol level in the wine. This strain was used for experiment carried out to investigate the effect of inoculum levels (2.5%, 5% and 7.5%) on the wine. Wine was chemically analyzed and observed that there was no significant effect of inoculum level. Considering the chemical composition of wines, yeast strain S. cerevisiae 4787, 7.5% inoculum level and fermentation temperature 25oC were optimum conditions for the preparation of wine. Wine thus prepared was evaluated chemically as well as organoleptically. It was observed that Jamun wine was quite acceptable and acceptability of wine was increased with storage.
Jamun wine, inoculum level, Sachharomyces cerevisiae, fermentation.
Fruits are important source of minerals and vitamins and are important constituents of the diet. Fruits being perishable commodity cannot be transported to distant places for marketing. The surplus produce, therefore, needs to be consumed or processed immediately. Technologies have been developed for the utilization of most of the fruits for the production of Jam, Jelly, Squash, Syrup and dehydrated products. During processing of fruits, a considerable part of valuable nutrient such as vitamin is lost as a result of heat treatment. Fruit wine is a health drink resulting from complete or partial alcoholic fermentation of fruit juices with the help of wine yeast (Saccharomyces cerevisiae) (Joshi and Attri, 1990). Being fruit based undistilled beverage wine retains all the minerals and vitamins. A Glucose Tolerance Factor (GTF) synthesized by yeast and released in fermentation medium is helpful in curing diabetes (Kraus, 2003). Wines are beverages with moderate alcoholic content (10-15%) and are consumed as an appetizer and stimulant in modern diet. Besides alcohol, wine contains vitamins, amino acids, esters, tartaric acid and phenolic compounds derived from the fruit juices and yeast. The phenolic compounds are effective in reducing thrombiotic anthergenic process and also inhibit platelet aggregation (Simonetti et al. 1997). A large part of these phenolics in wine act as antioxidants and some of these are effective for lowering the lipid oxidation (Kanner et al. 1994) and has positive health effects against cancer and brain degenerative process (Budak and Guzel-Seydim, 2010). Proteins are also present in wines in low concentrations (15-230 mg/l), contributing little to their nutritive value and affect the clarity and stability of wines (Glampedaki et al. 2010)
Traditionally, Grapes have been used to produce different types of wines. However, other fruits such as apple, plum, apricot, peach, banana, and guava have also been utilized for the preparation of wine.
Jamun (Syzygium cuminii L. Skeels), a minor fruit crop, is gaining popularity among the consumers due to its high neutroclinical values (Das, 2009). Jamun belongs to the myrtaceae family, is cultivated for its colourful, edible fleashy fruits (Janick and Paull, 2008) and is a native of India, Burma (Myanmar), Sri Lanka. The other common names of Jamun are java plum, jambul, jambu, blackplum, and kalajam (Prasad and Kumar, 2010). Jamun fruits are available only for short duration in June-July. Its fruits are a rich source of minerals (Mn, Zn, Fe, Ca, Na etc.), sugars, tannins, anthocyanin and other phenolic compounds. Jamun contains 19.7% carbohydrates, 0.7% proteins, 0.02% calcium, 0.1% fat, 0.01% phosphorus, 0.4% mineral matter, 0.1% iron and 0.9% fiber (Rai et al. 2011). The ripe Jamun fruits are bright purple in color and delicious in taste having high nutritional and medicinal value. The berry is oblong, ovoid and shiny crimson black (rich in anthocyanins as antioxidant) when fully ripe (Chowdhury and Ray, 2007). The ripe fruits widely eaten and has combination of sweet mildly sour and astringent flavour. The presence of oxalic acid, gallic acid and certain alkaloids are responsible for the typical astringent taste. The refreshing and curative properties of Jamun make it one of the useful medicinal plants of India. Jamun fruits are good source of iron used as an effective medicine against diabetes, heart & liver trouble (Prasad and Kumar, 2010). Before the discovery of insulin, Jamun was useful in treatment of diabetes and as an integral part in the various alternative systems of medicine (Baliga et al, 2011). Attempts have been made to process Jamun into Jam, Jelly, Squash and Ready-to-Serve beverages. The fruit contains a biochemical called Jamboline which is believed to check the pathological conversion of starch into sugar in case of increased level of glucose (Chowdhury and Ray, 2007).
In view of many medicinal and therapeutic properties of Jamun and seasonal availability, an attempt has been made in this study to prepare wine from its juice since wine has longer shelf life than fruit juices and retains all the nutrients.
Jamun fruits and wine yeast
The fresh and ripened Jamun fruits were procured from local market of Hisar and used for preparation of wine. Pure cultures of Sachharomyces cerevisiae strain 3304 and 3604 were obtained from National Chemical Laboratory, Pune and strain 4787 was obtained from IMTECH, Chandigarh.
Extraction of juice
Ripe fruits were washed thoroughly with tap water containing 200ppm of potassium metabisulphite and the pulp was separated manually from the seeds. The pulp was then homogenized in the blender to obtain fine pulp and juice was extracted by hand pressing through muslin cloth.
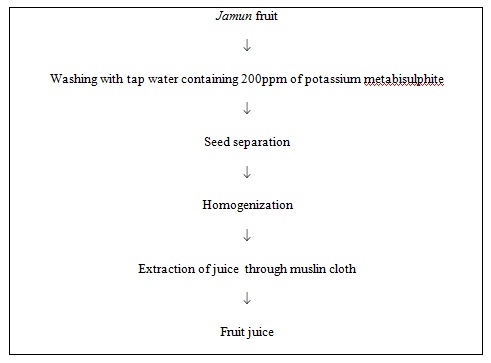
Fig 1. Flow sheet for extraction of Jamun juice
Fermentation of juice
Cane sugar and tartaric acid were added into the juice (amelioration) to attain 20 oBrix and pH 4.5 respectively. Then juice was supplemented with 0.2% ammonium sulphate to provide additional nitrogen for the growth of yeast. For the screening of yeast strains Jamun juice was inoculated with 5% starter culture of S. cerevisiae strains 3304, 4787 and 3604. Fermentation was carried out in flask containing 200ml juice at 15oC and 25oC. Samples were withdrawn at regular intervals for the chemical analysis. The observations were continued till fall in oBrix stayed. For further experiment strain S. cerevisiae 4787 was selected on the basis of fermentation rate and alcoholic content. To compare the effect of inoculum levels (2.5% and 7.5%) the Jamun juice was inoculated with starter culture strain S. cerevisiae 4787 and fermentation was carried out at 15oC and 25oC. The fall in oBrix was recorded regularly. The observations were continued till steady state values were obtained. The wine was then clarified by centrifugation at 5700 rpm for 10 minutes. After that wine was bottled and pasteurized at 60oC for 20 minutes and stored at refrigerated temperature for two months. Considering the chemical composition of wines, yeast strain S. cerevisiae 4787, 7.5% inoculum level and fermentation temperature 25oC were optimum conditions for the preparation of wine. The Jamun wine obtained from this treatment was analysed for organoleptic acceptability.
Chemicals
The chemicals used for investigation were of analytical grade reagents (A.R.) obtained from Glaxo India Ltd., Bombay, E. Merck, India and Himedia.
Chemical Analysis
T.S.S was recorded by hand refractometer (0-32 scale) and pH was recorded with the help of pH meter. Acidity (%) and total phenols (mg/100ml) were analyzed as per the procedure suggested by AOAC (1990).
Sugars were estimated by the method developed by Lane and Eynon (1923). Alcohol contents in beverage were determined by methods of Caputi et al. (1968). Yeast viable count (CFU/ml) was determined by total plate count method.
Organoleptic Evaluation
100 point score card was used to record organoleptic quality of wine. The wine samples were evaluated organoleptically by 10 semi trained judges at 0, 30 and 60 day.
Statistical Analysis
The data obtained was subjected to analysis of variance (ANOVA) technique and analyzed according to factorial completely randomized designs (CRD). The critical difference value at 5% level was used for making comparison among different treatments.
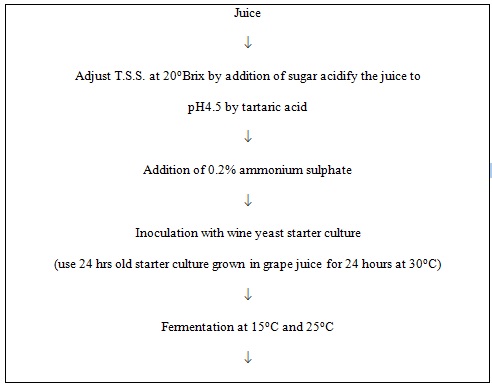
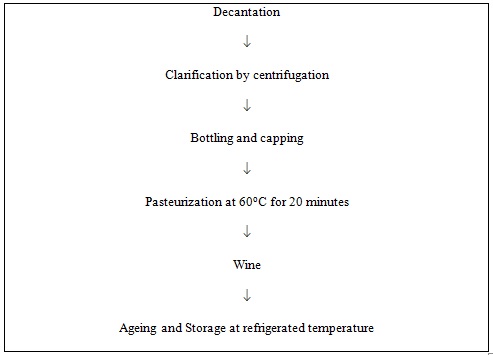
Fig. 2. Flow sheet for preparation of wine
During fermentation of fruit juices for the production of wine, utilization of sugars by the yeasts results in production of alcohol and fall in oBrix of the medium. Simultaneously, other chemical changes take place, production of organic acids results in fall in pH and increase in acidity. The viable yeast count also increases and at a certain stage it reaches a plateau and then decreases. These changes may vary depending on fruit juice composition, stages of fermentation, pH and temperature of incubation. All these factors are characteristics of yeast strain and composition of fermentation medium. In the present work, efforts have been made to monitor these variations and their effect on wine quality and acceptability has been recorded.
Screening of yeast strains S. cerevisiae 3304, 4787 and 3604 for wine production from Jamun juice
Strains : 3304 (I) 4787 (II) 3604 (III)
Inoculum level : 5%
Three different wine yeasts strains viz S. cerevisiae 3304, 4787 and 3604 were first screened for their ability to produce wine using Jamun juice with respect to sugar utilization, alcohol production and yeast viable count.
T.S.S.
Results pertaining to progress of fermentation of Jamun juice are shown in table 1 it is evident from the data that fermentation was faster during second and fourth day of fermentation. The reason probably could be the high nutrient level and low alcohol content in fermentation medium. During this period decline in oBrix with proportionate increase in alcohol content was observed. Similar observations have been reported by Chavan (2008); Joshi et al. (1997). However, there was faster decrease in oBrix in case of strain I and lesser in case of strain III. Effect of temperature was also found to be significant. The fall in oBrix was faster at higher temperature i.e. at 25oC as compared to 15oC.
Table (1):
Effect of different strains on the brix of Jamun juice at different temperature during fermentation.
| Strain→ | I | II | III | F.T × T | |||||||||
|---|---|---|---|---|---|---|---|---|---|---|---|---|---|
| Temperature → | 15oC | 25oC | Mean | 15oC | 25oC | Mean | 15oC | 25oC | Mean | 15oC | 25oC | Mean | |
| Fermentation time (Days) |
0 | 20 | 20 | 20 | 20 | 20 | 20 | 20 | 20 | 20 | 20 | 20 | 20 |
| 2 | 16 | 15.9 | 15.9 | 16.4 | 16.2 | 16.3 | 19 | 18.8 | 18.9 | 17.1 | 16.9 | 17 | |
| 4 | 7 | 5.6 | 6.3 | 8.0 | 5.6 | 6.8 | 14.6 | 14 | 14.3 | 9.8 | 8.4 | 9.1 | |
| 6 | 6 | 5 | 5.5 | 6 | 5 | 5.5 | 10 | 7.4 | 8.7 | 7.3 | 5.8 | 6.5 | |
| 8 | 6 | 5 | 5.5 | 6 | 5 | 5.5 | 7 | 6 | 6.5 | 6.3 | 5.3 | 5.8 | |
| Mean | 11 | 10.3 | 10.7 | 11.2 | 10.3 | 10.8 | 14.1 | 13.2 | 13.7 | 12.1 | 11.3 | 11.7 | |
CD at 5% Fermentation time (F.T) : 0.09; Temperature (T) : 0.06; Strain (S) : 0.07; S × T : 0.09 ;
F.T × T : 0.12; F.T × S : 0.15; F.T × S × T : 0.22
pH
Table 2 reveals that there was significant effect of temperature and strains on the pH of the fermentation medium during fermentation. In case of strain II the pH decrease from 4.5 to 3.5 which was lower as compared to other two strains (4.5-3.9). The possible reason could be production of organic acids as a result of metabolism of sugar by yeast during fermentation. This observation is in accordance with those of Chowdhury and Ray (2007); Shukla et al. (1991).
Table (2):
Effect of different strains on the pH of Jamun juice at different temperature during fermentation.
| Strain→ | I | II | III | F.T × T | |||||||||
|---|---|---|---|---|---|---|---|---|---|---|---|---|---|
| Temperature → | 15oC | 25oC | Mean | 15oC | 25oC | Mean | 15oC | 25oC | Mean | 15oC | 25oC | Mean | |
| Fermentation time (Days) |
0 | 4.5 | 4.5 | 4.5 | 4.5 | 4.5 | 4.5 | 4.5 | 4.5 | 4.5 | 4.5 | 4.5 | 4.5 |
| 2 | 4.4 | 4.3 | 4.3 | 4.3 | 4.4 | 4.3 | 4.4 | 4.4 | 4.4 | 4.4 | 4.4 | 4.4 | |
| 4 | 4.3 | 4.2 | 4.2 | 4.2 | 3.7 | 3.9 | 4.3 | 4.3 | 4.3 | 4.2 | 4.1 | 4.1 | |
| 6 | 4.2 | 4.2 | 4.2 | 4.2 | 3.5 | 3.8 | 4.2 | 4.0 | 4.1 | 4.2 | 3.9 | 4.1 | |
| 8 | 3.9 | 3.9 | 3.9 | 3.8 | 3.3 | 3.5 | 4.0 | 3.9 | 3.9 | 3.9 | 3.7 | 3.8 | |
| Mean | 4.3 | 4.2 | 4.2 | 4.2 | 3.9 | 4.0 | 4.3 | 4.2 | 4.3 | 4.2 | 4.1 | 4.2 | |
C.D at 5% Fermentation time (F.T) : 0.06 ; Strain (S) : 0.04 ; Temperature : 0.04;
F.T × S : 0.09; F.T × T : 0.08; S × T : 0.06; F.T × S × T : 0.14
Alcohol (%)
Increased in alcohol level during fermentation is presented in table 3. It was observed that the strain II produced more alcohol (11.3%) as compared to strain I (10.0%) and strain III (9%). Although in normal cases it should have been around 12%-14%. The probable reason of observed result could be high level of residual (non-fermentable) sugar (~6%) in the final product. This is expected in fruit juice having relatively lower levels reducing sugars. Alcohol production was found to be faster at 25oC as compared to 15oC in the initial stages. But at the end of fermentation there was no significant effect of temperature on alcohol content of the wine. Interaction of strain, temperature and fermentation time were found to be significant. Chowdhury and Ray (2007) observed 6% alcohol in Jamun wine. This was probably due to low T.S.S (16.5oBrix) in Jamun juice.
Table (3):
Effect of different strains on the alcohol (%) of Jamun wine at different temperature during fermentation.
| Strain→ | I | II | III | F.T × T | |||||||||
|---|---|---|---|---|---|---|---|---|---|---|---|---|---|
| Temperature → | 15oC | 25oC | Mean | 15oC | 25oC | Mean | 15oC | 25oC | Mean | 15oC | 25oC | Mean | |
| Fermentation time (Days) |
2 | 2.6 | 3.0 | 2.8 | 2.7 | 3.8 | 3.2 | 1.6 | 1.6 | 1.6 | 2.3 | 2.8 | 2.6 |
| 4 | 4.0 | 5.1 | 4.6 | 4.0 | 6.0 | 5.0 | 3.0 | 3.0 | 3.0 | 3.6 | 4.7 | 4.2 | |
| 6 | 9.4 | 10.0 | 9.7 | 10.1 | 11.3 | 10.7 | 7.1 | 7.0 | 7.0 | 8.9 | 9.4 | 9.2 | |
| 8 | 10.0 | 10.0 | 10.0 | 11.0 | 11.3 | 11.1 | 9.0 | 9.0 | 9.0 | 10.0 | 10.1 | 10.1 | |
| Mean | 6.52 | 7.05 | 6.79 | 6.95 | 8.11 | 7.53 | 5.17 | 5.17 | 5.17 | 6.22 | 6.78 | 6.50 | |
C.D at 5% Fermentation time (F.T) : 0.12; Strain (S) : 0.10; Temperature (T) : 0.08; F.T × S : 0.20; F.T × T : 0.17; S × T : 0.14; F.T × S × T : 0.29
Yeast viable count (CFU/ml)
Table 4 reveals that higher temperature (25oC) favoured yeast multiplication in the initial stages of fermentation but at the end of fermentation (8th day) viable cell count decreased probably due to inhibitory action of alcohol. Similar observations have also been reported by Charoenchai et al. (1998).
Table (4):
Effect of different treatments on viable yeast count (CFU/ml) during fermentation of Jamun wine.
| Strain→ | I | II | III | ||||
|---|---|---|---|---|---|---|---|
| Temperature → | 15oC | 25oC | 15oC | 25oC | 15oC | 25oC | |
| Fermentation time (Days) |
0 | 8.0×10⁶ | 8.5×10⁶ | 9.0×10⁶ | 1.0×10⁷ | 1.1×10⁷ | 1.8×10⁷ |
| 2 | 1.8×10⁸ | 2.5×10⁸ | 1.3×10⁸ | 1.5×10⁸ | 1.2×10⁸ | 1.3×10⁸ | |
| 4 | 2.6×10⁸ | 3.5×10⁸ | 2.1×10⁸ | 2.5×10⁸ | 1.9×10⁸ | 2.0×10⁸ | |
| 6 | 7.8×10⁷ | 1.0×10⁸ | 8.8×10⁷ | 1.4×10⁸ | 1.3×10⁸ | 9.1×10⁷ | |
| 8 | 2.5×10⁷ | 4.0×10⁶ | 4.1×10⁷ | 1.4×10⁷ | 3.0×10⁷ | 2.5×10⁷ | |
Wine yeast strain 4787 was selected as best strain on the basis of fermentation rate and final alcoholic content of wine. This strain was used for experiment carried out to investigate the effect of inoculum levels (2.5%, 5% and 7.5%) on the wine.
Effect of inoculum level
T.S.S and pH
It was observed that fermentation was faster in fermentation medium inoculated with 7.5% inoculum level as compared to 2.5% (table 5). This was due to higher yeast count. However, at the end of fermentation inoculum level has no significant effect on oBrix. It could be due to production of more alcohol earlier in case of 7.5% as compared to 2.5% inoculum level.
Table (5):
Effect of inoculum level on the brix of Jamun juice at different temperature during fermentation.
| Inoculum Level→ | 2.5% | 7.5% | F.T × T | |||||||
|---|---|---|---|---|---|---|---|---|---|---|
| Temperature → | 15oC | 25oC | Mean | 15oC | 25oC | Mean | 15oC | 25oC | Mean | |
| Fermentation time (Days) |
0 | 20 | 20 | 20 | 20 | 20 | 20 | 20 | 20 | 20 |
| 2 | 14 | 12 | 13 | 14 | 12 | 13 | 14 | 12 | 13 | |
| 4 | 10 | 8 | 9 | 8 | 7 | 7.9 | 9 | 7.5 | 8 | |
| 6 | 6 | 6 | 6 | 6 | 6 | 6 | 6 | 6 | 6 | |
| 8 | 6 | 6 | 6 | 6 | 6 | 6 | 6 | 6 | 6 | |
| Mean | 11.2 | 10.4 | 10.8 | 10.9 | 10.2 | 10.6 | 11.0 | 10.3 | 10.6 | |
CD at 5% Fermentation time (F.T) : 0.11; Inoculum level (I.L) : 0.07; Temperature (T) : 0.07; F.T × I.L : 0.16 F.T × T : 0.16 ; I.L× T : N.S; F.T × I.L × T ; N.S
The inoculum level had no significant effect on the final pH of the medium (table 6).
Table (6):
Effect of inoculum level on pH of Jamun juice at different temperature during fermentation.
| Inoculum Level→ | 2.5% | 7.5% | F.T × T | |||||||
|---|---|---|---|---|---|---|---|---|---|---|
| Temperature → | 15oC | 25oC | Mean | 15oC | 25oC | Mean | 15oC | 25oC | Mean | |
| Fermentation time (Days) |
0 | 4.4 | 4.5 | 4.5 | 4.4 | 4.5 | 4.5 | 4.5 | 4.5 | 4.5 |
| 2 | 4.4 | 4.4 | 4.4 | 4.4 | 4.4 | 4.4 | 4.4 | 4.4 | 4.4 | |
| 4 | 4.3 | 4.3 | 4.3 | 4.3 | 4.3 | 4.3 | 4.3 | 4.3 | 4.3 | |
| 6 | 4.0 | 3.8 | 3.9 | 4.2 | 3.9 | 4.0 | 4.1 | 3.8 | 3.9 | |
| 8 | 4.0 | 3.8 | 3.9 | 4.2 | 3.9 | 4.0 | 4.1 | 3.8 | 3.9 | |
| Mean | 4.3 | 4.2 | 4.2 | 4.3 | 4.2 | 4.3 | 4.2 | 4.3 | 4.2 | |
CD at 5%; Fermentation time (F.T) : 0.01; Inoculum level (I.L) : 0.01 ; Temperature (T) : 0.01; F.T × I.L : 0.01; F.T × T : 0.01; I.L× T : 0.01; F.T × I.L × T : 0.01
Total sugars
Table 7 shows the decrease in total sugar content of fermentation medium during fermentation. The residual sugar was in range of 35-43 g/l in wine prepared from juice inoculated with 2.5% inoculum level as compared to juice with 7.5% inoculum level (36-40 g/l). This may be due to the higher yeast count in case of 7.5% inoculum level which utilizes more sugar as compared to lower yeast count in case of 2.5% inoculum level.
Table (7):
Effect of Inoculum level on total sugar (g/l) of Jamun juice at different temperature during fermentation.
| Inoculum Level→ | 2.5% | 7.5% | F.T × T | |||||||
|---|---|---|---|---|---|---|---|---|---|---|
| Temperature → | 15oC | 25oC | Mean | 15oC | 25oC | Mean | 15oC | 25oC | Mean | |
| Fermentation time (Days) |
0 | 178 | 180 | 179 | 182 | 172 | 177 | 180 | 176 | 178 |
| 2 | 110 | 85 | 97 | 92 | 81 | 87 | 101 | 83 | 92 | |
| 4 | 65 | 50 | 57 | 61 | 60 | 61 | 63 | 55 | 58 | |
| 6 | 58 | 39 | 49 | 47 | 41 | 44 | 53 | 40 | 47 | |
| 8 | 43 | 35 | 39 | 40 | 36 | 38 | 42 | 36 | 39 | |
| Mean | 90.9 | 78.0 | 84.4 | 84.7 | 78.2 | 81.4 | 87.8 | 78.1 | 82.9 | |
CD at 5%; Fermentation time (F.T) : 2.04; noculum level (I.L) : 1.26; Temperature (T) : 1.26; F.T × I.L : N.S; F.T × T : 2.90; I.L× T : 1.83; F.T × I.L × T : 4.10
Alcohol (%)
Gradual increase in alcohol content was observed during fermentation (table 8). Alcohol content was lower in wine prepared with 7.5% inoculum level (8.5%) as compared to 2.5% and 5% inoculum level (9% and 11%respectively). This may be due to the decrease in yeast activity due to earlier production of alcohol in case of 7.5 % inoculum level. The higher alcohol level in wine with 5% inoculum level probably could be due to optimum utilization of sugar as compared to sugar utilization in case of 2.5% inoculum level. The interaction of inoculum level, fermentation time and temperature was found to be significant. The above results are in agreement with reports of Borate et al. (2008).
Table (8):
Effect of Inoculum level on alcohol content (%) of Jamun wine at different temperature during fermentation.
| Inoculum Level→ | 2.5% | 7.5% | F.T × T | |||||||
|---|---|---|---|---|---|---|---|---|---|---|
| Temperature → | 15oC | 25oC | Mean | 15oC | 25oC | Mean | 15oC | 25oC | Mean | |
| Fermentation time (Days) |
2 | 1.6 | 2.2 | 1.9 | 1.6 | 3.0 | 2.3 | 1.6 | 2.6 | 2.1 |
| 4 | 2.3 | 4.5 | 3.4 | 2.0 | 3.5 | 2.8 | 2.2 | 4.0 | 3.1 | |
| 6 | 7.0 | 7.5 | 7.2 | 7.0 | 7.8 | 7.4 | 7.0 | 7.6 | 7.3 | |
| 8 | 9.0 | 9.0 | 9.0 | 8.0 | 9.0 | 8.5 | 8.5 | 9.0 | 8.8 | |
| Mean | 4.9 | 5.8 | 5.4 | 4.6 | 5.8 | 5.3 | 4.8 | 5.8 | 5.3 | |
CD at 5%; Fermentation time (F.T) : 0.20; Inoculum level (I.L) : 0.14; Temperature (T) : 0.14; F.T × I.L : 0.28; F.T × T : 0.28; I.L× T : 0.20; F.T × I.L × T : 0.39
It was observed that 2.5% inoculum level was sufficient to produce alcohol. But to avoid the contamination in the juice was inoculated with 7.5% inoculum level. At such high inoculum level yeast growth dominates the growth of other contaminants or prevents the growth of other microbes.
On the basis of chemical analysis it was found that strain S. cerevisiae 4787, 7.5% inoculum level and 25oC fermentation temperature were best treatments for preparation of wine. The wine was evaluated chemically (table 9) as well as organoleptically (at 0, 30 and 60 day) (table 10).
Table (9):
Chemical composition of Jamun wine.
Parameters |
Mean*±S.D Jamun wine |
|---|---|
T.S.S(ºBrix) |
6 |
pH |
4.2±0.03 |
Acidity (%) |
0.70±0.01 |
Total sugar(g/l) |
42±0.02 |
Reducing sugar (g/l) |
35±0.02 |
Phenols (mg/100ml) |
60±0.04 |
Anthocyanins (mg/100ml) |
60±.4.50 |
Alcohol (%) |
8 ±0.02 |
*The values are mean of three replications.
Table (10):
Effect of different treatments on organoleptic quality of Jamun wine.
Storage time (Days)¯ |
Color/ appearance (20) |
Taste (20) |
Body (20) |
Aroma (20) |
Astringency (20) |
Overall acceptability |
|---|---|---|---|---|---|---|
0 |
16.8 ±0.9 |
12.9 ±0.3 |
16.1 ±0.3 |
14.5 ±0.5 |
8.7 ±0.4 |
69.0 ±1.4 |
30 |
18.4 ±0.2 |
14.9 ±0.4 |
17.4 ±0.4 |
14.5 ±0.3 |
8.9± 0.2 |
74.1 ±0.8 |
60 |
17.7 ±0.4 |
15.8± 0.2 |
18.0 ±0.4 |
16.0 ±0.3 |
14.1 ±0.7 |
81.6 ±1.2 |
CD (< 0.05%) |
N.S. |
0.9 |
1.2 |
1.3 |
1.5 |
3.8 |
It was observed that Jamun wine was acceptable to all panellists in spite of its higher astringency which is due to the presence of phenolic compounds. It was also observed that on prolonged storage the acceptability of wine increased due to reduction of phenolic compounds and yeast odour on storage. Shukla et al. (1991) reported that Jamun wine got 83 organoleptic score on 100 point score card. However, Borate et al. (2008) studied the wine prepared from Jamun juice with treatments, 24 oBrix TSS, 7.5% inoculum level and 15 fermentation days and reported that wine got 17.93 overall acceptability score out of 20.
Based on our results, it has been concluded that out of three strains tested strain S. cerevisiae 4787 is suitable for fermentation of Jamun juice as the final alcohol percentage was higher as compared to other strains at the end of eight days of fermentation. There was no significant effect of inoculum level on the fermentation rate and quick fermentation was found at 25oC. Jamun wine was found to be quite acceptable and observed that acceptability increased with storage.
However, considering the therapeutic and medicinal value of Jamun for diabetic persons and short shelf life of Jamun, it can be used for preparation of wine as all the nutrients of fruits are retained in wine after fermentation of fruit juice. Finally it can be concluded that Jamun fruit can be utilized for wine making process to provide a new value product from Jamun.
- AOAC, Official Methods of Analysis. Association of Official Analytical Chemists. Washington DC 1990.
- Baliga, M. S., Bhat, H. P., Baliga, B. R. V., Wilson, R., & Palatty, P. L. Phytochemistry, traditional uses and pharmacology of Eugenia jambolana Lam. (black plum). Food Research International, 2011; 44: 1776-1789.
- Borate, S. R., Kotecha, P. M., & Chavan, J. K. Standardization of wine making technology from Jamun juice. Beverage and Food World, 2008; 35(11), 42-43.
- Budak, H. N., & Guzel-Seydim, Z. B. Antioxidant activity and phenolic content of wine vinegars produced by two different techniques. Journal of the Science of Food and Agriculture, 2010; 90: 2021-2026.
- Caputi, A., Ueda, M., & Brown, T. Spectrophotometric determination of ethanol in wine. American Journal of Enology and Viticulture, 1968; 26: 160.
- Charoenchai, C., Fleet, G. H., & Henschke, P. A. Effects of temperature, pH, and sugar concentration on the growth rates and cell biomass of wine yeasts. American Journal of Enology and Viticulture, 1998; 49(3), 283-287.
- Chavan, U. D. Fruit based fermented beverages. Beverage and Food World, 2008; 38(1), 40-43.
- Chowdhury, P., & Ray, R. C. Fermentation of Jamun (Syzygium cuminii L.) fruits to form red wine. ASEAN Food Journal, 2007; 14(1), 15-23.
- Das, J. N. Studies on storage stability of jamun beverages. Indian Journal of Horticulture, 2009; 66(4), 508-510.
- Glampedaki, P., Hatzidimitriou, E., Paraskevopoulou, A., & Koemtzopoulou, P. S. Surface tension of still wines in relation to some of their constituents: A simple determination of ethanol content. Journal of Food Composition and Analysis, 2010; 23: 373-381.
- Janick, J., & Paull, R. E. Syzygium cuminii L. Skeels. The Encyclopedia of Fruits and Nuts. Cambridge University Press, Cambridge. 2008; pp 552.
- Joshi, V. K., & Attri, B. L. Importance of fruit based fermented beverage in India. Beverage and Food World, 1990; 17(4): 9-10.
- Joshi, V. K., Thakur, N. K., & Lal, B. B. Effect of debittering of kinnow juice on physico-chemical and sensory quality of kinnow wine. Indian Food Packer, 1997; 51(4), 5-10.
- Kanner, J., Frankell, E., Granit, R., German, B., & Kinsella, J. E. Natural antioxidants in grapes and wines. Journal of Agricultural and Food Chemistry, 1994; 42: 64-69.
- Kraus, E. C. Home wine and beer making supplies 2003. http:/www.eckraus.com.
- Lane, J. H., & Eynon, J. Determination of reducing and total sugars by Fehling solution with methylene blue as indicator. Journal Society of Chemical Industry, 1923; 42: 32.
- Prasad, S., & Kumar, U. A handbook of fruit production. Agrobios: Agrohouse,2010; (Chapter 17).
- Rai, D. R., Chadha, S., Kaur, M. P., Jaiswal, P., & Patil, R. T. Biochemical, microbiological and physiological changes in jamun (Syzygium cuminii L.) kept for long term storage under modified atmosphere packaging. Journal of Food Science and Technology, 2011; 48(3): 357-365.
- Shukla, K. G., Joshi, M. C., Yadav, S., & Bisht, N. S. Jambal wine making- Standardization of a methodology and screening of cultivars. Journal of Food Science and Technology, 1991; 28(3): 142-144.
- Simonetti, P., Pietta, P., & Testolin, G. Polyphenol content and total antioxidant potential of selected Italian wines. Journal of Agricultural and Food Chemistry, 1997; 45(4): 1152-1155.
© The Author(s) 2017. Open Access. This article is distributed under the terms of the Creative Commons Attribution 4.0 International License which permits unrestricted use, sharing, distribution, and reproduction in any medium, provided you give appropriate credit to the original author(s) and the source, provide a link to the Creative Commons license, and indicate if changes were made.