

ISSN: 0973-7510
E-ISSN: 2581-690X
Tea is an agricultural product of the leaves, tea buds and inter-nodes of the Camellia sinensis plant. This study was done to estimate caffeine in different types of decaffeinated tea and coffee brands available in Pakistan’s market by High Performance Liquid Chromatography. In this study standard calibration curve of caffeine produced a straight line (R2 = 0.999). . The 0.2% w/v PQC was used and showed retention time of caffeine at 8.665 minutes and IS at 5.337. It was estimated that 0.1807% caffeine present in the positive quality control which provide the mean of the reliability of the performance of the procedure. Total of six brands comprising of 30 decaffeinated samples were selected for the estimation of caffeine. Among all only four (ABS 3, 24, 27 and 28) produced no peak of analyte representing complete decaffeinated product. Possibly, limited sensitivity of instrument may have produced these results but, these are the brands that contain much lesser amount of caffeine as compare to the other brands. Among all 30 decaffeinated samples only (ABS 19) has observed the maximum 0.03% of caffeine and the minimum quantity of caffeine 0.0001% in one sample (ABS 23) was estimated.
Caffeine; Coffee; Tea; Pakistan; High Performance Liquid Chromatography.
Tea and coffee produces stimulating effect which is because of purine bases that are caffeine, theophylline and theobromine. Other method by which caffeine is obtained is methylation of theobromine. Tea alkaloids are quantified by numerous methods. 3-4% of Caffeine is present in tea which is the major alkaloid (1). Based on the data reviewed, the study showed that coffee produces various effects on health and these effects increase the alertness, change the mood, hyperactivity, Parkinson’s disease, gallstones, diabetes, and also have effect of liver function. Similarly high doses produce adverse effects in some individuals who are sensitive like tachycardia, anxiety and insomnia (2)(3)(4)(5). The healthy individuals may take less than 300-500 mg of caffeine, children should restrict to 50 mg daily and woman should be restricted to 150-200 mg daily. The objective of the study was Estimation of the amount of caffeine in decaffeinated coffee and tea by using HPLC.
Experimental design
Decaffeinated coffee and tea were collected from various super stores to estimate the concentration of caffeine. The concentrations of samples were estimated by high performance liquid chromatography done by photo diode array detector (SPD-M20A). Six types of brands were selected for estimation of caffeine. These samples were collected from local market. Samples were collected from capital cities of provinces of Pakistan. Samples were purchased from local market where available. Thirty two samples were collected from each brand in which seven samples for decaffeinated tea and twenty five samples for decaffeinated coffee. Five samples from each brand of decaffeinated coffee were collected and seven samples of decaf tea were collected.
Chemicals
Caffeine Standard (Standpharm Pakistan (Pvt.) Ltd.), Acetaminophen as IS (Standpharm Pakistan (Pvt.) Ltd.), Decaffeinated coffee and tea , Calcium hydroxide (M.W. 74.09, assay 98%, BDH Laboratory Supplies, England), Magnesium Sulphate (M.W 120.37, Assay 98%, Scharlab S.L. Cisa, made in European Union), Dichloromethane HPLC grade (M.W 84.93, Assay 99.8%, Koch-Light Ltd., England), Methanol HPLC/Spectro Grade (M.W 32.0, Assay 99.9%, MP Biomedicals, LLC, France), Acetonitrile HPLC/Spectro Grade (M.W 41.1, Assay 99.9%, MP Biomedicals, LLC, France), Potassium dihydrogen phosphate (98-100.5%, Riedel de haen, RdH Laborchemikalion GmbH & Co.), HPLC grade Water, Distilled water
Instrument
High Performance Liquid Chromatograph was used. Shimadzu HPLC system fitted with autosampler (SIL-20A), reciprocating pump (LC-20AT), solvent delivery system (LC-20A) with system controller (CBM-20A), detection was done by a photo diode array detector (SPD-M20A) at wavelength of 215 nm and Merck C18 column (15 cm x 3.9 mm x 5u) was used.
Preparation of Standard (Stock Solution)
In order to prepare 1000 ppm solution, 1000 mg of caffeine was dissolved in 500 mL of distilled water and in the end make up the final volume 1000 mL in the volumetric flask. Dilutions were prepared from 20,40,60,80,100,120 ppm.
Preparation of Internal Standard (IS)
Acetaminophen was used as IS. It is not present in brands of decaffeinated coffee and tea. Further, it produced reproducible results.
Preparation of Stock IS Solution
In order to prepare 100 mL of 1000 ppm IS solution, 100 mg of IS was dissolved in 50 mL of Methanol and in the end made up the final volume 100 mL in the volumetric flask.
Preparation of Working IS Solution
In order to prepare 100 mL of 500 ppm solution, 50 mL of the stock IS solution was diluted with 30 mL of mobile phase in volumetric flask and, in the end, the final volume made up to 100 mL with mobile phase.
Retention Time Measurement
Retention time of target analyte (Caffeine) and internal standard (Acetaminophen) was determined by running 100 ppm solutions of each, separately, on HPLC.
Preparation of Positive Control
In order to prepare 100 mL of 0.2% w/v positive quality control, 200 mg of caffeine standard was accurately weighed and dissolved in 50 mL distilled water in volumetric flask and, in the end, the final volume made up to 100 mL with distilled water. The solution was refrigerated before use. This was a reference solution or test solution used for assessment of the performance of the procedure.
Preparation of Negative Control
Distilled water was used as negative control sample. It was caffeine free sample. This was a reference solution or test solution used for assessment of the performance of the procedure.
Preparation of Samples
Decaffeinated Tea sample preparation
1.5 gm of decaf tea was dissolved in 200 mL boiling distilled water; it gave light brown color to the solution. This solution was further processed for the estimation of caffeine.
Decaffeinated coffee sample preparation
1.5 gm of decaf Coffee which was dissolved in 200 mL boiling distilled water; it gave blackish brown color to the solution. This solution was further processed for the estimation of caffeine.
Procedure
Wanyika et al. 2010 procedure was used with slight changes in this research. 10ml volume of all calibrator, Positive QC, Negative QC and all samples was pipette out in 15 mL centrifuge tubes. 0.8 mL of IS was added to all tubes and vortexed to mix completely. This produced the final strength of 40 ppm of IS. Then 1 gm of calcium hydroxide was added in all tubes and vortexed. Then the resulting mixture was filter by using whattmann filter paper and then put it into separating funnel. 20 mL of DCM was added and rotated for 15 min to extract caffeine into DCM. DCM was separated from the aqueous phase into 100 mL flat bottom conical flask. This step was repeated two more times and separated DCM layer was added to already separate layer in 100 ml flat bottom conical flask. Then 3 gm of magnesium sulphate was added in each conical flask and mixed thoroughly. The resulting mixtures were filter using whattmann filter paper and the filtrates were dried by evaporation of DCM using rotary evaporator at room temperature. The dried extracts were dissolved in 10 mL of mobile phase and ran on HPLC.
Preparation of Mobile Phase
Altun (2002) used 0.01 M potassium dihydrogen phosphate-methanol-acetonitrile-isopropyl alcohol (84: 4: 6: 6) mobile phase. The same mobile phase system was used with certain changes. 0.1M potassium dihydrogen phosphate-acetonitrile-methanol (60: 10: 30) was used as mobile phase having pH of 5.4.
Chromatographic Conditions
HPLC
Shimadzu HPLC system fitted with autosampler (SIL-20A), reciprocating pump (LC-20AT) and Merck C18 column (15 cm x 3.9 mm x 5u) was used for separation. A Shimadzu HPLC solvent delivery system controller (LC-20A) with system controller (CBM-20A) was used. The 20µL sample was used in injection system. Detection was done by photo diode array detector (SPD-M20A) at wavelength of 215 nm (Altun, 2002). Calculation was performed using following equation.
% recovery of sample (ppm)=(Recovered Concentration (ppm))/(% Recovery of IS) X 100 %
% of caffeine=(content of caffeine in sample (mg))/(mass of sample used (mg)) X 100
The calcium hydroxide precipitates the insoluble tannins salts by making the basic solution and it will remove all the interrupting materials that affect the solubility of caffeine. These beverages are prepared by simple water and caffeine can better be estimated by HPLC (Wanyika et. al 2010).
Standard Calibration Curve
Standard calibration curves were obtained which indicate a positive linear relationship between the concentration of caffeine standard (ppm) and area of peak (uV) (figure 4.1).
Table (4.1):
Mean area of standard calibrator solutions.
| Concentration (ppm) | Area Under Curve (AUC) | |||
|---|---|---|---|---|
| 1 | 2 | 3 | Mean | |
| 20 | 1846155 | 1846652 | 1846403 | 1846403 |
| 40 | 3479773 | 3479999 | 3479229 | 3479667 |
| 60 | 5293990 | 5293717 | 5294044 | 5293917 |
| 80 | 6926500 | 6926697 | 6926401 | 6926533 |
| 100 | 8786100 | 8786469 | 8786138 | 8786236 |
| 120 | 10685209 | 10684015 | 10686430 | 10685218 |
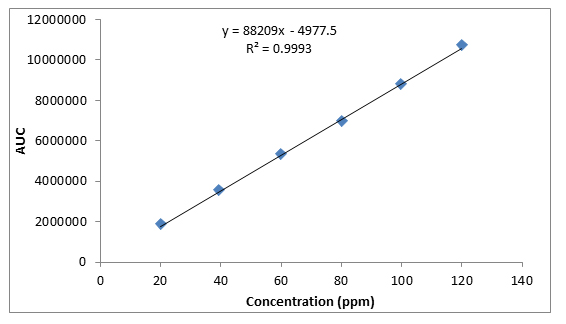
Fig. 4.1.Standard calibration curve of Caffeine
Retention Time Measurement
100 ppm of caffeine solution was run and it gave retention time of 8.532 min (figure 4.2). Further, 40 ppm solution of Acetaminophen (internal standard) produced a peak at 5.292 min showing its retention time (figure 4.3).
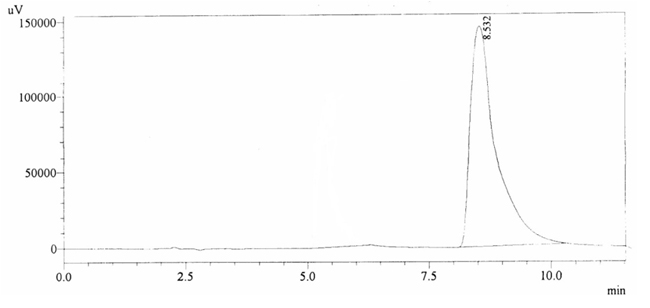
Fig. 4.2. Chromatogram of Retention time of Caffeine
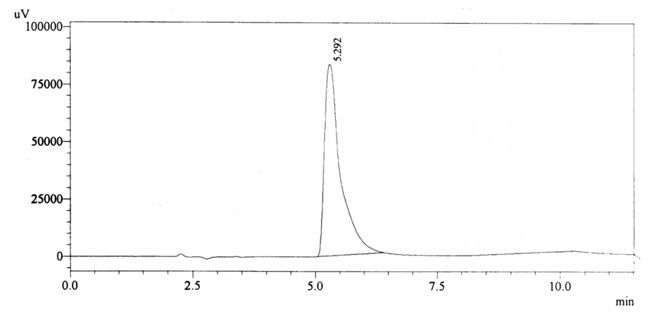
Fig. 4.3.Chromatogram of Retention time of Acetaminophen
Controls
Negative Quality Control
Negative QC gave retention time of 5.287 min and did not show caffeine peak (figure 4.4).
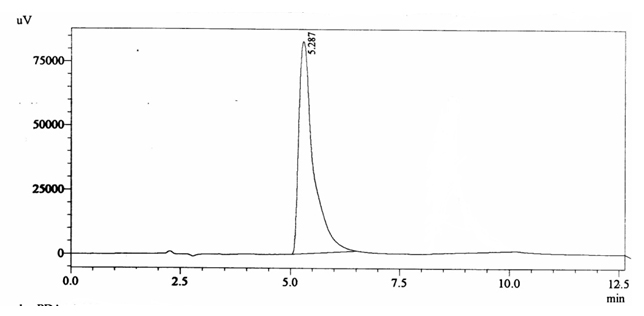
Fig. 4.4. Chromatogram of Negative Quality Control
Positive Quality Control
0.2% w/v caffeine solution was run and it gave retention time of 8.665 min and Acetaminophen (internal standard) produced a peak at 5.337 min showing its retention time (figure 4.5).
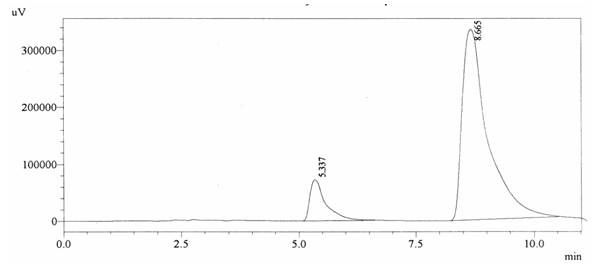
Fig. 4.5. Chromatogram of Positive Quality Control
Samples Profiles
Chromatographic profile of ABS 1
Sample ABS 1 was decaffeinated tea. Its chromatographic profile shows that AUC of the caffeine is 414079 and that of IS is 1487033 (figure 4.6). This concludes the concentration of caffeine as 0.0041%. Percentage content was calculated by using equation 2.
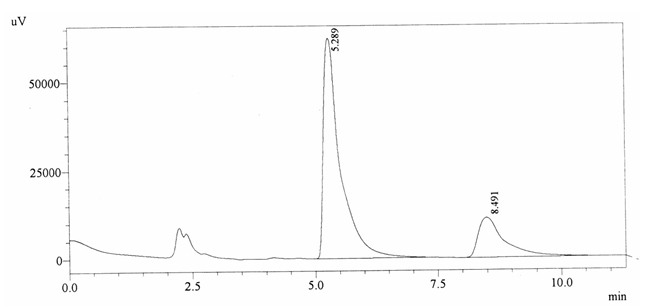
Fig. 4.6. Chromatogram of ABS 1
Chromatographic profile of ABS 2
Sample ABS 2 was decaffeinated tea. Its chromatographic profile shows that AUC of the caffeine is 42260 and that of IS is 1456377 (figure 4.7). This concludes the concentration of caffeine as 0.0005%. Percentage content was calculated by using equation 2.
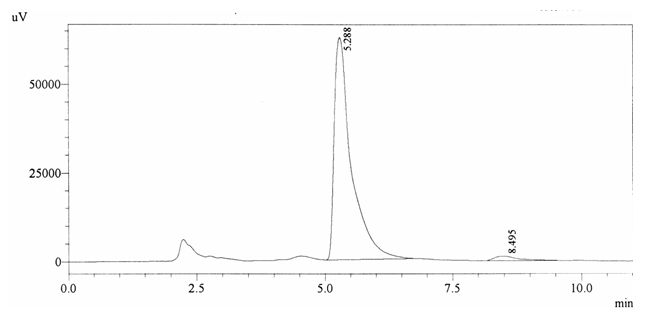
Fig. 4.7. Chromatogram of ABS 2
Chromatographic profile of ABS 3
Sample ABS 3 was decaffeinated tea. Its chromatographic profile shows that it does not contain caffeine as no peak of caffeine was detected in chromatogram and area of IS is 1433156 (figure 4.8). Percentage content was calculated by using equation 2.
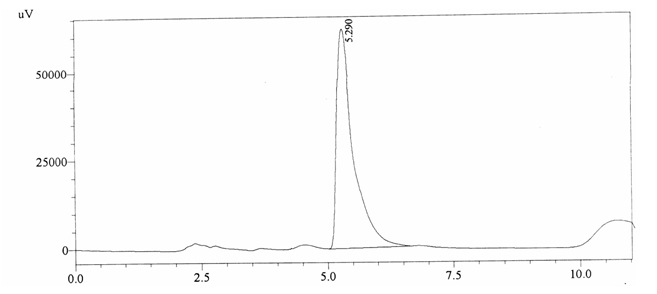
Fig. 4.8. Chromatogram of ABS 3
Chromatographic profile of ABS 4
Sample ABS 4 was decaffeinated tea. Its chromatographic profile shows that AUC of the caffeine is 210353 and that of IS is 1400856 (figure 4.9). This concludes the concentration of caffeine as 0.0022 %. Percentage content was calculated by using equation 2.
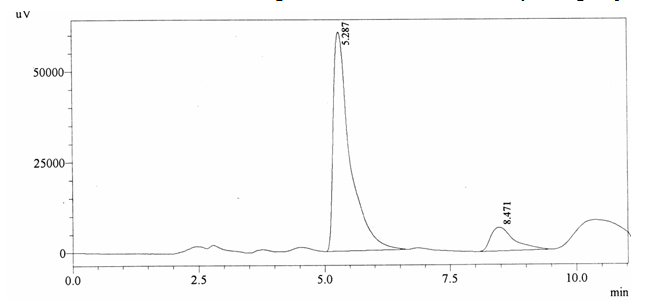
Fig. 4.9. Chromatogram of ABS 4
Chromatographic profile of ABS 5
Sample ABS 5 was decaffeinated tea. Its chromatographic profile shows that AUC of the caffeine is 585993 and that of IS is 1505178 (figure 4.10). This concludes the concentration of caffeine as 0.0057 %. Percentage content was calculated by using equation 2.
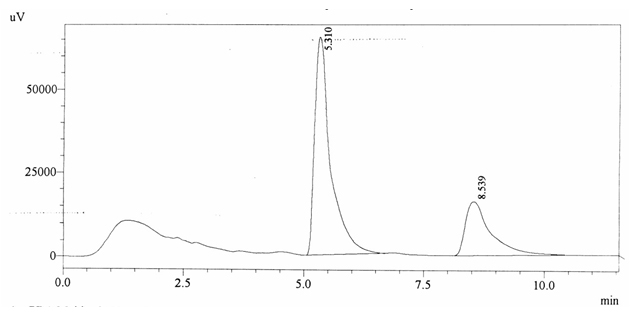
Fig. 4.10. Chromatogram of ABS 5
Chromatographic profile of ABS 6
Sample ABS 6 was decaffeinated tea. Its chromatographic profile shows that AUC of the caffeine is 42677 and that of IS is 1463847 (figure 4.11). This concludes the concentration of caffeine as 0.0005%. Percentage content was calculated by using equation 2.
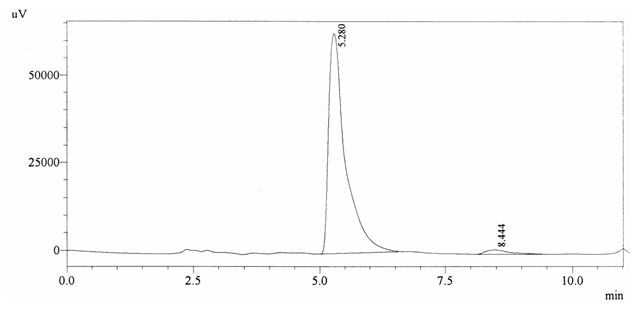
Fig. 4.11. Chromatogram of ABS 6
Chromatographic profile of ABS 7
Sample ABS 7 was decaffeinated tea. Its chromatographic profile shows that AUC of the caffeine is 449943 and that of IS is 1463093 (figure 4.12). This concludes the concentration of caffeine as 0.0045 %. Percentage content was calculated by using equation 2.
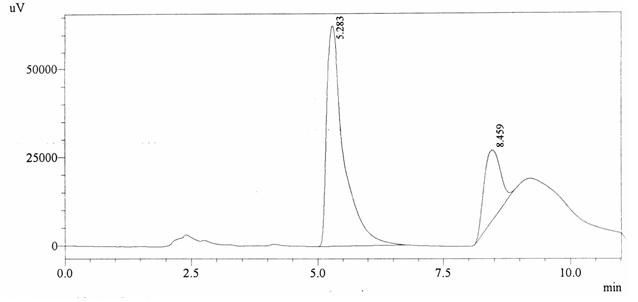
Fig. 4.12. Chromatogram of ABS 7
Chromatographic profile of ABS 8
Sample ABS 8 was decaffeinated tea. Its chromatographic profile shows that AUC of the caffeine is 376163 and that of IS is 1488142 (figure 4.13). This concludes the concentration of caffeine as 0.0037%. Percentage content was calculated by using equation 2.
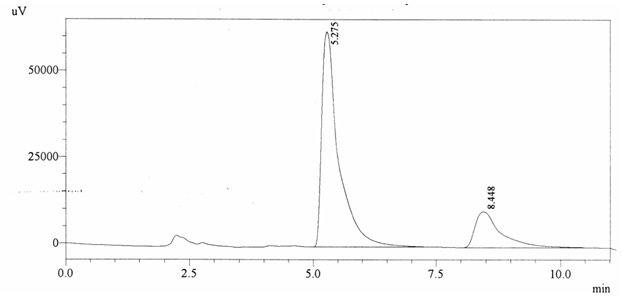
Fig. 4.13. Chromatogram of ABS 8
Chromatographic profile of ABS 9
Sample ABS 9 was decaffeinated tea. Its chromatographic profile shows that AUC of the caffeine is 466065 and that of IS is 1453861 (figure 4.14). This concludes the concentration of caffeine as 0.0047%. Percentage content was calculated by using equation 2.
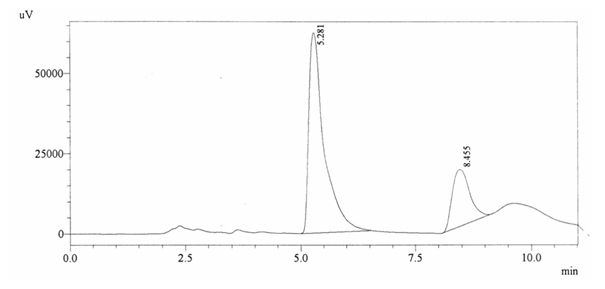
Fig. 4.14. Chromatogram of ABS 9
Chromatographic profile of ABS 10
Sample ABS 10 was decaffeinated coffee. Its chromatographic profile shows that AUC of the caffeine is 698053 and that of IS is 1450322 (figure 4.15). This concludes the concentration of caffeine as 0.0070%. Percentage content was calculated by using equation 2.
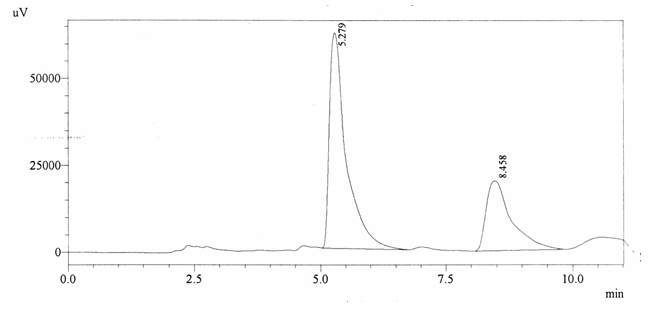
Fig. 4.15. Chromatogram of ABS 10
Chromatographic profile of ABS 11
Sample ABS 11 was decaffeinated coffee. Its chromatographic profile shows that AUC of the caffeine is 715896 and that of IS is 1430226 (figure 4.16). This concludes the concentration of caffeine as 0.0073%. Percentage content was calculated by using equation 2.
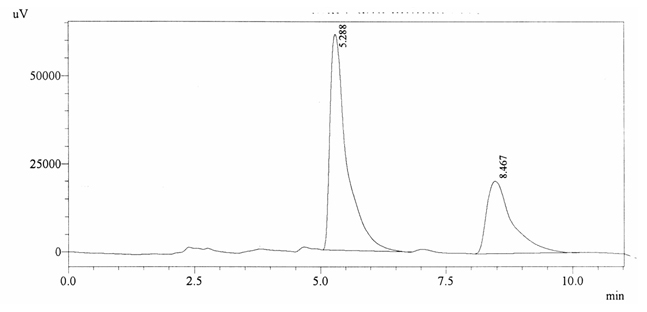
Fig. 4.16. Chromatogram of ABS 11
Chromatographic profile of ABS 12
Sample ABS 12 was decaffeinated coffee. Its chromatographic profile shows that AUC of the caffeine is 738364 and that of IS is 1418429 (figure 4.17). This concludes the concentration of caffeine as 0.0076%. Percentage content was calculated by using equation 2.
Fig. 4.17. Chromatogram of ABS 12
Chromatographic profile of ABS 13
Sample ABS 13 was decaffeinated coffee. Its chromatographic profile shows that AUC of the caffeine is 743689 and that of IS is 1408188 (figure 4.18). This concludes the concentration of caffeine as 0.0077%. Percentage content was calculated by using equation 2.
Fig. 4.18. Chromatogram of ABS 13
Chromatographic profile of ABS 14
Sample ABS 14 was decaffeinated coffee. Its chromatographic profile shows that AUC of the caffeine is 752031 and that of IS is 1456168 (figure 4.19). This concludes the concentration of caffeine as 0.0075%. Percentage content was calculated by using equation 2.
Fig. 4.19. Chromatogram of ABS 14
Chromatographic profile of ABS 15
Sample ABS 15 was decaffeinated coffee. Its chromatographic profile shows that AUC of the caffeine is 782295 and that of IS is 1452579 (figure 4.20). This concludes the concentration of caffeine as 0.0079%. Percentage content was calculated by using equation 2.
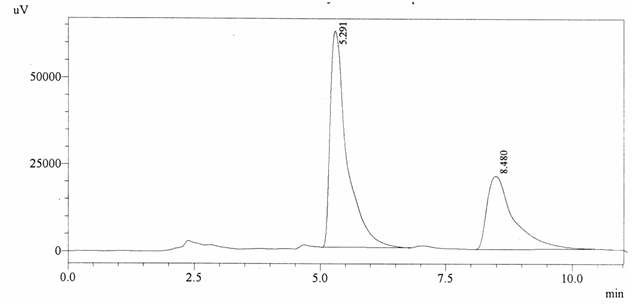
Fig. 4.20. Chromatogram of ABS 15
Chromatographic profile of ABS 16
Sample ABS 16 was decaffeinated coffee. Its chromatographic profile shows that AUC of the caffeine is 746385 and that of IS is 1439953 (figure 4.21). This concludes the concentration of caffeine as 0.0076%. Percentage content was calculated by using equation 2.
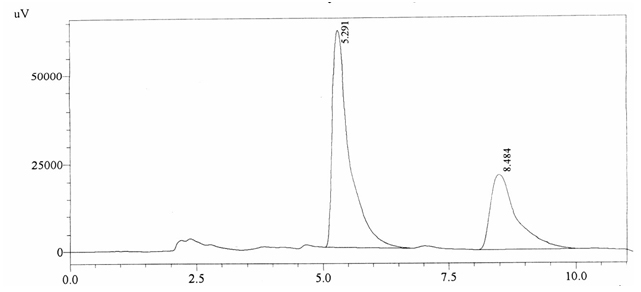
Fig. 4.21. Chromatogram of ABS 16
Chromatographic profile of ABS 17
Sample ABS 17 was decaffeinated coffee. Its chromatographic profile shows that AUC of the caffeine is 723797 and that of IS is 1438402 (figure 4.22). This concludes the concentration of caffeine as 0.0074%. Percentage content was calculated by using equation 2.
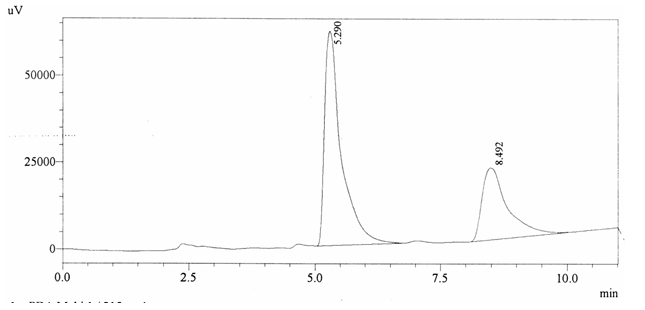 Fig. 4.22. Chromatogram of ABS 17
Chromatographic profile of ABS 18
Sample ABS 18 was decaffeinated coffee. Its chromatographic profile shows that AUC of the caffeine is 189870 and that of IS is 1448288 (figure 4.23). This concludes the concentration of caffeine as 0.0020%. Percentage content was calculated by using equation 2.
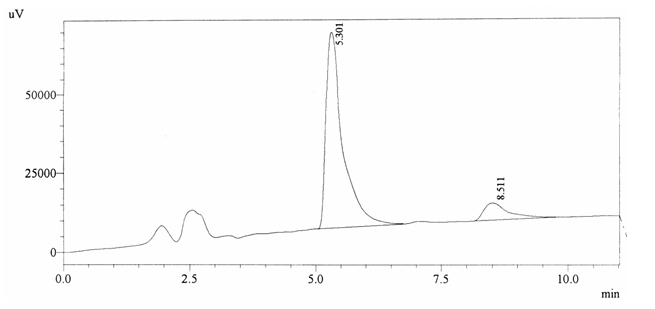
Fig. 4.23. Chromatogram of ABS 18
Chromatographic profile of ABS 19
Sample ABS 19 was decaffeinated coffee. Its chromatographic profile shows that AUC of the caffeine is 1836744 and that of IS is 1487337 (figure 4.24). This concludes the concentration of caffeine as 0.0180%. Percentage content was calculated by using
equation 2.
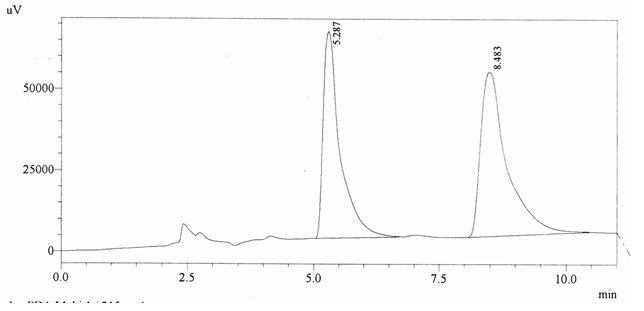
Fig. 4.24. Chromatogram of ABS 19
Chromatographic profile of ABS 20
Sample ABS 20 was decaffeinated coffee. Its chromatographic profile shows that AUC of the caffeine is 821681 and that of IS is 1300566 (figure 4.25). This concludes the concentration of caffeine as 0.0092%. Percentage content was calculated by using equation 2.
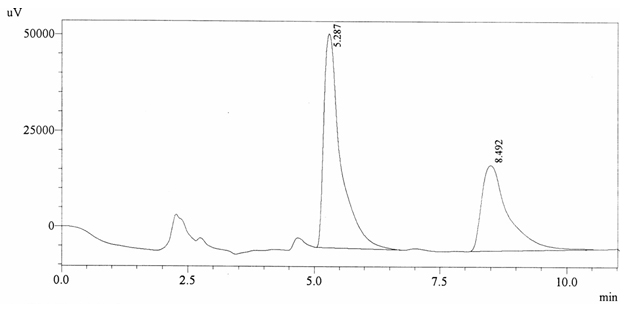
Fig. 4.25. Chromatogram of ABS 20
Chromatographic profile of ABS 21
Sample ABS 21 was decaffeinated coffee. Its chromatographic profile shows that AUC of the caffeine is 985347 and that of IS is 1413061 (figure 4.26). This concludes the concentration of caffeine as 0.0102%. Percentage content was calculated by using equation 2.
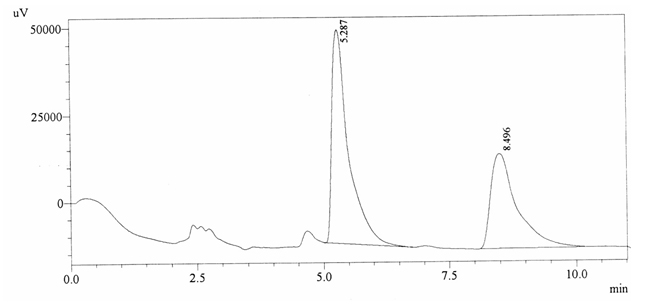
Fig. 4.26. Chromatogram of ABS 21
Chromatographic profile of ABS 22
Sample ABS 22 was decaffeinated coffee. Its chromatographic profile shows that AUC of the caffeine is 94776 and that of IS is 1485271 (figure 4.27). This concludes the concentration of caffeine as 0.0010%. Percentage content was calculated by using equation 2.
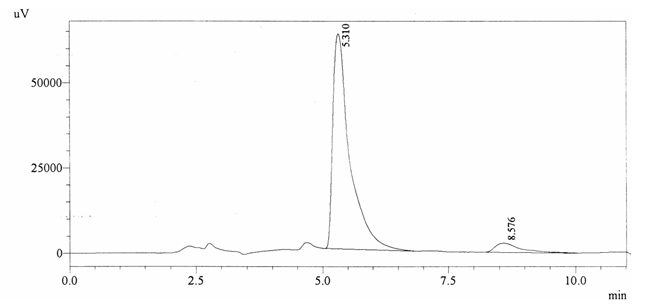
Fig. 4.27. Chromatogram of ABS 22
Chromatographic profile of ABS 23
Sample ABS 23 was decaffeinated coffee. Its chromatographic profile shows that AUC of the caffeine is 2546 and that of IS is 1534889 (figure 4.28). This concludes the concentration of caffeine as 0.0001%. Percentage content was calculated by using equation 2.
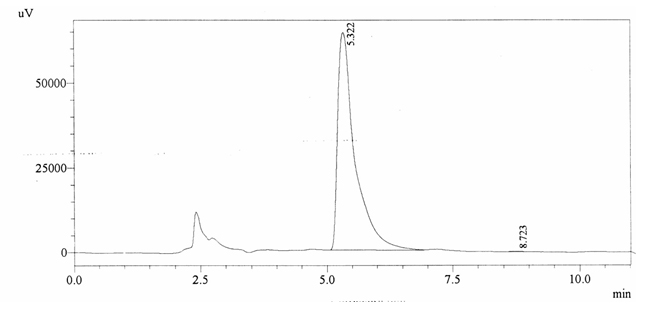
Fig. 4.28. Chromatogram of ABS 23
Chromatographic profile of ABS 24
Sample ABS 24 was decaffeinated coffee. Its chromatographic profile shows that it does not contain caffeine as no peak of caffeine was detected in chromatogram and area of IS is 1473169 (figure 4.29). Percentage content was calculated by using equation 2.
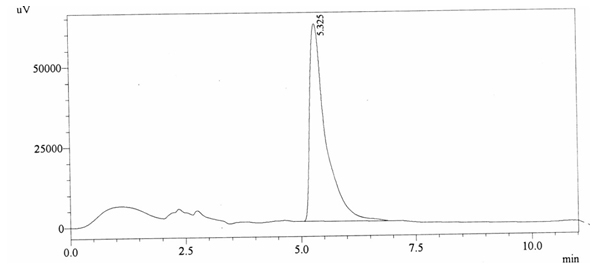
Fig. 4.29. Chromatogram of ABS 24
Chromatographic profile of ABS 25
Sample ABS 25 was decaffeinated coffee. Its chromatographic profile shows that AUC of the caffeine is 1040184 and that of IS is 1200902 (figure 4.30). This concludes the concentration of caffeine as 0.0126%. Percentage content was calculated by using equation 2.
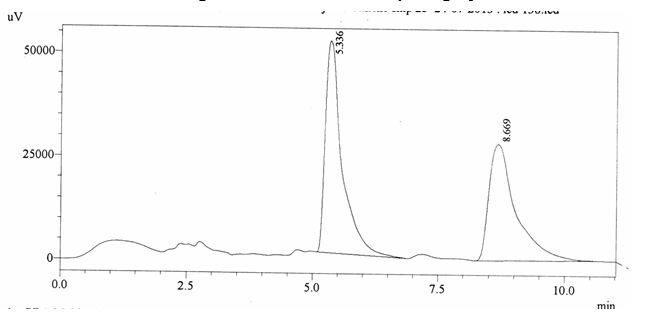
Fig. 4.30. Chromatogram of ABS 25
Chromatographic profile of ABS 26
Sample ABS 26 was decaffeinated coffee. Its chromatographic profile shows that AUC of the caffeine is 749238 and that of IS is 1787173 (figure 4.31). This concludes the concentration of caffeine as 0.0061%. Percentage content was calculated by using equation 2.
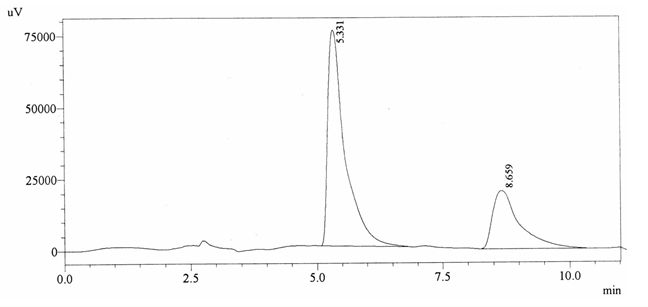
Fig. 4.31. Chromatogram of ABS 26
Chromatographic profile of ABS 27
Sample ABS 27 was decaffeinated coffee. Its chromatographic profile shows that it does not contain caffeine as no peak of caffeine was detected in chromatogram and area of IS is 1662634 (figure 4.32). Percentage content was calculated by using equation 2.
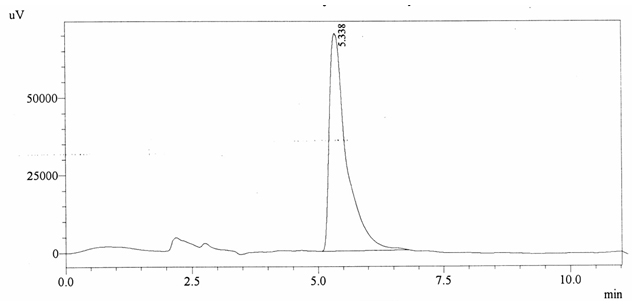
Fig. 4.32. Chromatogram of ABS 27
Chromatographic profile of ABS 28
Sample ABS 28 was decaffeinated coffee. Its chromatographic profile shows that it does not contain caffeine as no peak of caffeine was detected in chromatogram and area of IS is 1733439 (figure 4.33). Percentage content was calculated by using equation 2.
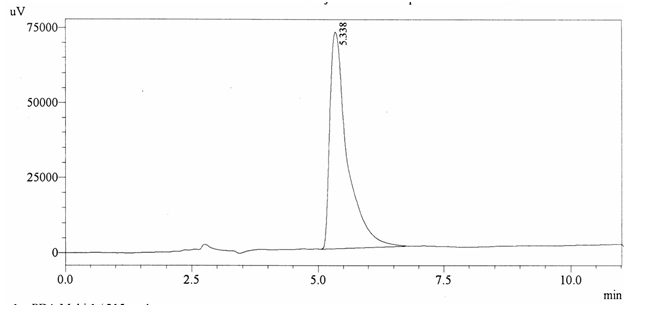
Fig. 4.33: Chromatogram of ABS 28
Chromatographic profile of ABS 29
Sample ABS 29 was decaffeinated coffee. Its chromatographic profile shows that AUC of the caffeine is 1054736 and that of IS is 1693898 (figure 4.34). This concludes the concentration of caffeine as 0.0091%. Percentage content was calculated by using equation 2.
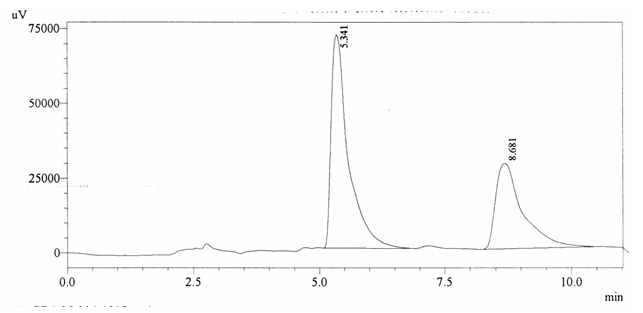
Fig. 4.34. Chromatogram of ABS 29
Chromatographic profile of ABS 30
Sample ABS 30 was decaffeinated coffee. Its chromatographic profile shows that AUC of the caffeine is 1149796 and that of IS is 1692019 (figure 4.35). This concludes the concentration of caffeine as 0.0099%. Percentage content was calculated by using
equation 2.
Fig. 4.35. Chromatogram of ABS 30
Table (4.2):
Calculations of caffeine content.
Sr.No |
Sample ID |
AUC |
Recovered Concentration
(ppm) |
*Actual Concentration
(ppm) |
¥ %age of caffeine in sample |
|---|---|---|---|---|---|
1 |
NQC |
0 |
0 |
0 |
0.0000 |
2 |
PQC |
12634943 |
143.295 |
162.62 |
0.1807 |
3 |
ABS 1 |
414079 |
4.751 |
6.13 |
0.0068 |
4 |
ABS 2 |
42260 |
0.536 |
0.71 |
0.0008 |
5 |
ABS 3 |
0 |
0.000 |
0.00 |
0.0000 |
6 |
ABS 4 |
210353 |
2.441 |
3.35 |
0.0037 |
7 |
ABS 5 |
585993 |
6.700 |
8.55 |
0.0095 |
8 |
ABS 6 |
42677 |
0.540 |
0.71 |
0.0008 |
9 |
ABS 7 |
449943 |
5.157 |
6.77 |
0.0075 |
10 |
ABS 8 |
376163 |
4.321 |
5.58 |
0.0062 |
11 |
ABS 9 |
466065 |
5.340 |
7.05 |
0.0078 |
12 |
ABS 10 |
698053 |
7.970 |
10.55 |
0.0117 |
13 |
ABS 11 |
715896 |
8.172 |
10.97 |
0.0122 |
14 |
ABS 12 |
738364 |
8.427 |
11.41 |
0.0127 |
15 |
ABS 13 |
743689 |
8.487 |
11.57 |
0.0129 |
16 |
ABS 14 |
752031 |
8.582 |
11.32 |
0.0126 |
17 |
ABS 15 |
782295 |
8.925 |
11.80 |
0.0131 |
18 |
ABS 16 |
746385 |
8.518 |
11.36 |
0.0126 |
19 |
ABS 17 |
723797 |
8.262 |
11.03 |
0.0123 |
20 |
ABS 18 |
189870 |
2.209 |
2.93 |
0.0033 |
21 |
ABS 19 |
1836744 |
20.879 |
26.96 |
0.0300 |
22 |
ABS 20 |
821681 |
9.372 |
13.84 |
0.0154 |
23 |
ABS 21 |
985347 |
11.227 |
15.26 |
0.0170 |
24 |
ABS 22 |
94776 |
1.131 |
1.46 |
0.0016 |
25 |
ABS 23 |
2546 |
0.085 |
0.11 |
0.0001 |
26 |
ABS 24 |
0 |
0.000 |
0.00 |
0.0000 |
27 |
ABS 25 |
1040184 |
11.849 |
18.95 |
0.0211 |
28 |
ABS 26 |
749238 |
8.550 |
9.19 |
0.0102 |
29 |
ABS 27 |
0 |
0.000 |
0.00 |
0.0000 |
30 |
ABS 28 |
0 |
0.000 |
0.00 |
0.0000 |
31 |
ABS 29 |
1054736 |
12.014 |
13.62 |
0.0151 |
32 |
ABS 30 |
1149796 |
13.091 |
14.86 |
0.0165 |
* Calculated by using equation No. 1
¥ Calculated by using equation No. 2
No brand of decaffeinated coffee and tea is completely decaffeinated and the two standards have been given international standard in which 97% of the caffeine must be removed from the beans or the EU standard in which 99.9% caffeine must be removed from the beans (Blackstock & Colin, 2004). 40 ppm (Acetaminophen) and 100 ppm of target analyte (caffeine) were run separately which produced the retention time of 5.292 and 8.532 minutes, respectively. This calibration curve was used to estimate caffeine content. Recovery of internal standard from the calibrators was compared with that of pure IS run and there was no appreciable difference in the recovery. The values of IS in samples were lesser as compared with the response of IS present in the calibrators. This loss of IS in samples was adjusted to purpose the original value. Loss in IS is proportional to the loss of analyte (caffeine) from the sample which can be due to the matrix effects. There are two types of controls that are routinely used as negative and positive controls which are usually found in most type of experiments. The successful results of both controls use to eradicate the error during experiment which means that the expected results will only be positive when the experimental results are positive and expected negative results will indicate that results are negative. The NQC showed no caffeine of target analyte even it was run after the calibrators. This, thus, explains the absence of carry over and provides a mean of reliability of the selected methods. These results are within limits and meet the EU and the international standard for percentage limits of decaffeinated coffee and tea. According to the international standard 97% of the caffeine should be from the beans and according to the EU standard that 99.9% caffeine-free from beans by mass (6).
ACKNOWLEDGMENTS
This research project was done at the Institute of Biochemistry and Biotechnology and WTO Laboratory, University of Veterinary and Animal Sciences, Lahore.
- Bennett AW, Bonnie KB. 2001. The world of caffeine, The science and culture of the World’s Most Popular Drug. Roultledge, ISBN 0415927226. p. 228.
- Dorea JG, Da costa HM. Is coffee a functional food?. British Journal of Nutrition., 2005; 93: 773-782.
- Nehlig A. Exploring biotechnology. Chem tech, 1999; 29: 30–35.
- Ogita S, Uefugi H, Yamaguchi Y, Koizumi N, Sano H. Producing decaffeinated coffee plants. Nature. 2003; 423: 823.
- Farah A, De paulis T, Trugo LC, Martin PR. Chlorogenic acids and lactones in regular and water-decaffeinated arabica coffee. In J Agric Food Chem. 2006; 54: 374–381.
- Blackstock and Colin 2004. Scientists discover decaf coffee bean. London: Guardian Unlimited. Retrieved 10 October 2010.
© The Author(s) 2018. Open Access. This article is distributed under the terms of the Creative Commons Attribution 4.0 International License which permits unrestricted use, sharing, distribution, and reproduction in any medium, provided you give appropriate credit to the original author(s) and the source, provide a link to the Creative Commons license, and indicate if changes were made.